
Increasing Resilience in Production Networks: A Practical Approach
Based on Scenario Planning and Simulation-Based Capacity Analysis
David Kunz
1a
, Tim Maisel
2
, Andreas Kunze
2
and Jörg Franke
1b
1
Institute of Factory Automation and Production Systems (FAPS), Friedrich-Alexander-Universität Erlangen-Nürnberg,
Egerlandstraße 7-9, 90158 Erlangen, Germany
2
Siemens Healthineers AG, Siemensstr. 3, 91301 Forchheim, Germany
Keywords: Resilience, Simulation, Scenario Planning, Simulation-Based, Capacity Analysis, Global Production
Networks, International Supply Chains, Case Study.
Abstract: In the current global economic landscape, companies with an international presence face the challenge of
ensuring that their production networks are not only efficient but also resilient to unpredictable events. Recent
technological advancements and the close integration of global production networks have been increasingly
disrupted. During times of global crises, it becomes evident that traditional approaches are no longer sufficient.
Therefore, the focus is shifting from reactive measures to proactive prevention. This paper presents a novel
approach for increasing resilience in a production network based on a combination of systematic foresight of
unpredictable events using scenario planning and a simulation-based capacity analysis for the identified
scenarios. To demonstrate and validate the application of the proposed approach, a case study for the
production network of a large German healthcare company is conducted and presented.
1 INTRODUCTION
The integration of globally spread-out production
sites and rapid technological advancements have led
to increased optimization of resource utilization.
However, this has also increased vulnerability to
interruptions in production. To combat these issues,
the focus has shifted from reactive measures to
proactive prevention. (Schollemann et al., 2022)
The term resilience is frequently used in both
natural and social sciences (Hoffmann, 2017), and has
more recently been applied to organizations and
production networks. Resilience is commonly
defined as the measure of the persistence of systems
and their ability to absorb change and disturbance, as
defined in (Holling, 1973).
Overall, resilience is not only about getting back
to the initial state after a failure occurs but also means
to adopt to the changing circumstances (Rydzak et al.,
2006). This especially relevant as some failures may
be inevitable in a complex and dynamic world.
Organizational resilience depends on the
organization and its circumstances. For example, a
financial company may encounter significant
a
https://orcid.org/0009-0002-8801-8231
b
https://orcid.org/0000-0003-0700-2028
challenges due to a loss of trust, whereas a produc-
tion-focused company may face more substantial
difficulties in the event of a key supplier’s failure
(Seville, 2008). (McManus, 2007) proposes an
expanded definition of organizational resilience that
encompasses coping with both day-to-day business
problems and longer-term change-related issues.
According to their model, resilience in manufacturing
organizations is contingent upon three factors:
situational awareness, effective management of key
vulnerabilities, and adaptability in a complex,
dynamic, and interconnected environment.
(Zhang & van Luttervelt, 2011) describe resilien-
ce in the context of manufacturing and production
systems which are depicted as a network that contains
not only directed but also undirected connections.
The authors describe five different types of failures in
a production system: oversatisfaction of demand,
inability to satisfy demand, unavailability of
resources to meet demand, damaged infrastructure,
and operations damaging internal systems. For the
authors, organisational resilience differs from the
resilience of a production system in the sense that a
158
Kunz, D., Maisel, T., Kunze, A. and Franke, J.
Increasing Resilience in Production Networks: A Practical Approach Based on Scenario Planning and Simulation-Based Capacity Analysis.
DOI: 10.5220/0012830100003758
Paper published under CC license (CC BY-NC-ND 4.0)
In Proceedings of the 14th International Conference on Simulation and Modeling Methodologies, Technologies and Applications (SIMULTECH 2024), pages 158-169
ISBN: 978-989-758-708-5; ISSN: 2184-2841
Proceedings Copyright © 2024 by SCITEPRESS – Science and Technology Publications, Lda.

stable state is not a necessary condition for the
success of a production system.
Global Production Networks (GPN) are open-
ended systems with complex links and multiple
independent actors whose goals may be in direct
conflict. They depend on a variety of internal and
external influencing factors that change dynamically
and require adaptions of the design of GPNs (Váncza,
2016). Therefore, managing GPNs involves not only
organizing production sites within the company,
which are often heterogeneous and require
differentiated consideration (Erlach et al., 2023), but
also managing strategic partners, suppliers, and
external influences from global political and
economic sources (Henderson et al., 2002).
For these reasons, companies require practical
approaches for the assessment of their vulnerabilities
and identification of potential avenues for increasing
their resilience based on their specific circumstances.
This paper argues for the close integration of GPN
simulations into the analysis of potential strategies for
increasing resilience through scenario planning. This
integration provides a more comprehensive under-
standing of the relationships within the model, reveals
the underlying assumptions and produces quantitative
estimates for developed scenarios (Paich & Hinton,
1998). In order to reduce the time and resources
required for simulation and evaluation, it is essential
to identify the most relevant and crucial scenarios at
the outset.
2 STATE OF THE ART
A variety of approaches for simulating GPNs are
discussed in existing literature. (Peukert et al., 2023)
present an approach for optimizing responses to
disturbances in GPNs using simulation models and
control circuits. The authors emphasize considering
production- and logistics related countermeasures
first. Proactive strategies are evaluated based on a
simulation model of the production network, with
experiments comparing the performances under
different conditions: (1) without disruptions and
countermeasures, (2) with disruptions, and (3) with
disruptions and countermeasures.
(Alexopoulos et al., 2023) introduce the
framework 'FLEX4RES', which supports the
reconfiguration of production networks to achieve
resilient production value chains. The introduced
platform enables the integration of live data from
production based on Gaia-X and Asset Administrati-
on Shell.
(Tan, 2020) compares various complex systems
approaches for modelling and simulating supply
chains to enhance their resilience. The evaluation is
based on modelling real supply chains and developing
mitigation and contingency strategies based on
hypothetical scenarios.
The authors in (Ivanov, 2018) investigate
disruption propagation in supply chains to increase
resilience with consideration of sustainability factors
and employ simulation to assess the impact of various
factors.
(Carvalho et al., 2012) presents a case study on
the redesign of a supply chain of a Portuguese auto-
maker to increase resilience using simulation. The
study examines two common strategies, the creation
of redundancies and of flexibilities, and evaluates six
scenarios. The simulation is restricted to the supply
chain and does not consider the impact of material
shortages on production processes.
Scenario Planning is a popular approach to
managing uncertainty in strategic planning. The focus
is on creating awareness and preparing for uncertainty
and disruptions (Cordova-Pozo & Rouwette, 2023)
which is why it has been applied to identify ways to
improve resilience in disaster mitigation (Debnath et
al., 2024).
To summarize, the existing literature mainly
focuses on simulating production networks or exami-
ning the impact of selected scenarios and counter-
measures on production networks. As resources for
increasing resilience are limited, it is essential to
identify and prioritize the most critical elements of a
system (Balakrishnan & Zhang, 2020). The
applicability of the presented approaches for
production companies seeking to enhance their
resilience is limited due to the lack of consideration
given to whether the examined failures in the
production network are relevant to the specific
companies. On the other hand, current approaches for
using scenario planning focus on areas outside of
production networks.
This publication aims to address these issues by
providing practitioners with guidelines for how to
identify areas of potential for increasing resistance in
production networks and to evaluate the scenarios and
possible countermeasures using simulation.
3 METHODS AND APPROACHES
The above examples of different strategies for
increasing resilience in a production network clearly
show that no strategy has so far been useful as a basis
for the stated objectives. Among other things, there is
a lack of reference to the capacity performance of a
production network, the rapid adaptation and
mapping of a complex GPN and the quantitative
analysis of various resilience strategies. For these
Increasing Resilience in Production Networks: A Practical Approach Based on Scenario Planning and Simulation-Based Capacity Analysis
159
reasons, a separate approach for increasing resilience
in a production network is introduced in this
publication using simulation-based capacity analyses.
As a full-factored resilience optimisation of a
GPN is a highly resource-intensive process, the
objective of the introduced approach is to initially
identify the most relevant levers. The scenario
development approach was selected to determine
these levers because of its systematic approach and
widespread application. The proposed approach
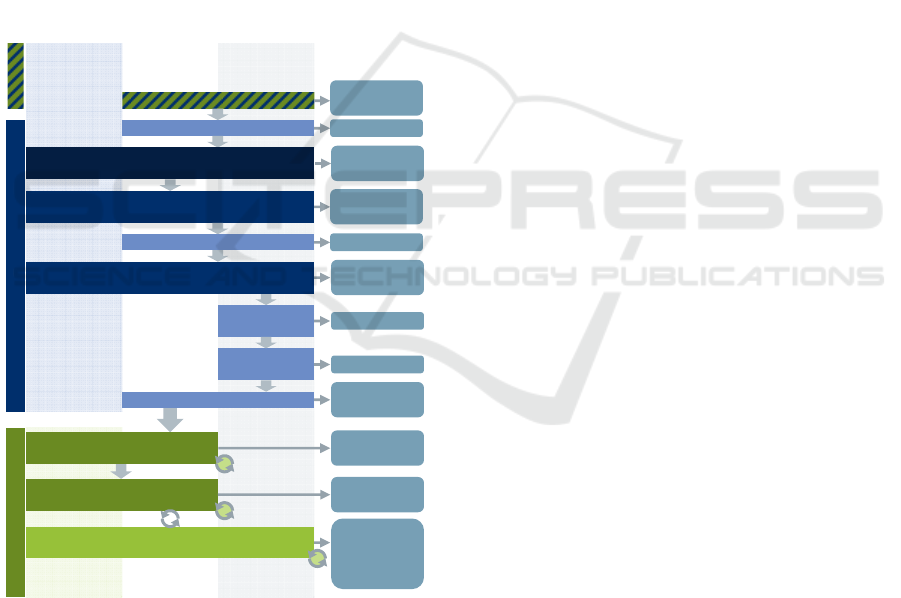
consists of three phases, as shown in Figure 1.
After specifying the project, scenarios are syste-
matically developed based on scenario planning
technique by (Gausemeier et al., 1996) in the second
phase. The identified scenarios are then modelled,
and possible countermeasures are developed and
evaluated in the third phase. Following (Cordova-
Pozo & Rouwette, 2023) this approach can be charac-
terized as following the probabilistic modified trend
school using a cross-impact analysis technique.
Figure 1: Proposed three-phase approach for increasing
resilience in production networks with forecasting
scenarios (blue) based on (Gausemeier et al., 1996) and
modelling and evaluating the scenarios (green) extended by
artefacts.
3.1 Concept for Forecast Generation
The developed approach for the forecasting of scena-
rios is based on the general scenario planning process
outlined in (Gausemeier, Fink, & Schlake, 1996).
This process has been adapted to meet the
requirements of highly dynamic and specific
production environments, refer to Figure 1.
One of the main differences is that the developed
scenarios are transferred to simulations where impact
analysis, contingency planning and robustness
planning are integrated, see chapter 3.2 for details.
The second major difference is that specialized
software catalogues and databases are not used. This
ensures that the developed forecasts are tailored
precisely to the specific circumstances of the
respective production network and are not influenced
by predetermined catalogues and databases.
Additionally, the generation and selection of base
scenarios and the visualization of the future space
should not be restricted by specialized software.
The division of tasks represents the third
significant difference. In (Gausemeier et al., 1996)
most steps are performed by an external scenario
team. The proposed process in contrast is
characterized by the cooperation of three essential
groups of actors: the project lead, main stakeholders
and the extended group of experts. The project lead is
in charge of organization, structuring and
visualization of results, whereas the main
stakeholders consist of (internal) costumers and end
users of the developed scenarios and simulations
which are very involved in the creation of the
scenarios and application of the results. The extended
group of experts is made up of experts from various
specialized areas of the production network. Ideally,
members of this group are selected by the project lead
and main stakeholders without restraints. All groups
can be employed internally in the production network
or externally, e.g. by suppliers, customers or
consulting companies, as not every production
network has the capacity for an internal scenario team
or is allowed to disclose the sensitive information
externally. The following chapters describe the
procedure for preparing the forecasts in detail.
3.1.1 Project Description
At the beginning of the project, the project description
should give a precise definition of the target values
and the intended utilization of the scenarios within the
project’s context. This involves specification of the
goals for the scenario planning as well as the
simulation project in close cooperation with the main
stakeholders. For the former, it is recommended to
follow the specification guidelines for scenario
planning in (Fink & Siebe, 2016) which include the
target audience, forecasting goals, scenario field
parallelization, scenario depths and forecasting
timescale. The necessary specifications for the
simulation project should be defined, e.g. based on
Project description
Design field analysis
Raw scenario
creation
Future space
mapping
Project plan
& specification
Design field
Grouped infl.
factors
Connectivity
matrix
Projections
Consistency
matrix
Raw scenarios
Future space
Scenarios with
description
Artefacts
Identification of influencing factors
(in joint workshop)
Connectivity analysis
(asynchronously)
Consistency analysis
(asynchronously)
Selection of projections
Extended
group
of experts
Main
stakeholders
Project lead
Scenario description
Development of Scenarios
Modelling of base
production network (PN)
Including experiments for
scenarios and countermeasures
Main
stakeholders
Project lead
Simulation
expert(s)
Evaluation of potentials
for increasing resilience
Modelling & Evaluation
Model with
scenarios
Understanding
of levers for
increasing
resilience
Simulation
model of PN
V
V
V
Planning
SIMULTECH 2024 - 14th International Conference on Simulation and Modeling Methodologies, Technologies and Applications
160

VDI 3633. This step also involves selecting the
members of the extended group of experts and
creating the project plan.
3.1.2 Design Field Analysis
The aim of the design field analysis is to identify the
components that constitute the scope of action. In the
following steps, these components are analysed in
specific scenarios. Therefore, it is crucial to identify
them and their boundaries precisely. The focus of the
design field analysis can vary depending on the
project scope, e.g. a company, product, technology or
global design field. (Gausemeier et al., 1996)
In the context of a production network, the design
field analysis focuses on identifying the sub-
processes to be included in the scenario project and
those lying outside the project framework.
For instance, sub-processes such as production
sites and suppliers within the production network may
be included in the scenario project, as their future
development is crucial for the network's performance.
Sub-processes outside the project scope may include,
for example, external customers or the development
of new products, as these areas have little influence
on the capacity of a production network.
In addition to the central sub-processes, the design
field analysis also identifies focus areas. A focus area
represents the specific points within a design field to
which scenario development should be aligned.
While focus areas can overlap within the network, it
is crucial to differentiate them clearly in their
objectives within the production network. One
example of such an area might be the 'availability of
qualified personnel', while another could be the
'attractiveness of the location'. Despite the clear
demarcation of these areas, it is possible that they
influence each other.
The design field analysis is conducted by the core
project team which includes the project lead(s) and
the main stakeholder group.
3.1.3 Identification of Influencing Factors
The third step in the process involves identifying
influencing factors through a workshop including the
extended group of experts. Participant are assigned to
a specific focus area based on their experience and
position in the company. Each participant indepen-
dently collects influencing factors for their assigned
focus area through brainstorming.
The participants then share and discuss their
results, categorizing their collected influencing
factors into grouped influencing factors within each
design field. Grouped influencing factors are made up
of very similar or identical influencing factors and
reflects the focal points within a focus area. In the
third step, the grouped influencing factors are
collected amongst all groups and refined and
developed further. The workshop aims to develop
comprehensive factors for each focus area, by
identifying detailed influencing factors. The process
involves brainstorming, categorization and refine-
ment to set comprehensive priorities.
As preparation for the following steps it is
essential to have a shared definition of the groups of
influencing factors. Therefore, a description is
created for each group of influencing factors after the
workshop.
3.1.4 Connectivity Analysis
To identify the areas of influence with the greatest
impact on the production network, a connectivity
analysis consisting of a matrix of direct influence
(MDI) and a significance matrix is carried out. The
proposed method recommends an asynchronous
approach instead of performing the analysis in a
workshop, as exchange between the participants is
not required which allows more extended experts to
participate in this step.
An MDI is used to assess the influence of the
grouped influencing factors on each other by evalua-
ting the extent to which the influencing factor in the
row influences the influencing factor in the column.
Based on the evaluation, the four characteristic values
active sum, passive sum, dynamic index and momen-
tum index can be calculated in the completed MDI.
In addition to the behaviour of the influencing
factors, the importance of each factor is assessed
using a relevance matrix, which identifies the more
relevant influence for each pair of influences.
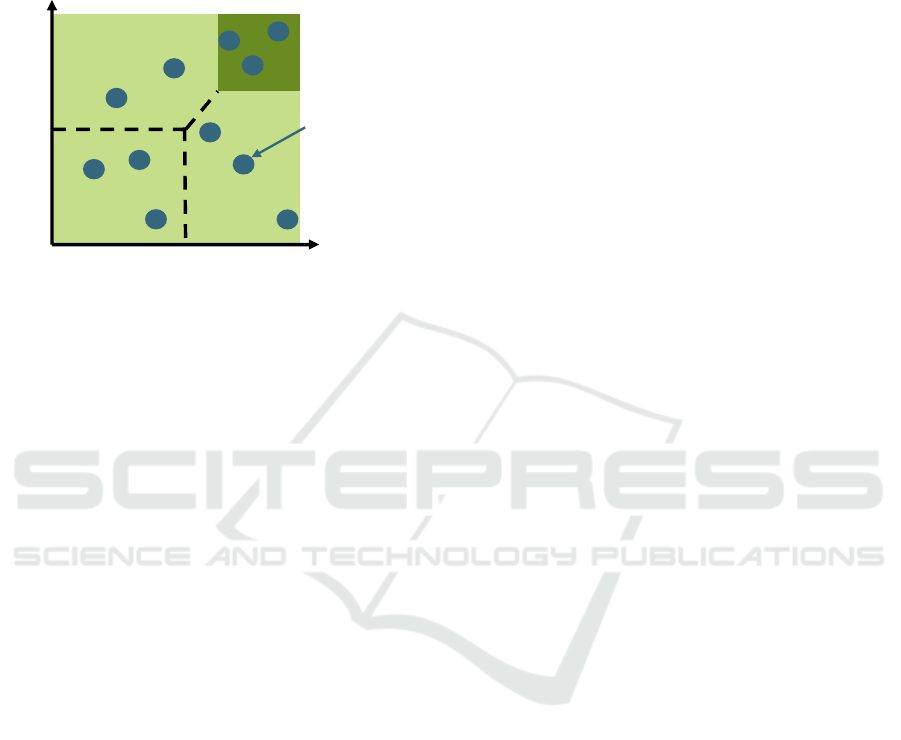
With the two matrices, a connectivity and rele-
vance score is calculated for each influencing factor.
Their ranked results are visualized as Connectivity-
Relevance-Grid in Figure
2, based on which key
factors with high connectivity and high relevance can
be identified. Furthermore, other possible key factors
with high connectivity but low relevance and vice
versa can be determined. (Fink & Siebe, 2016)
When identifying the key factors within a
production network, the key factors with a high
degree of relevance and a high degree of connectivity
should be used for a targeted prioritization and focus
on the performance of the production network for the
further process. Key factors with high relevance and
low interconnectedness should not be neglected as
they can have a major impact on the performance of
Increasing Resilience in Production Networks: A Practical Approach Based on Scenario Planning and Simulation-Based Capacity Analysis
161
the production network despite their low connectivity.
Influencing factors with high connectivity but low
relevance can be neglected for the rest of the process,
as they influence the other factors but have little
discernible impact on performance.
Figure 2: Connectivity-Relevance-Grid based on (Fink
& Siebe, 2016).
3.1.5 Creation of Future Projections
Building on the identified key factors, possible states
for each are determined and described in the form of
future projections. The creation of future projections
is a joint task of the project lead and main
stakeholders. A variety of information sources are
used, including internal information on risk
management in the production network, current
trends, company reports and external information
sources such as scientific reports and publications.
Three future projections are developed for each key
factor, each representing a positive, a neutral and a
negative development of the key factor.
These projections serve an essential role in
informing future decisions, as subsequent scenarios
are developed and refined based on them. The future
projections are deliberately exaggerated in order to
describe the projections in as much detail as possible.
It is very important that these projections are distinct
and unambiguous, reflecting potential developments
of key factors without emphasizing the causes or
consequences. Each projection for a key factor should
cover the full range of possible developments and be
compatible with the other key factors. Failure to do
so, may result in inconsistencies in the subsequent
analysis when establishing consistency between the
key factors. (Fink & Siebe, 2016; Gausemeier et al.,
1996)
Particular attention should be paid to adapting the
descriptions to the production network’s specific
circumstances in order to avoid an overly general or
overly dramatic presentation of the future scenarios.
3.1.6 Consistency Analysis
The main objective of the consistency analysis is to
assess the consistency of the future projections for
various key factors. Each participant rates the
consistency of the future projections between the
different key factors. The assessment is done for pairs
of key factors and on a scale from 1 (complete incon-
sistency) to 5 (strong mutual support). It is important
to emphasize that this assessment only evaluates the
consistency between the respective pairs of future
projections and not their probability. The individual
consistency assessments are then summarized by
averaging to form an overall consistency analysis.
Various possible projection bundles can be created on
the basis of this analysis, whereby a projection bundle
consists of the combination of exactly one future
projection for each of the key factors. (Fink & Siebe,
2016; Gausemeier et al., 1996)
The consistency analysis is carried out by all
members of the project team and the ratings entered
into a matrix. As three future projections are created
for each key factor, 3
n
projection bundles must be
examined as part of the consistency analysis.
3.1.7 Creation of Raw Scenarios
Due to the large number of projection bundles, it
becomes necessary to reduce them. If at least one
combination within the scenario bundle is evaluated
as inconsistent, it is excluded from further considera-
tion. Here, the use of support through algorithms is
essential. The probability of the projection bundles
occurring deliberately plays no role here, as this
process is more about thinking ahead than making
concrete predictions. In a second step, the remaining
projection bundles are sorted according to their
consistency values. The consistency value of a
projection bundle is the sum of the consistency
ratings of all the future projections contained in this
bundle.
3.1.8 Future Space Mapping
To effectively communicate the results and provide a
quick overview of the structure of the resulting raw
scenarios, the raw scenarios are presented graphically
as part of the future space mapping. Various display
options may be suitable, such as diagrams, portfolios,
biplots, shapes, colours and symbols, which can be
used flexibly depending on the application. (Fink
& Siebe, 2016; Gausemeier et al., 1996).
Relevance (Rank)
Connectivit
y
(
Rank
)
Clear
key factors
Possible additional
key factors with
high relevance
Key factors
with high
connectivity
Key
factors
SIMULTECH 2024 - 14th International Conference on Simulation and Modeling Methodologies, Technologies and Applications
162

3.2 Derivation of a Simulation-Based
Strategy
The methodically prepared qualitative scenarios by
themselves are not sufficient to comprehensively
analyse the complex and dynamic interactions
between the various key factors of a production
network and evaluate future strategical decisions.
Simulations can be used to convert these qualitative
scenarios into quantifiable estimates by depicting
complex interactions over time and thus supporting
decisions. In addition, a simulation model allows to
quantify the effects of changing variables on the
overall system by conducting multiple experiments.
Figure 1 showcases the proposed approach for
integrating the developed scenarios into simulations
of the production network for creating a holistic
simulation-based strategy which is loosely based on
(Shannon, 1998). Note that the extended group of
experts from chapter 3.1 is replaced by simulation
expert(s) which may also be a member of the main
stakeholders or experts. The following chapters
introduce the involved steps in more detail.
3.2.1 Modelling of Base Production Network
In the first step of modelling and evaluation, the base
model of the GPN is created by identifying the
relevant variables and specifying their relationships.
A graphical representation of the simulation model
and its results can facilitate communication with
internal and external stakeholders. It is important to
maintain a simple structure of the simulation to avoid
losing focus. Collecting the relevant information and
data is the most time-consuming aspect of modelling
(Kunz et al., 2023). Therefore, it is advisable to
involve the relevant parties early on and begin to
consider collecting information on the network even
before the final scenarios are determined.
Continuous verification and validation (V&V)
must be employed in the creation of the simulation
model. The simulation results must be plausible and
the simulation model checked for its representative-
ness for the real production network in relation to the
defined target. This usually involves the integration
of main stakeholders and key experts of the
production network.
3.2.2 Modelling of Scenarios and
Countermeasures
Once the base simulation model is verified and
validated, the scenarios and countermeasures are
implemented to enable the comparison of the base
network, with scenario and countermeasures, also see
(Peukert et al., 2023). The exact implementations
may vary depending on the specific network,
scenarios and software but it is advised to realise them
as modules for each key factor which can then be
reused across scenarios.
Feasible countermeasures are collected
throughout the entirety of the proposed process as
they come up and included here. To enable users to
influence the severity and timings of scenarios and
countermeasures, the creation of a suitable interface
is key. An appropriate visualisation of the scenarios’
results is key for understanding and discussing them
(Feldkamp et al., 2020). V&V should be employed
throughout this process.
3.2.3 Identification of Potentials for
Increasing Resilience
Using a suitable interface, simulation expert(s), main
stakeholders and other key experts are able to test the
scenarios by changing variables including effects and
timings. Users have the opportunity to test different
strategies and their impact in preparation or response
to these scenarios. This is an iterative process where
new solutions may arise during the assessment and
are implemented and tested again. Depending on the
project goals, this exploration may additionally
involve optimization algorithms.
The comprehensive analysis and modelling of the
production network and scenarios enables a deeper
understanding of the process dynamics and helps to
identify and optimize potential bottlenecks and
inefficient elements in the production chain. More
informed strategic decisions can be made based on
the explored solution space.
4 APPLICATION AND RESULTS
The proposed approach is implemented for a practical
case study in a part of the production network of a
large German company. The following chapters give
an overview of the results of this application and the
lessons learned.
The case study examines a major product line in
a German healthcare company. Production is distribu-
ted across three locations in Germany, the United
Kingdom, and China. Some products are exclusive to
one site, while others are produced at multiple
locations.
4.1 Forecasting Scenarios
In the first stage, the fundamental scenarios to
Increasing Resilience in Production Networks: A Practical Approach Based on Scenario Planning and Simulation-Based Capacity Analysis
163

increase resilience are determined following the
approach outlined in section 3.1.
4.1.1 Project Description
During the initial stage of the project, the project lead
and main stakeholders defined its context and objecti-
ves. The project's results are intended for internal use
within the company. They aim to include a
methodical elaboration of the main influences on the
production network by internal experts and a
transparent representation of the same.
Furthermore, it is considered crucial to test
potential resilience-enhancing measures through
simulation-based analyses to inform the planning of
various projects. Alternative countermeasures within
the possibilities of the production should be
demonstrated for the developed scenarios and quanti-
tatively and objectively evaluated. The alternative
scenarios should relate to network capacity and
demonstrate various capacity related options.
The depth of the scenarios should be based on
industry scenarios and appear plausible and not too
generic within the production network. With a time
horizon of five years, it is particularly important to
disregard unplanned everyday situations within the
production, such as machine breakdowns, or new
product developments. Rather, the focus should be on
unforeseen future situations that have not been
adequately considered and for which no
countermeasures have been developed yet. This
strategic focus aims to ensure the long-term resilience
of the production network and identify potential risks
at an early stage.
The acceptance criterium for the simulation is a
realistic portrayal of the production network. The
focus is on the production network with its production
sites with modelling up to basic processes. Inputs for
the simulation are market conditions, existing orders,
delivery times, production capacity, and lead times.
Its outputs are the production capacity, production
volumes, and lead times. The results should be
visualised in graphs. Furthermore, the members of the
extended group of experts from process planning,
purchasing, supply chain management and
production planning are determined at this stage.
4.1.2 Scope Analysis
As described in section 3.1.2 a careful definition of
the specific processes and focus areas is required to
further specify the scope of the analysis. The
processes are derived from an overview of the
production network, while the focus areas are defined
through discussions with the main stakeholders. In
the process, potential risks in other global companies
with comparable production networks were
considered, as well as specific product-related risks.
The key focus areas identified are geopolitical
factors, the supply chain, and production operations.
In this context, geopolitical factors refer to capacity-
dependent influences within the network. The supply
chain includes all factors between the sites, while the
production operation includes all internal factors
within the sites.
4.1.3 Identification of Influencing Factors
The identification of influencing factors is based on a
workshop including the extended group of experts as
described in chapter 3.1.3. Ten people from the
company and university participated in the workshop
which was conducted as a hybrid event. The
participants were assigned to the respective focus
areas according to their expertise. Overall, nine
unique influencing factors are identified and
duplicates such as 'availability and productivity of
employees' assigned to a single focus area, see Figure
3 for a summary.
The identified and clustered influencing factors
were then described in more detail by the project lead
in close coordination with the main stakeholders. For
example, 'Reliability and quality of suppliers' is
specified as 'The reliability and quality of suppliers
are of fundamental importance. A global company is
dependent on its suppliers for materials and services,
so close co-operation and evaluation of suppliers is
necessary.'
Figure 3: Resulting grouped influencing factors (grey)
allocated by focus area (light green).
4.1.4 Connectivity Analysis
The connectivity analysis was conducted using the
collected and specified influencing factors. The
members of all groups filled out a MDI and relevance
matrix, the results of which are summarized in Figure
4. The key factors with high relevance and
connectivity are trade policy, suppliers, and operating
resources.
Design Field of Production Network
Geopolitical Factors
Raw Materials
Supply Chain Production Operation
Operating Resources
Trade Policy Production Site
Political Stability Employees
A
B
C
Logistics
D
Suppliers
E
Market Factors
F
G
H
I
SIMULTECH 2024 - 14th International Conference on Simulation and Modeling Methodologies, Technologies and Applications
164
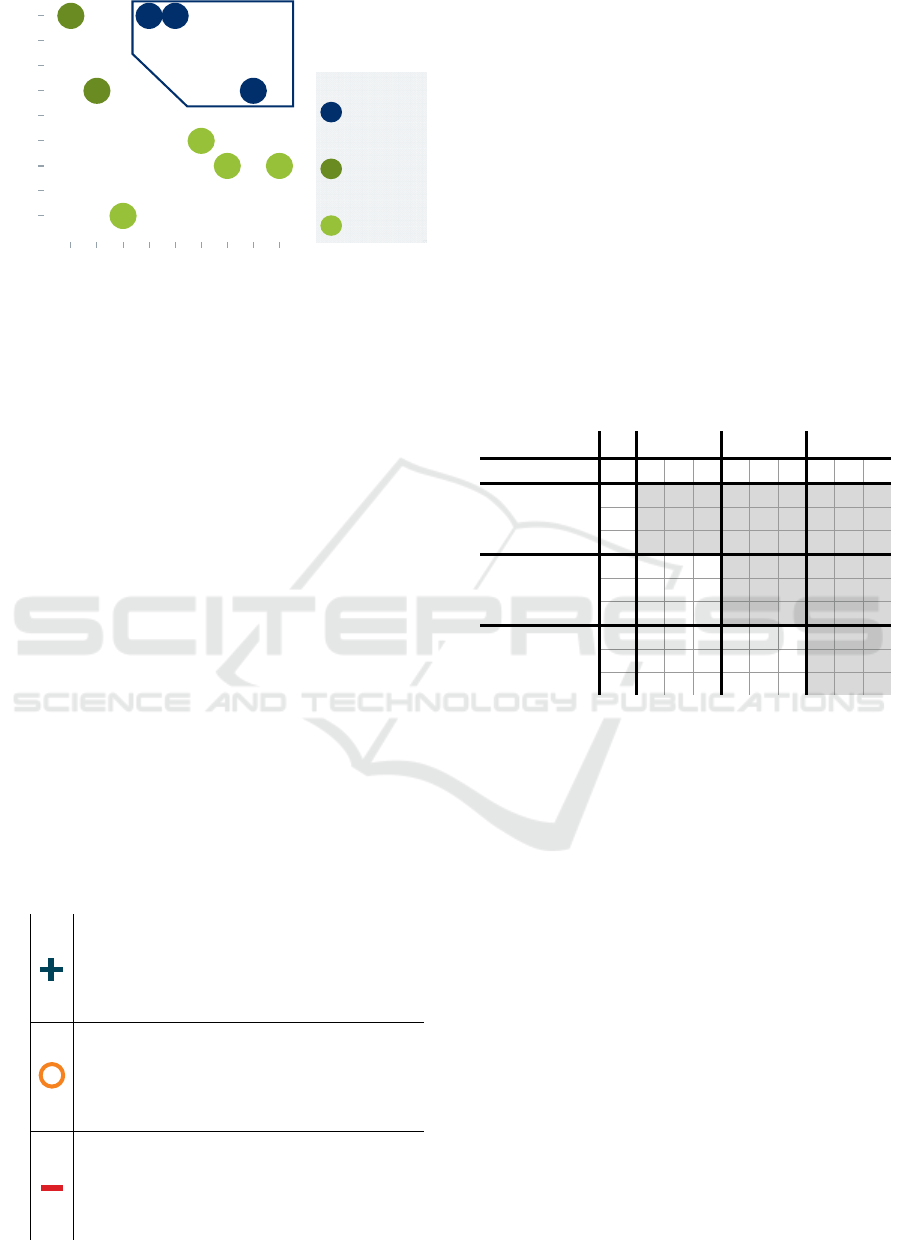
Figure 4: Results of the connectivity analysis visualized as
Connectivity-Relevance-Grid by rank. Labelling based on
Figure 3.
As stated in section 4.1.4, we considered influencing
factors with high relevance but low connectivity, such
as access to materials and raw materials (C) and
productivity and performance of employees (G).
However, we ultimately excluded them from further
analysis because the focus of the analysis is on the
connectivity of influential factors, and these two
factors are already part of existing strategic
considerations and measures.
4.1.5 Creation of Future Projections
Future projections are generated by outlining a
positive, neutral, and negative scenario for each key
factor. Special consideration is given to the unique
circumstances of the production network to prevent
an overly general or exaggerated presentation. Table
1
provides an example of the three projections for the
key factor ‘quality and performance of suppliers’.
Table 1: Projections for the key factor 'quality and
performance of suppliers' with one positive, one neutral,
and one negative development.
Quality and Performance of Suppliers
Improved supplier quality through transparent
exchange of information. The innovative
strength of suppliers leads to new and improved
p
roducts and services that further optimise
production processes.
Continuous supplier optimisation for stable
p
roduction. The innovative strength of suppliers
remains constant, continuing to provide the
same quality of products and services that help
to maintain current production levels.
Impairment of production plans by unreliable
suppliers due to internal or external factors. A
lack of innovation among suppliers means that
they are unable to keep pace with changing
requirements and technologies.
4.1.6 Consistency Analysis
The consistency analysis is performed for the key
factors along with their descriptions. A matrix of
projections ranging from total inconsistency (1) to
strong mutual support (5) is evaluated by the partici-
pants of the initial workshop. The averaged results are
presented in Table
2.
The range of values and relative consistency of
the evaluations suggest a well-developed set of key
factors and their projections. The medium values,
ranging from 2 to 4, are mostly independent of each
other. The main focus for further analysis is on the
pairs with high connectivity as this indicates a highly
connected and complex dynamic of the key factors.
Table 2: Resulting influencing factors allocated by key
factors. Positive projections indicated by plus, neutral by
circle and negative by minus symbols.
KF Raw. Mat. Suppl. Op. Res.
Key factor (KF) Dev. + ◯ – + ◯ – + ◯ –
Raw Materials
(Raw. Mat.)
+
◯
–
Suppliers
(Suppl.)
+ 4,7 2,3 1,5
◯ 2,2 3,8 4,2
– 2,5 4,0 1,0
Operating
resources
(Op. Res.)
+ 3,5 2,3 4,0 4,0 2,7 2,0
◯ 1,5 4,0 1,8 1,8 4,7 4,2
– 1,8 3,7 2,0 2,0 3,8 4,8
4.1.7 Creation of Raw Scenarios
In the next step, raw scenarios are created from the
key factors and their consistency. An algorithm is
used to create projection bundles that combine future
projections of each key factor. In this case, there are
27 projection bundles (3³). Any bundles with an
evaluation consistency smaller than 3 are considered
inconsistent and excluded from further analysis.
Based on this, ten realistic projection bundles remain.
The six projection bundles with the highest
consistency score contain predominantly positive or
neutral future projections. This suggests that the
extended expert group is generally optimistic about
the future development of the key factors.
4.1.8 Future Space Mapping
To infer future spaces and effectively communicate
the acquired results they are visualised in this step. A
scenario map, which is common in scenario planning,
is not suitable in this case as the projection bundles
cannot be arranged in a meaningful way. Instead,
A
13579
1
3
5
7
9
Connectivity (Rank)
Relevance (Rank)
B
C
D
E
F
G
H
I
Potential Key
Factors with
high Relevance
X
X
Clear Key
Factors
Not Relevant
Factors
X
Legend
Increasing Resilience in Production Networks: A Practical Approach Based on Scenario Planning and Simulation-Based Capacity Analysis
165
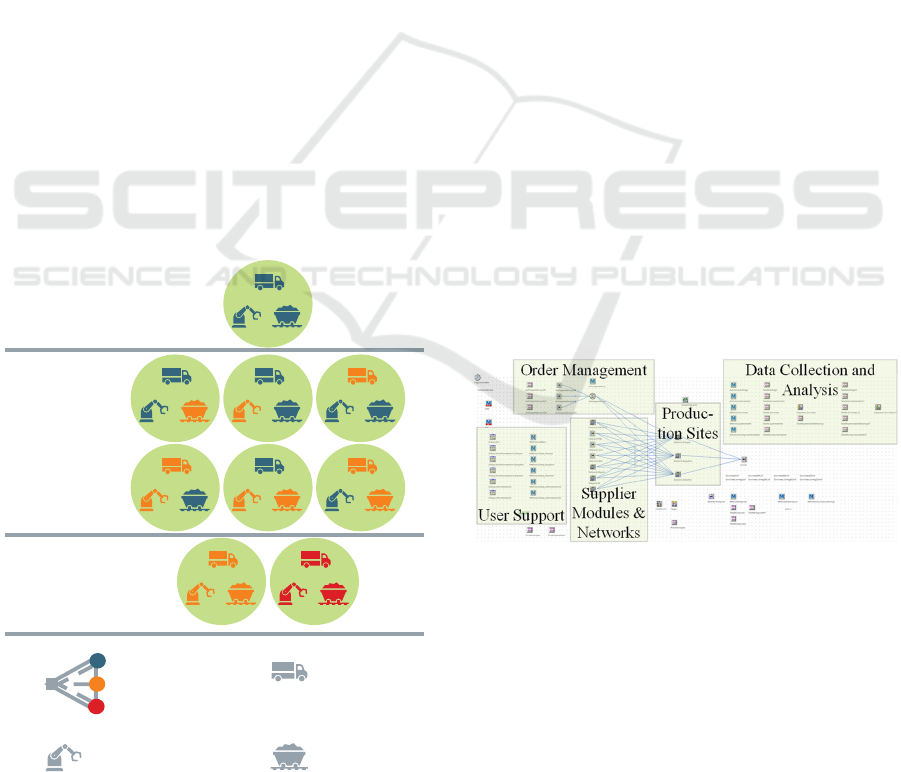
each key factor is indicated by a symbol coloured
according to the projected development, see Figure 5.
The future space is grouped according to its
influence on the capacity of the production network,
consistent with the previously defined project goals.
If all projections are positive (bundle 1), the capacity
flexibility is high. For bundles with one neutral
projection (2A, 2B, and 2C) or two neutral projec-
tions (3A, 3B, and 3C), the capacity flexibility is
medium to high. If all projections are neutral
(bundle 4) or negative (bundle 5), the capacity
flexibility is low to medium.
This differentiation allows for precise adjustment
of the specific capacity needs, based on which
different strategies for increasing resilience can be
assigned. In a future space with limited to moderate
capacity flexibility in the production network,
resilience can only be improved by effectively
overcoming the challenges within the network.
Increasing the resilience in future spaces with high
capacity flexibility is not essential as the production
network already encompasses an inherently high
flexibility to react to unexpected situations. Therefore,
the further focus is on increasing resilience for the
future space with medium to high capacity flexibility.
These projection bundles are the foundation for the
subsequent steps that demonstrate ways to enhance
resilience in production networks supported by
simulation.
Figure 5: Future Space Mapping for the developed
projection bundles.
4.2 Integration of Simulation-Based
Capacity Analysis
This section outlines the systematic implementation
of the approach for integrating simulations into the
scenario planning, as described in section 3.2. This
includes conducting a simulation-based capacity-
analysis and the derivation of strategies for increasing
resilience.
4.2.1 Modelling of Production Network
The production network was modelled in Plant
Simulation using discrete-event simulation network
due to existing licensing and the ability to build on
previous modules and experiences.
The simulation is structured in three levels. On
the process level, variables and objects which depict
critical production processes such as bottlenecks or
unstable processes are managed. This covers specific
aspects which focus on single steps and activities of
the production process. The site level is broader and
introduces variables and objects which impact the
lead times of the entire process flow, shift systems or
supply cycles of each specific site. At the network
level the sites and suppliers are connected to each
other. Variables of higher levels are influenced by
lower levels, e.g. the lead time for the specific site
depends on the critical processes within the site. This
can also lead to delayed deliveries at the network
level which underlines the complex relationships
between levels and sites. Figure 6 provides an
overview of the simulation model at the site level.
Figure 6: Overview of simulation model at network level.
The model contains three functional base
modules. The supplier module contains external and
internal procurement which are simulated as simple
module for uncritical suppliers or as complex net-
works. It acts as supply component for the production
modules and provides them with components such as
raw materials, semi-finished goods and other materi-
als. The production modules model the production
sites with networks including the individual
production processes. The functional modules enable
High
capacity
flexibility
Medium to high
capacity
flexibility
Low to medium
capacity
flexibility
Quality and
performance of
suppliers
Availability and
efficiency of operating
resources
Availability of
materials and raw
materials
Legend:
Positive development
Negative development
Neutral development
1
2B2A 2C
3B3A 3C
54
SIMULTECH 2024 - 14th International Conference on Simulation and Modeling Methodologies, Technologies and Applications
166
the configuration of scenario parameters with a dialog
window and visualizes simulation results and reports.
The order management facilitates the
redistribution of orders across the production network
by providing them to the relevant production sites
which then initiate the production processes. The
production networks order the required components
from the supplier modules and networks where
varying delivery concepts such as supermarket or
just-in-sequence are implemented.
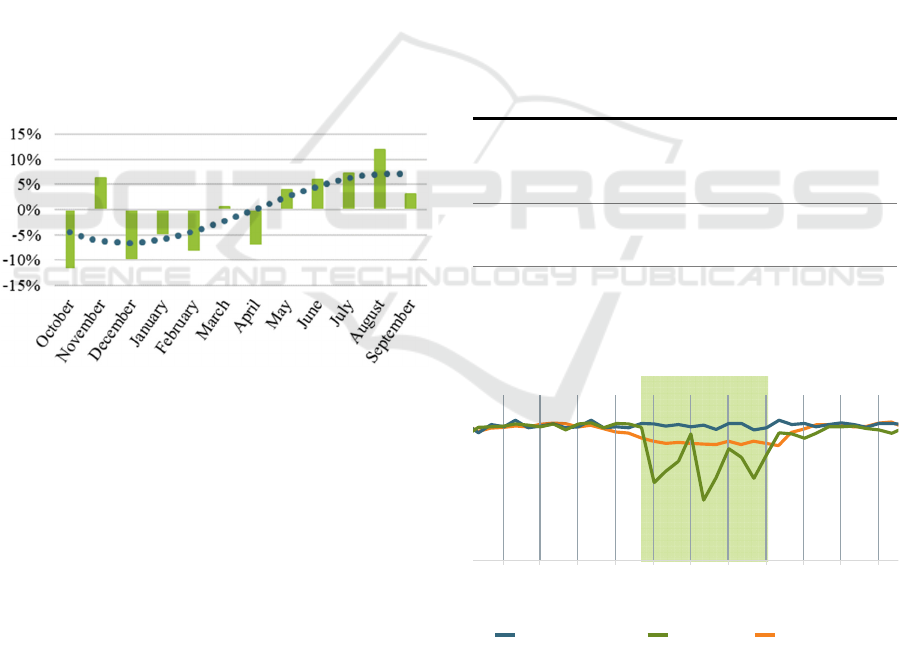
A set of fixed-value tests demonstrates that the
simulation accurately mirrors the production
network, with a maximum deviation of only 13% for
the combined network, also see Figure 7. Averaged
over an entire fiscal year (FY) the simulation deviates
by 0.42 %.
In addition to the fixed value tests, the simulated
production network is verified through a review in
which the management, client, and supplier of the
simulation model checked the model’s inherent
consistency and specification fulfilment. Further
V&V techniques are difficult to implement in this
context as real-world data on the impact of
disruptions is scarce (Tan, 2020).
Figure 7: Relative deviation between actual and simulated
delivery of products over a fiscal year with blue trend line.
4.2.2 Modelling of Scenarios and
Countermeasures
Once the base model of the production network is
verified and validated the scenarios and
countermeasures are implemented. As described in
section 3.2.2, the implementation is based on a
module for each influencing factor. These modules
are triggered based on the selected scenario and initia-
lize scenario-specific changes.
Out of the implemented scenarios, scenario 3C is
presented in detail in the following. Table 3 presents
an overview of how the development of the key
factors in this scenario is realised in the simulation
model. To model the neutral development of the key
factor quality and performance of suppliers the
delivery of products for one crucial supplier was
changed to a normal distribution over a set timeframe
to simulate unreliable delivery times. During this, the
components are no longer delivered on a daily basis,
but follow a normal distribution. The results of this
simulation are shown in Figure 8.
The normal distribution of deliveries from a key
supplier in the period from the 12
th
month in FY1 to
the 10
th
month in FY2 has a significant impact on the
overall throughput of the production network. The
volatile fluctuations are a plausible result of a
normally distributed delivery from a main supplier.
Once the delivery problems have been resolved, the
throughput returns to the previous level with a slight
delay. Minor differences between the results of the
basic simulation and the scenario simulation are due
to the dynamics of the simulation and negligible. The
positive development of the key factor 'availability
and efficiency of operating resources' has no impact
due to the neutral development of the other key
factors.
Table 3: Realisation of scenario 3C in simulation model.
Key Factor
Develo-
pment
Simulation Model
Availability and
efficiency of
operating
resources
Positive
Increased availability of
blocks in production sites
Availability of
materials and raw
resources
Neutral
Materials and
components are produced
steadil
y
Quality and
performance of
suppliers
Neutral
One crucial supplier de-
livers the products with a
normal distribution for
set timeframe.
Figure 8: Results of a simulation run for scenario 3C.
In response to the events of scenario 3C described
above, a reactive countermeasure is implemented in
the form of a second supplier. This additional supplier
is now responsible for delivering about ten percent of
the critical items. The attached chart in Figure 8
Scenario duration
Januar 25
April 25
Juli 25
Oktober 25
Januar 26
April 26
Juli 26
Oktober 26
Januar 27
April 27
Juli 27
Delivery Rate
Y1Q1
Y1Q4
Y1Q2
Y1Q3
Y2Q1
Y2Q2
Y2Q3
Y2Q4
Y3Q1
Y3Q2
Y3Q3
Base simulation Scenario
Scenario +
Countermeasure
Increasing Resilience in Production Networks: A Practical Approach Based on Scenario Planning and Simulation-Based Capacity Analysis
167

shows that this measure was able to mitigate the
negative impact, but not fully compensate for it.
Nonetheless, the performance of the production
network is able to reach stable condition sooner and
is therefore more resilient. However, there are other
associated costs, such as increased expenses and
existing joint strategic partnerships with the supplier.
The key factors alignment can have varying
impacts which are considered in the simulation, e. g.
instead of changing the rate of deliveries, the quality
of products can be varied, changing the rate of
rework, to characterize the development of the
suppliers. This step also involves visualising the
results and creating an interface to allow a simple
manipulation of variables.
4.2.3 Identification of Potentials for
Increasing Resilience
In the final step, the potentials for increasing
resilience are evaluated based on the created
simulation model by inserting countermeasures for
the specific scenarios. This allows observation of the
impact of potential measures and the time required to
reach a stable condition again.
Members of the project team and other key
experts are enabled to make more informed decisions
by evaluating the impact of the previously identified
scenarios on the production network and trial
potential countermeasures, such as increasing safety
stock, and observing the impacts, and combinations
thereof. This is an iterative process where new
countermeasures are devised and implemented into
the simulation model.
4.3 Lessons Learned
A number of lessons were learnt during the imple-
mentation and evaluation of the case study. It is
recommended to involve the extended experts often
and at an early stage in order to avoid scenarios that
are too specific or too general. This also helps to
improve access and quality of data, both of which are
crucial for the quality of the results. The consulted
experts should come from as many different
backgrounds and departments as is reasonable.
The process enabled all parties to gain a more
comprehensive understanding of the potential risks to
the production network under review. This
understanding was deepened by the systematic testing
of countermeasures in the developed model.
Users gained an understanding of the system's
inertia and reaction speed, and how the production
network reacts to different scenarios and possible
countermeasures. A flexible interface for adapting the
scenarios and countermeasures is key for enabling
this evaluation.
In accordance with the project's defined goals, the
costs associated with the introduction of certain
countermeasures and optimisation algorithms have
not been included in the simulation. However, their
addition is being considered for future projects.
At this point, it must be emphasized that a
simulation model is not able to accurately calculate
the future. Rather, it serves to point in the right
direction and to understand the production network
and its reactions to changes. The implemented
scenarios and countermeasures must always be
critically examined and V&V performed before
measures are put into action.
5 CONCLUSION AND OUTLOOK
The complexity of today's GPNs has made them
vulnerable to production disruptions. Therefore,
recent focus has shifted from reacting to disruptions
to proactive prevention. Existing literature does not
adequately address the needs of organisations aiming
to increase their resilience.
The proposed approach focuses on increasing the
resilience in a three-phase process.
In the first phase the project’s goals are specified.
After which the second phase involves the identifyca-
tion of the most pertinent scenarios, which are
subsequently subjected to simulation. This approach
allows for a more focused and efficient allocation of
modelling and evaluation resources, directing them
towards the most critical aspects of the production
network.
In the conducted case study, the involved
individuals gained a deeper comprehension of the
interactions within the considered production
network and the potentials for increasing resilience.
They were also able to experiment with the
consequences of various preventive and corrective
measures, thereby enhancing their decision-making
abilities.
Future research should concentrate on conducting
additional case studies with the objective of further
validating the proposed process and developing
guidelines for estimating the associated costs for an
implemented countermeasure with reasonable efforts.
ACKNOWLEDGEMENTS
We would like to thank Siemens Healthineers Ag for
SIMULTECH 2024 - 14th International Conference on Simulation and Modeling Methodologies, Technologies and Applications
168

their continued collaboration and support throughout
the project. The research was supported by VDI/VDE
grant “BayVFP Förderlinie Digitalisierung” with the
funding reference number DIK0279/01.
REFERENCES
Alexopoulos, K., Weber, M., Trautner, T., Manns, M.,
Nikolakis, N., Weigold, M., & Engel, B. (2023). An
industrial Data-spaces Framework for Resilient
manufacturing value chains. Procedia CIRP, 116, 299–
304. https://doi.org/10.1016/j.procir.2023.02.051
Balakrishnan, S., & Zhang, Z. (2020). Criticality and
Susceptibility Indexes for Resilience-Based Ranking
and Prioritization of Components in Interdependent
Infrastructure Networks. Journal of Management in
Engineering, 36(4), Article 04020022. https://doi.org
/10.1061/(ASCE)ME.1943-5479.0000769
Carvalho, H., Barroso, A. P., Machado, V. H., Azevedo, S.,
& Cruz-Machado, V. (2012). Supply chain redesign for
resilience using simulation. Computers & Industrial
Engineering, 62(1), 329–341. https://doi.org/10.
1016/j.cie.2011.10.003
Cordova-Pozo, K., & Rouwette, E. A. (2023). Types of
scenario planning and their effectiveness: A review of
reviews. Futures, 149, 103153. https://doi.org/
10.1016/j.futures.2023.103153
Debnath, R., Pettit, C., van Delden, H., & Perez, P. (2024).
Collaborative modelling for goal-oriented scenario
planning: A resilience planning case study in the
context of greater Sydney. International Journal of
Disaster Risk Reduction, 100, 104205.
https://doi.org/10.1016/j.ijdrr.2023.104205
Erlach, K., Berchtold, M.‑A., Kaucher, C., & Ungern-
Sternberg, R. (2023). Gestaltung resilienter
Produktionsnetzwerke mit Agilitätsbefähigern.
Zeitschrift Für Wirtschaftlichen Fabrikbetrieb, 118(4),
217–221. https://doi.org/10.1515/zwf-2023-1047
Feldkamp, N., Bergmann, S., & Strassburger, S. (2020).
Knowledge Discovery in Simulation Data. ACM
Transactions on Modeling and Computer Simulation,
30(4), 1–25. https://doi.org/10.1145/3391299
Fink, A., & Siebe, A. (2016). Szenario-Management: Von
strategischem Vorausdenken zu zukunftsrobusten
Entscheidungen. Campus Verlag.
Gausemeier, J., Fink, A., & Schlake, O. (1996). Szenario-
Management: Planen und Führen mit Szenarien (2.,
bearb. Aufl.). Hanser.
Henderson, J., Dicken, P., Hess, M., Coe, N., &
Yeung, H. W.‑C. (2002). Global Production Networks
and the Analysis of Economic Development. Review of
International Political Economy, 9(3), 436–464.
http://www.jstor.org/stable/4177430
Hoffmann, G. P. (2017). Organisationale Resilienz:
Kernressource moderner Organisationen. Springer
Berlin Heidelberg; Imprint: Springer. https://permalink.
obvsg.at/AC12324391 https://doi.org/10.1007/978-3-
662-53944-6
Holling, C. S. (1973). Resilience and Stability of
Ecological Systems. Annual Review of Ecology and
Systematics, 4(1), 1–23. https://doi.org/10.1146/
annurev.es.04.110173.000245
Ivanov, D. (2018). Revealing interfaces of supply chain
resilience and sustainability: a simulation study.
International Journal of Production Research, 56(10),
3507–3523. https://doi.org/10.1080/00207543.2017.13
43507
Kunz, D., Weber, J., Barth, M., & Franke, J. (2023). Virtual
Commissioning and the use of Extended Reality and
Automated Testing: A survey of industry. Advance
online publication. https://doi.org/10.22032/dbt.57812
(20. ASIM Fachtagung Simulation in Produktion und
Logistik 2023, p. 241).
McManus, S. (2007). Organisational Resilience in New
Zealand [PhD thesis]. Department of Civil Engineering,
University of Canterbury, New Zealand.
Paich, M., & Hinton, R. (1998). Simulation Models: A Tool
for Rigorous Scenario Analysis. In L. Fahey (Ed.),
Learning from the future: Competitive foresight
scenarios. Wiley.
Peukert, S., Hörger, M., & Zehner, M. (2023). Linking
tactical planning and operational control to improve
disruption management in global production networks
in the aircraft manufacturing industry. CIRP Journal of
Manufacturing Science and Technology, 46, 36–47.
https://doi.org/10.1016/j.cirpj.2023.07.009
Rydzak, F., Magnuszewski, P., Sendzimir, J., & Chlebus, E.
(2006). A Concept of Resilience in Production Systems.
In Proceedings of the 24
th
Int. Conference of the System
Dynamics Society, Nijmegen, Netherlands: Radboud
Universiteit Nijmegen.
Schollemann, A., Wiesch, M., Brecher, C., & Schuh, G.
(2022). Resilience Drivers in Next Generation
Manufacturing. In F. T. Piller, V. Nitsch, D. Lüttgens,
A. Mertens, S. Pütz, & M. van Dyck (Eds.),
Contributions to Management Science. Forecasting
Next Generation Manufacturing (pp. 119–128).
Springer International Publishing. https://doi.org/10.
1007/978-3-031-07734-0_8
Seville, E. (2008). Resilience: great concept but what does
it mean? presented at the Risk Intelligence and
Resilience Workshop, Wilmington, USA.
Shannon, R. E. (1998). Introduction to the art and science
of simulation. In 1998 Winter Simulation Conference.
Proceedings (Cat. No.98CH36274) (pp. 7–14). IEEE.
https://doi.org/10.1109/WSC.1998.744892
Tan, W. J. (2020). Modelling and simulation of supply
chain resilience using complex system approaches.
https://doi.org/10.32657/10356/137144
Váncza, J. (2016). Production Networks. In T. I. A. f. Produ,
L. Laperrière, & G. Reinhart (Eds.), CIRP
Encyclopedia of Production Engineering (pp. 1–8).
Springer Berlin Heidelberg. https://doi.org/10.1007
/978-3-642-35950-7_16829-1
Zhang, W. J., & van Luttervelt, C. A. (2011). Toward a
resilient manufacturing system. CIRP Annals, 60(1),
469–472. https://doi.org/10.1016/j.cirp.2011.03.041
Increasing Resilience in Production Networks: A Practical Approach Based on Scenario Planning and Simulation-Based Capacity Analysis
169
