
Roadmap for Implementing Business Intelligence Systems in Higher
Education Institutions: Validation of a Case Study at the University
of Trás-os-Montes and Alto Douro
Romeu Sequeira
1a
, Arsénio Reis
1,3 b
, Frederico Branco
1,3 c
and Paulo Alves
2d
1
School of Science and Technology, University of Trás-os-Montes and Alto Douro, Quinta dos Prados, Vila Real, Portugal
2
Research Centre in Digitalization and Intelligent Robotics (CeDRI),
Instituto Politécnico de Bragança, Bragança, Portugal
3
INESC TEC - Institute for Systems and Computer Engineering, Technology and Science, Porto, Portugal
Keywords: Business Intelligence, System Validation, Higher Education, Dashboards, Decision-Making.
Abstract: The adoption of effective policies and access to relevant information are critical to improving strategic
management and performance monitoring in Higher Education Institutions (HEIs), which is essential to
promote data-driven decision-making. This article describes how an HEI can carry out the validation process
when implementing a Business Intelligence (BI) system, and provides a detailed guide to doing so. Through
a case study at the University of Trás-os-Montes and Alto Douro, a structured roadmap is validated, which
acts as a visual and sequential guide to facilitate the effective implementation of BI solutions. The validation
carried out through semi-structured interviews with experts and evaluation of dashboards by user groups, not
only confirms the applicability and efficiency of the proposed model but also emphasises its practical
relevance, providing valuable insights for the adaptation and use of BI in different educational contexts.
1 INTRODUCTION
Higher Education Institutions (HEIs) face persistent
challenges in developing effective strategies and
accessing relevant information necessary for
monitoring their performance and guiding strategic
management in alignment with their specific missions
and strategies (Calitz et al., 2018; Nieto et al., 2019;
Valdez et al., 2017). Accurate performance
assessment and proficient management of
Information Technologies (IT) are crucial for
translating strategies into effective operational
actions and enhancing the overall performance of
HEIs (Julianti et al., 2021; Meçe et al., 2020;
Vallurupalli & Bose, 2018). Business Intelligence
(BI) has emerged as a critical strategic tool that
enables the collection, analysis, and retrieval of data
to support informed decision-making and meet
current performance management needs in higher
a
https://orcid.org/0000-0002-9733-1097
b
https://orcid.org/0000-0002-9818-7090
c
https://orcid.org/0000-0001-8434-4887
d
https://orcid.org/0000-0002-0100-8691
education (Manuel Mora et al., 2017; Sorour et al.,
2020; Yahaya et al., 2019).
The implementation of BI systems in HEIs,
however, presents numerous challenges. These
include integrating BI systems with existing IT
infrastructures, ensuring data quality and consistency,
meeting the diverse needs of various stakeholders,
and fostering a data-driven culture within the
institution (Barbosa et al., 2022; Carvalho et al.,
2022; Khashab et al., 2020). Additionally, differences
in institutional structures, regulatory environments,
and available resources can significantly affect the
implementation process (Park et al., 2020; Pikas et
al., 2020). Therefore, it is essential to develop and
validate a roadmap tailored to the unique context of
each institution to effectively guide the
implementation of BI systems in HEIs.
This study aims to develop and validate a new
roadmap for implementing BI systems within a
specific HEI. Contrary to the impression that a
roadmap already exists and is ready for
44
Sequeira, R., Reis, A., Branco, F. and Alves, P.
Roadmap for Implementing Business Intelligence Systems in Higher Education Institutions: Validation of a Case Study at the University of Trás-os-Montes and Alto Douro.
DOI: 10.5220/0012834900003764
Paper published under CC license (CC BY-NC-ND 4.0)
In Proceedings of the 21st International Conference on Smar t Business Technologies (ICSBT 2024), pages 44-55
ISBN: 978-989-758-710-8; ISSN: 2184-772X
Proceedings Copyright © 2024 by SCITEPRESS – Science and Technology Publications, Lda.

implementation, this research focuses on the creation
and validation of a new roadmap. The proposed
roadmap acts as a visual and sequential guide
designed to adapt to the varying needs and
characteristics of HEIs, thereby facilitating the
effective implementation of BI solutions tailored to
the specific institutional context (Rauschenberger &
Baeza-Yates, 2021; Su et al., 2020).
The core of this research involved validating the
proposed roadmap through a case study conducted at
the University of Trás-os-Montes and Alto Douro
(UTAD). The methodology adopted included semi-
structured interviews with experts from the institution
and user group evaluations of dashboards to ensure
the roadmap's applicability and effectiveness in a
real-world context. This iterative validation process
highlights the importance of refining and adapting the
roadmap based on direct feedback from users and
stakeholders, ensuring its practical relevance and
usability (Doyle et al., 2016; Fernández-Cejas et al.,
2022).
A critical aspect of this validation was the
assessment of the dashboards by user groups, which
ensured that the dashboards were designed with the
needs of end users in mind. This process involved
evaluating the usability and relevance of the metrics
presented, identifying and resolving any usability
issues, and ensuring that the dashboards align with the
institution's strategic goals. This user-centric
approach underscores the need for continuous
feedback and adjustment post-implementation,
emphasizing that the implementation of BI solutions
in higher education requires a dynamic and adaptive
methodology (Apiola & Sutinen, 2021; Su et al.,
2020).
In summary, this study not only aims to validate a
pre-existing roadmap but also to develop and refine a
roadmap that is adaptable to the diverse and complex
environments of HEIs. By addressing the unique
challenges faced by HEIs in implementing BI
systems, this study seeks to provide a comprehensive
guide that supports informed decision-making and
enhances strategic management across various
educational contexts.
This work builds upon previous research by
Sequeira et al. (2023), which initially proposed a
methodology for developing a BI integration
roadmap for HEIs. The primary aim of this study is to
extend that research by focusing on the practical
implementation and validation of a BI solution at the
UTAD, thereby offering a refined and validated
roadmap that other HEIs can adopt and adapt.
The structure of this paper is as follows: we begin
with an introduction that defines the research problem
and highlights the importance and objectives of the
study. This is followed by a detailed description of the
research methodology. We then discuss the validation
of the roadmap, from the theoretical basis to the
practical validation process, including the important
stage of user group evaluation of the dashboards. The
article ends with final reflections on the work and
suggestions for future research, culminating with
acknowledgements and a list of references that
support the study.
2 RESEARCH METHODOLOGY
ADOPTED
The scientific field of BI pertains to computer
science, specifically within IT. Research
methodology in Information Systems (IS) adheres to
a structured approach defining the procedures and
steps for conducting scientific research. Ragab and
Arisha (2017) emphasize that selecting an appropriate
research methodology is crucial for successful
research, and researchers must understand alternative
methods to identify the most suitable for their
research question. Pruzan (2016) discusses the
scientific method in detail, highlighting experimental
design, validation, uncertainty, and statistics,
emphasizing the importance of reflecting on the
deeper goals of scientific work. Ioannidis (2018)
argues that studying research itself is crucial for
improving the efficiency and credibility of scientific
work.
Research methodology can be defined as a
systematic approach to solving research problems
that produce credible and useful results. Researchers
need to consider their approach carefully to ensure the
validity and reliability of their conclusions. Kilani
and Kobziev (2016) reinforce the importance of
defining an appropriate research methodology,
considering both qualitative and quantitative
approaches and the use of case studies in IS research.
In this study, we adopted a methodological
approach comprising three main components: case
study, Design Science Research (DSR), and focus
groups. This mixed-methods approach was selected
to ensure a comprehensive analysis and validation of
the proposed roadmap for BI system implementation
in HEIs.
The case study was selected as the primary
research method due to its ability to provide an in-
depth and contextualized understanding of the
phenomenon under study. It involves a detailed
analysis of a specific individual, group, organization,
Roadmap for Implementing Business Intelligence Systems in Higher Education Institutions: Validation of a Case Study at the University of
Trás-os-Montes and Alto Douro
45

event, or phenomenon within its real-life context,
collecting detailed qualitative data (Sutherland, 2016;
Turnbull et al., 2021). The case study method is
widely used in DSR (Su et al., 2020), which we
employed to develop our roadmap. The use of a case
study, particularly in an HEI, allows for exploring
specific phenomena in a particular context, offering
versatile application forms depending on the research
focus and objectives (Barbosa et al., 2022; Carvalho
et al., 2022; Khashab et al., 2020; Park et al., 2020;
Pikas et al., 2020; Rauschenberger & Baeza-Yates,
2021; Su et al., 2020). However, we acknowledge that
case study results are not directly generalizable to
other HEIs, requiring consideration of each
institution's specificities.
The DSR methodology was employed to develop
and validate the BI system implementation roadmap.
Specifically, we adopted the Peffers et al. (2007),
approach, which consists of six steps: problem
identification, objective definition for the solution,
design and development, demonstration, evaluation,
and communication. This systematic approach
enabled us to create a structured model that serves as
a visual and sequential guide for the effective
implementation of BI solutions in HEIs. The utility of
DSR in this study lies in its ability to create an artefact
(the roadmap) that is iteratively validated based on
feedback from users and experts, ensuring its
relevance and practical effectiveness (Apiola &
Sutinen, 2021; Barbosa et al., 2022; Doyle et al.,
2016; Fernández-Cejas et al., 2022; Su et al., 2020).
Focus groups were used to identify key
performance indicators (KPIs) to be systematized in
the dashboards. The ability of focus groups to create
a space for participants to share perspectives and
narratives collectively was particularly effective in
gaining detailed insights in a short time
(Gundumogula, 2020). Plummer (2017) highlights
the usefulness of focus groups for exploring
individuals' opinions, ideas, attitudes, and
experiences on specific topics, recognizing their
ability to reveal complexity and nuance. This
approach was complemented by semi-structured
interviews, which served as a data collection tool to
validate the applicability and effectiveness of the
developed roadmap and dashboards. Khan et al.
(2020) recommend using interviews in design science
and action research to develop and test solutions to
practical problems.
Interviews are a qualitative data collection method
that can be used to demonstrate the applicability and
validity of an artefact in practice. When it comes to
validating an artefact such as a system, process,
method, or solution, interviews can play a crucial role
by allowing researchers to obtain direct and in-depth
information about the artefact's perception, use, and
impact on real activities (Islind & Lundh Snis, 2017;
Kutay & Oner, 2022; Kyza et al., 2022; Sanni-Anibire
et al., 2021; Viberg et al., 2018). Interviews allow
interaction with relevant actors or experts to gather
information, opinions, and feedback about the
artefact. The specific purposes and outcomes of
interviews may vary depending on the context and
objectives of the research (Fernández-Cejas et al.,
2022; Kayanda et al., 2023; Yildiz et al., 2021).
It is also common to use a questionnaire as a guide
during an interview to carry out the validation of an
artefact or solution. The use of a structured
questionnaire can help guide the interview and ensure
that specific and relevant information is obtained
from participants while keeping the process
organized and focused on the validation objectives
(Baba et al., 2021; Pfeiffer et al., 2018). Thus, using
an interview questionnaire as a roadmap for
conducting validation offers several advantages that
can significantly contribute to the data collection
process and the quality of the results obtained.
The actors interviewed were selected based on
their expertise and involvement in the BI
implementation process, including IT staff,
management, and end-users. A purposive sampling
method ensured participants had relevant experience,
with the sample size determined by data saturation,
ensuring comprehensive coverage of the necessary
insights.
Data were collected through semi-structured
interviews and focus groups, guided by a structured
questionnaire. These methods were chosen for their
flexibility and ability to capture detailed, context-
specific information, facilitating the identification of
KPIs. The focus groups allowed for the collection of
diverse perspectives, while the interviews ensured
consistency across sessions.
The collected data were analysed using thematic
analysis, which involved coding the data to identify
patterns and themes related to the implementation and
validation of the BI system. This method provided a
comprehensive understanding of the challenges and
successes experienced during the BI implementation
process, highlighting areas for improvement.
In summary, this study employed a research
methodology that combines the strengths of case
study research, DSR, and qualitative data collection
methods to develop and validate a roadmap for BI
system implementation in HEIs. The careful selection
of the actors, structured data collection, and rigorous
data analysis ensured the findings' reliability and
ICSBT 2024 - 21st International Conference on Smart Business Technologies
46

validity, offering insights for future BI
implementations in similar contexts.
3 VALIDATION OF THE
ROADMAP
Validating a roadmap is the process of evaluating and
verifying the effectiveness, feasibility and accuracy
of a roadmap. This process covers the assessment of
that roadmap against the specific criteria or objectives
defined, to ensure its reliability and suitability to
guide decision-making and achieve the desired results
(Castro et al., 2022; Jalundhwala & Londhe, 2023;
Kerr & Phaal, 2022; Ozcan et al., 2022). It is
important to note that the validation process can vary
depending on the specific context and objectives of a
roadmap (Ekenna et al., 2016; Jalundhwala &
Londhe, 2023; Juaristi et al., 2020; Mitchell & Clark,
2019; Sareminia et al., 2019).
Validation of a roadmap therefore involves
careful analysis and review of the proposed plan to
ensure that it is realistic, achievable and in line with
HEI objectives and resources. A roadmap is a
strategic guide that describes the key milestones,
objectives and actions required to achieve a particular
goal or project. Validation of the roadmap is a critical
step in ensuring that the plan is viable and that efforts
are directed effectively. Validation of a roadmap is
essential to avoid problems, optimise resource
allocation and increase the likelihood of success in
achieving the outlined objectives, ensuring that the
roadmap is an effective tool for guiding the planning,
execution and monitoring of strategic initiatives. On
the other hand, validating a roadmap involves a
systematic approach that includes careful analysis of
the elements of the plan, as well as obtaining
feedback and validation from stakeholders.
Expert validation of a roadmap consists of
obtaining information, analysis and opinions from
highly qualified and experienced professionals in
areas relevant to the plan in question. These experts
have technical, strategic or specific domain
knowledge that can enrich the assessment and
improvement of the roadmap. Expert validation thus
helps to ensure that the plan is well-supported,
realistic and in line with best practices and trends
(Chofreh A. G. et al., 2016; Münch et al., 2019).
3.1 Validation Process
To carry out the validation of a roadmap, to verify that
it meets the proposed requirements and contributes to
solving the specified problem, it is important to
follow a structured and focused approach. The steps
required to validate the roadmap with experts, taking
into account these objectives, could be as follows:
1) Expert selection: Identify and involve subject
matter experts or stakeholders with relevant
knowledge and experience in the area covered by
the roadmap (Claessens et al., 2022; Zuo et al.,
2022).
2) Expert review: Share the roadmap with the
selected experts and ask for their comments,
opinions and recommendations on the content,
structure, feasibility and alignment of the
roadmap with the intended goals (Claessens et al.,
2022; Rust et al., 2016; Zuo et al., 2022).
3) Expert evaluation criteria: Define evaluation
criteria or guidelines to assess the validity,
effectiveness and potential for success of the
roadmap. These criteria may include factors such
as clarity, completeness, relevance, feasibility,
and alignment with industry standards or best
practices (Juaristi et al., 2020).
4) Gather feedback: Conduct interviews, surveys or
workshops with experts to gather their comments,
opinions and suggestions on the roadmap. This
may include structured questionnaires, open
discussions or specific evaluation forms
(Baranowski & Damaziak, 2021; Ekenna et al.,
2016).
5) Iterative refinement: Incorporating the feedback
and recommendations provided by the experts
into the roadmap, making the necessary
adjustments, revisions or additions to improve its
quality, accuracy and usability (Damasco et al.,
2020; Ozcan et al., 2022).
6) Consensus building: Facilitating discussions and
collaborative sessions between experts to reach
consensus on the validity, feasibility and potential
impact of the roadmap. This may involve
resolving conflicting opinions, addressing
concerns and refining the roadmap based on
collective expertise (Horry et al., 2022).
7) Documentation and reporting: Document the
feedback received from experts and any changes
made to the roadmap based on their input. This
documentation serves as evidence of the
validation process and provides transparency and
accountability (Horry et al., 2022; Ozcan et al.,
2022).
The development of a questionnaire as a roadmap for
carrying out validation, based on previous studies and
in particular the recommendations of Apandi and
Arshah (2016), involves the creation of structured and
relevant questions that address the main aspects of
Roadmap for Implementing Business Intelligence Systems in Higher Education Institutions: Validation of a Case Study at the University of
Trás-os-Montes and Alto Douro
47
validation. The steps required to develop a
questionnaire based on these references could be as
follows:
1) Define the validation objectives: Before creating
the questionnaire, clearly define the validation
objectives. For example, if the authors highlight
the importance of usability and perceived
benefits, it is important to define your objectives
for assessing these aspects;
2) Identify key topics: Based on the references and
validation objectives, identify the key topics you
want to address in the questionnaire. For example,
you could include topics such as usability,
effectiveness, efficiency, benefits and suggestions
for improvement;
3) Create structured questions: develop specific
questions for each of the identified themes. Check
that the questions are clear and address relevant
aspects of the validation;
4) Organise an interview script: Organise the
questions in a logical sequence to create an
interview script. Start with introductory questions,
such as information about the participant's profile,
and follow with questions about the key issues;
5) Introduce the questionnaire in the interview:
During the interview, explain the purpose of the
questionnaire and how it will be used as a guide
to conduct the artefact validation discussion;
6) Conduct the interview: Follow the interview
script by asking the questions in the questionnaire
and allowing the participants to respond. Use the
answers as a basis for further discussion;
7) Adapt and explore information: Be open to
exploring additional information that may arise
during the interview, beyond the questions in the
questionnaire. This can enrich the validation;
8) Record responses: Record participants' responses
accurately and in detail, noting both direct
responses and additional information shared;
9) Analyse the data: After the interviews, analyse the
responses to the questionnaire and the additional
information gathered. Look for patterns and
trends;
10) Describe the results: Use the questionnaire
responses and information gathered to describe
the results of the validation, comparing them with
the recommendations of the references and
highlighting points of agreement and
disagreement.
3.2 Validation of Dashboards with User
Groups
The implemented roadmap presented a set of decision
support dashboards based on the processes, decision
points and stakeholders identified in the HEI. The
dashboards provide advanced functionality that
allows users to access automated results and instant
visualisations that meet the identified information
needs. These tools can present real-time updates,
analyses of historical trends and graphical
representations of KPIs, improving the ease of
interpretation and analysis (Calitz et al., 2018;
Scholtz et al., 2018).
The KPIs to be systematised in the dashboards
were identified through a focus group involving
various stakeholders, including representatives of the
rector's office and various UTAD departments and
services. Table 1 shows these KPIs, numbered
according to their relevance and the regularity with
which they are consulted, and categorised according
to the following areas of UTAD activity: a) Research
Projects (RP); b) Technology Transfer (TT); c)
Teaching and Quality (TQ); and d) Pedagogical
Innovation (PI), with the matrix variable (MV)
denoted by "MV".
Table 1: KPIs identified at the UTAD.
MV KPI
RP 1
N
umber of researchers
RP 2
Number of scientific outputs in the
Scopus database
RP 3 Financial - Revenue obtaine
d
RP 4
N
umber of funded pro
j
ects
RP 5
N
umber of research units
RP 6
N
umber of
g
rant holders
RP 7
Funding received for projects by total
revenue
TT 1
N
umber of patents
TT 2
N
umber of spinoffs
TT 3
Provision of services - Financial
Revenue
TT 4
Number of partnerships and projects to
p
romote innovation
TT 5 The number of entrepreneurs supporte
d
TQ 1
N
umber of students
TQ 2
Number of programmes with
accreditation capacit
y
TQ 3 Percenta
g
e of
g
raduates
TQ 4 School success - Pass rate
TQ 5
Number of master's and doctoral theses
completed (2nd and 3rd c
y
cle onl
y
)
TQ 6
N
umber of de
g
ree pro
g
rammes
ICSBT 2024 - 21st International Conference on Smart Business Technologies
48
Table 1: KPIs identified at the UTAD (cont.).
MV KPI
TQ 7
N
umber of mobilit
y
pro
g
rammes
TQ 8 Emplo
y
abilit
y
rate
TQ 9 Dropout rate - Re-enrolment rate
TQ 10
N
umber of sub
j
ects
TQ 11 Student satisfaction with teachin
g
staff
TQ 12
N
umber of candidates
TQ 13
N
umber of professors
PI 1
Programme price/student ratio by
number of students
PI 2
N
umber of non-de
g
ree
p
ro
g
rammes
Table 2 and Table 3 show the KPIs that make up
the main dashboard, taking into account the
characteristics of its size.
Table 2 describes the KPIs with annual/semi-
annual operation, with the MV identified by "MVA".
Table 2: List of KPIs that make up the UTAD main
dashboard - Annual/semi-annual operation.
MV KPI Relevance
MVA 1 TQ 1
Total number
Number per cycle
Percentage of international
students per c
y
cle
MVA 2 TQ 3
Total percentage
Percenta
g
e of women
MVA 3 TQ 5
Total number
Number per cycle (2nd and
3rd c
y
cles onl
y
)
MVA 4 TQ 8 Total percenta
g
e
MVA 5 TQ 9
Total percentage of students
who drop ou
t
MVA 6 PI 2
Total number
Number by typology -
Postgraduate and other non-
degree programmes
Total number of students in
non-de
g
ree
p
ro
g
rammes
MVA 7 RP 1
Total number
Percenta
g
e of women
MVA 8 RP 4
Total number
Total amount financed for
p
ro
j
ects
MVA 9 RP 7 Total
p
ercenta
g
e
MVA 10 TT 3
Invoiced value of services
rendered
Contracted value of services
rendere
d
Table 3 describes the KPIs with the monthly
operation, with the MV identified by "MVM".
Table 3: List of KPIs that make up the UTAD main
dashboard - Monthly operation.
MV KPI Relevance
MVM 1 RP 2
Total number
Number by typology
N
umber b
y
quartile
MVM 2 RP 3
Total value of research
income
MVM 3 RP 6
Total number
Percentage of women
Percentage of internationals
Number by type of grant
holder (research initiation
grant holders, research grant
holders and post-doctoral
g
rant holders)
MVM 4 RP 7 Total percenta
g
e
MVM 5 TT 1
Total number
Number by state (submitted,
granted and active)
Number per national or
international
MVM 6 TT 3
Invoiced value of services
rendered
Contracted value of services
rendere
d
MVM 7 TT 5
Total number
Total number of companies
Total number of jobs in
incubators
Total number of projects
supporte
d
In terms of relevance, the following
classifications have been taken into account:
• Highly relevant: Key indicators that have a direct
impact on strategic decisions and reflect the
overall performance of the IES;
• Relevant: Indicators that are fundamental to the
management of some specific areas and can
influence decisions on a more frequent basis;
• Substantially relevant: Indicators that provide
useful information but are not critical for
decision-making;
• Not very relevant: Indicators that provide
secondary information, i.e. that rarely influence
major decisions or strategies.
Concerning the periodicity of monitoring, the
following classifications have been taken into
account:
• Monthly: Indicators that require frequent review
and analysis due to their direct impact on
operations or short-term decisions;
Roadmap for Implementing Business Intelligence Systems in Higher Education Institutions: Validation of a Case Study at the University of
Trás-os-Montes and Alto Douro
49

• Half-yearly: Indicators that can be monitored in
the medium term, often in line with academic
cycles;
• Annual: Indicators that show long-term trends and
performance and are generally aligned with the
financial calendar or academic year.
Validating dashboards with user groups is a critical
step in ensuring that the BI solution meets the needs
of its users and provides relevant, actionable
information. By involving users in the validation
process, HEIs can ensure that dashboards meet the
specific needs of their users, improve usability, and
enable decision-making based on accurate and
relevant information (Laurent et al., 2021; McCoy &
Rosenbaum, 2019; Roberts et al., 2017; Schall et al.,
2017; Weggelaar-Jansen et al., 2018).
Validation ensures that a dashboard is designed
with the end user in mind. By involving users directly
in the validation process, the tools developed are
more likely to be intuitive and effective for their
purposes. Even with careful design, usability issues
can arise that only become apparent when a
dashboard is tested in real-life situations. Validation
helps to identify and correct these problems.
Validation can reveal whether the metrics and data
presented are important and useful to a target
audience.
A well-validated dashboard allows users to
quickly get the information they need to make
effective and informed decisions. In addition,
tweaking a dashboard after launch can be costly in
terms of time and resources. Early validation can
avoid unnecessary work and ensure that the final
product meets users' needs. If a dashboard meets
users' needs and is easy to use, it is more likely to be
widely adopted and used regularly.
Users can provide valuable information about
additional features or customisations that can further
enhance a dashboard. User validation helps build trust
in the system. When users see that their opinions are
valued and taken into account, they are more likely to
trust and adopt the tool. Validation can also reveal
gaps in users' digital literacy, indicating the need for
additional training or support. By involving multiple
user groups in validation, HEIs can ensure
consistency in the presentation and interpretation of
data, so that all users understand the metrics in the
same way.
In short, validating dashboards with user groups is
a critical step in ensuring that data visualisation tools
are not only technically correct but also truly useful
and relevant to those who rely on them to make
informed decisions.
In turn, identifying the user groups in each context
is a critical step in ensuring that dashboards are well-
constructed and truly useful for decision-making.
Each group uses information differently, depending
on their responsibilities and objectives. Validating
dashboards with specific groups can highlight the
need to personalise the presentation of information,
making it more relevant and easier to understand for
each group. By interacting with specific user groups,
it's possible to determine which data is most relevant,
ensuring that a dashboard displays information that's
important to that group's decision-making. Feedback
from different groups can also provide information
about the usability of the dashboard in specific
contexts, leading to improvements in design and
navigation. When a dashboard is designed with the
contextual needs of a group in mind, that group is
more likely to adopt the tool and use it regularly.
Taking into account the case study of a HEI, the
approach chosen for the validation of this work
consisted of a series of semi-structured interviews
divided into three sections: i) Presentation of the
research and demonstration of the dashboards; ii)
Testing of the dashboards by the experts; iii) Answers
from the experts. These three phases made it possible
to obtain information on their applicability and
effectiveness. A more detailed explanation of each
phase is given below.
Phase 1 was structured to ensure a thorough
understanding and effective engagement of the
experts involved. This process began with a detailed
introduction to the research, which clarified the
overall objective of the study and contextualised the
importance of BI dashboards in the HE environment
and their potential impact on decision-making. The
specific objectives of the validation were then
defined, providing a clear understanding of the goals
to be achieved.
The dashboards that had been developed were
then presented, providing an overview of the BI tools
that had been created, the types of information they
presented and how the data was visualised. This stage
included a detailed explanation of the main elements
of the dashboards, such as graphs, tables and
interactive filters, highlighting their relevant features.
This was followed by a hands-on demonstration
of the dashboards, navigating through the different
functionalities in real-time and demonstrating how
users can interact with the components and explore
the data available. This demonstration illustrated the
user's ability to filter information, access specific
details and understand the trends and insights
provided by the dashboards.
ICSBT 2024 - 21st International Conference on Smart Business Technologies
50
Finally, the key functionalities implemented in the
dashboards to enrich the user experience and support
informed decision-making were addressed. During
this process, the experts were allowed to clarify any
doubts and provide answers to the questions raised,
ensuring a full understanding of the research and the
dashboards developed.
In phase 2, the experts had the opportunity to
interact directly with the dashboards developed,
mimicking the experience of real end users. This
phase started by giving the experts access to the
dashboards in a realistic environment, allowing them
to explore them independently. This encouraged
active interaction with the dashboards by applying
filters, selecting different parameters and
experimenting with interactive features such as
drilling down into graphs or tables.
During this testing phase, the experts were
encouraged to record their observations and identify
any problems or opportunities for improvement. This
included aspects relating to usability, clarity of
information presented, ease of navigation and system
response time. Feedback was requested in real-time,
with opinions and experiences shared as participants
explored the dashboards, to capture the most
immediate and authentic impressions.
The experts were given sufficient time to explore
the dashboards extensively, ensuring that they had the
opportunity to properly evaluate the tools. After this
period of independent exploration, the test was
completed and the next stage of validation was
carried out, which involved answering a series of
structured questions. This approach made it possible
to assess not only the usability and effectiveness of
the dashboards but also the relevance of the
information presented, providing valuable feedback
to improve the BI solutions being developed.
The third and final phase of validation centred on
collecting the experts' answers to a set of predefined
questions. This stage began with a presentation of the
questionnaire to the experts, clarifying the purpose of
the questions and the importance of the answers for
validating the study. It was ensured that the experts
understood the value of their contributions to the
research.
The questionnaire consisted of a series of
structured questions designed to assess various
aspects of dashboards, including usability,
effectiveness, perceived benefits, challenges faced
and possible improvements. Experts were encouraged
to provide detailed answers, motivating them to freely
share their opinions and experiences related to the use
of dashboards.
During the response process, additional
discussions took place, allowing certain issues to be
explored in more depth and new information to
emerge from the conversations. All responses were
carefully recorded, both through written notes and
audio recordings, to ensure the accuracy and integrity
of the data collected.
Where necessary, the experts' doubts about the
questions posed were clarified to ensure full
understanding and informed responses. At the end of
the question and answer session, the experts were
thanked for their valuable participation and asked for
any final comments or additional observations, thus
concluding the final phase of the Dashboard
validation interview. This stage was essential in
gaining in-depth insight into the users' experience of
the dashboards and was instrumental in validating and
improving the proposed BI solution.
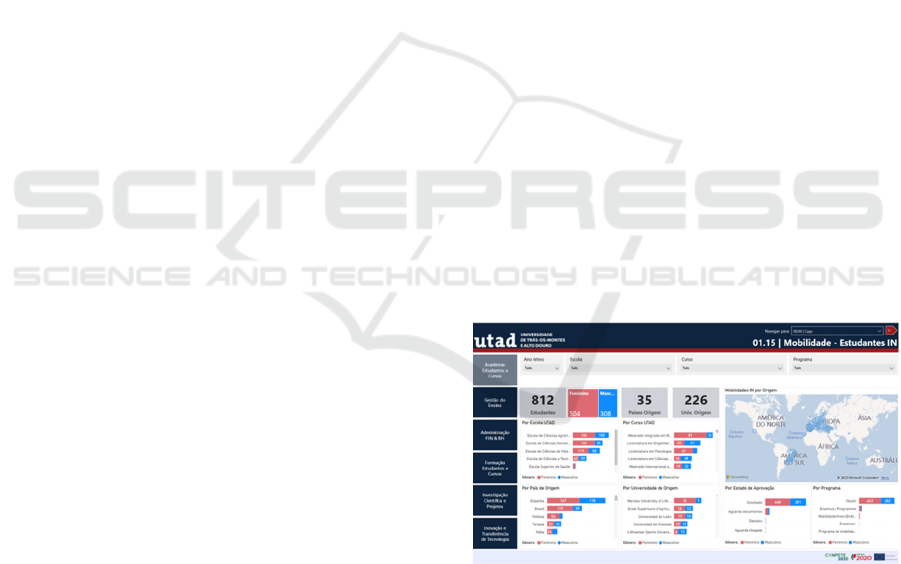
3.3 Changes Made
Following the interviews carried out during the
validation process, it was necessary to make several
changes to the presentation of the dashboards,
although these were not very significant. It was also
necessary to make some changes to the definition of
the KPIs, both in terms of the calculation algorithm
and their presentation. These changes were important
to improve the effectiveness and efficiency of the
dashboards in question.
Figure 1 shows an example of the HEI BI system
after these corrections:
Figure 1: UTAD BI system.
3.4 Applicability and Reproducibility
One of the key issues raised during the review was the
applicability and replicability of the proposed
roadmap in different HEIs contexts, taking into
account the diversity of processes between HEIs on
different continents and between public and private
institutions with different profiles.
Roadmap for Implementing Business Intelligence Systems in Higher Education Institutions: Validation of a Case Study at the University of
Trás-os-Montes and Alto Douro
51

The roadmap presented in this study has been
designed to be flexible and adaptable to a wide range
of educational contexts. During the validation
process, it was observed that, despite the specific
differences of each institution, there are common
elements that allow the roadmap to be adapted to
different realities.
In particular, the selection of KPIs has been made
to include metrics that are broadly relevant to
management and strategic performance in different
HEIs. However, we recognise that the diversity of
administrative and pedagogical processes between
HEIs on different continents, and between public and
private institutions, may require specific adjustments
to the proposed roadmap.
To address this diversity, the study suggests that
dashboards and KPIs should be tailored to the specific
needs and characteristics of each institution. This
includes taking into account cultural, regulatory and
operational factors that may influence the
implementation and use of BI systems in different
HEIs contexts.
In addition, the validation methodology used,
including direct interaction with end users and
experts, proved effective in identifying and resolving
usability issues and adapting dashboard functionality
to meet the specific needs of users. This iterative
process of validation and adaptation is key to
ensuring that the BI system is truly useful and
applicable in a variety of scenarios.
Thus, although the roadmap has been validated in
a specific case study, we believe that its structure and
approach can be adapted to other types of students
and HEIs contexts, with appropriate modifications to
reflect the particularities of each institution.
4 CONCLUSIONS AND FUTURE
WORK
This study provides a analysis of how an HEI can
effectively validate the implementation of a BI
system, serving as a practical guide for institutions
aiming to enhance strategic management and
performance monitoring through data analysis. The
methodology involved reviewing the current state of
knowledge, consulting a panel of carefully selected
experts, and crucially, applying a case study at the
UTAD. This process validated the relevance and
effectiveness of the proposed roadmap and
demonstrated its practicality in HEIs, illustrating how
theoretical strategies can be translated into practical
applications within the higher education context.
The implementation of this roadmap in a specific
HEI proved to be a fundamental step in the effective
implementation of BI systems, emphasising the need
for the active and ongoing involvement of all
stakeholders. This interaction ensures that the
roadmap remains relevant and up to date with the
evolving challenges of higher education. The case
study provided important insights into the practical
implementation of BI systems, highlighting the
crucial role of the roadmap as a facilitator of
evidence-based decision-making and the need for
regular updates to respond to new trends and
challenges.
A key aspect of this research was validating
dashboards with user groups to ensure these tools met
the specific needs of end users, enhanced usability,
and effectively supported informed decision-making
processes. Direct interaction with users underscored
the importance of post-implementation adjustments
and the need for additional support or training,
reinforcing the iterative and adaptive nature
necessary when implementing BI solutions in higher
education.
This study emphasises the importance of careful
selection of experts and detailed analysis of the
feedback gathered to ensure that the roadmap not only
meets the immediate needs of the HEIs but also has
the flexibility to adapt to future requirements. The use
of semi-structured interviews proved to be a valuable
resource for gaining in-depth insight into the
functionality and effectiveness of the proposed BI
system, allowing fine-tuning to better align the
system with user needs.
In summary, this study lays the foundations for
future research and practice in the area of BI in higher
education and presents a guide to the validation and
implementation of BI systems in higher education. By
highlighting the key steps for effective validation and
the importance of continuous stakeholder
engagement and roadmap updating, this research
provides an adaptable model that can be applied in a
variety of educational contexts to optimise strategic
decision-making and organisational performance.
For future research, we suggest analysing the
roadmap's applicability in a wider range of
educational contexts, covering HEIs with different
characteristics, sizes and capacities. This
methodological expansion could significantly enrich
the understanding of the roadmap's adaptability to
different institutional realities. In addition,
conducting comparative studies between various
HEIs that have implemented the roadmap would
provide detailed insight into effective practices and
common challenges, fostering a richer understanding
ICSBT 2024 - 21st International Conference on Smart Business Technologies
52

of the dynamics that influence the successful
implementation of BI systems in HEIs.
ACKNOWLEDGEMENTS
This work is financed by National Funds through the
Portuguese funding agency, FCT - Fundação para a
Ciência e a Tecnologia, within project
LA/P/0063/2020. The authors acknowledge the work
facilities and equipment provided by CeDRI
(UIDB/05757/2020 and UIDP/05757/2020) to the
project team.
REFERENCES
Apandi, S. H., & Arshah, R. A. (2016). Validation of a
proposed dashboard model for researchers in social
research network sites. Journal of Theoretical and
Applied Information Technology, 89(2), 409–421.
http://www.jatit.org/volumes/Vol89No2/14Vol89No2.
pdf
Apiola, M., & Sutinen, E. (2021). Design science research
for learning software engineering and computational
thinking: Four cases. Computer Applications in
Engineering Education, 29(1), 83–101. https://doi.org/
10.1002/cae.22291
Baba, A., Saha, A., McCradden, M. D., Boparai, K., Zhang,
S., Pirouzmand, F., Edelstein, K., Zadeh, G., &
Cusimano, M. D. (2021). Development and validation
of a patient-centered, meningioma-specific quality-of-
life questionnaire. Journal of Neurosurgery, 135(6),
1685–1694. https://doi.org/10.3171/
2020.11.JNS201761
Baranowski, P., & Damaziak, K. (2021). Numerical
simulation of vehicle–lighting pole crash tests:
parametric study of factors influencing predicted
occupant safety levels. Materials, 14(11), 2822. https://
doi.org/10.3390/ma14112822
Barbosa, A. F. G., Campilho, R. D. S. G., Silva, F. J. G.,
Sánchez-Arce, I. J., Prakash, C., & Buddhi, D. (2022).
Design of a spiral double-cutting machine for an
automotive bowden cable assembly line. Machines,
10(9), 811. https://doi.org/10.3390/machines10090811
Calitz, A., Bosire, S., & Cullen, M. (2018). The role of
business intelligence in sustainability reporting for
South African higher education institutions.
International Journal of Sustainability in Higher
Education, 19(7), 1185–1203. https://doi.org/10.1108/
IJSHE-10-2016-0186
Carvalho, L. P., Cappelli, C., & Santoro, F. M. (2022).
BPMN pra GERAL: A framework to translate BPMN to
a citizen language. Business Process Management
Journal, 28(2), 508–531. https://doi.org/10.1108/
BPMJ-04-2020-0150
Castro, B. M., Reis, M. D. M., & Salles, R. M. (2022).
Multi-agent simulation model updating and forecasting
for the evaluation of COVID-19 transmission. Scientific
Reports, 12(1), 22091. https://doi.org/10.1038/s41598-
022-22945-z
Chofreh A. G., Goni F. A., & Klemes J. J. (2016). A master
plan for the implementation of sustainable enterprise
resource planning systems (part iii): Evaluation of a
roadmap. Chemical Engineering Transactions, 52,
1105–1110. https://doi.org/10.3303/CET1652185
Claessens, F., Seys, D., Brouwers, J., Van Wilder, A., Jans,
A., Castro, E. M., Bruyneel, L., De Ridder, D., &
Vanhaecht, K. (2022). A co-creation roadmap towards
sustainable quality of care: A multi-method study.
PLOS ONE, 17(6), e0269364. https://doi.org/10.1371/
journal.pone.0269364
Damasco, J. A., Ravi, S., Perez, J. D., Hagaman, D. E., &
Melancon, M. P. (2020). Understanding nanoparticle
toxicity to direct a safe-by-design approach in cancer
nanomedicine. Nanomaterials, 10(11), 2186. https://
doi.org/10.3390/nano10112186
Doyle, C., Sammon, D., & Neville, K. (2016). A design
science research (DSR) case study: Building an
evaluation framework for social media enabled
collaborative learning environments (SMECLEs).
Journal of Decision Systems, 25(sup1), 125–144.
https://doi.org/10.1080/12460125.2016.1187411
Ekenna, C., Thomas, S., & Amato, N. M. (2016). Adaptive
local learning in sampling based motion planning for
protein folding. BMC Systems Biology, 10(S2), 49.
https://doi.org/10.1186/s12918-016-0297-9
Fernández-Cejas, M., Pérez-González, C. J., Roda-García,
J. L., & Colebrook, M. (2022). CURIE: Towards an
ontology and enterprise architecture of a CRM
conceptual model. Business & Information Systems
Engineering, 64(5), 615–643. https://doi.org/10.1007/
s12599-022-00744-0
Gundumogula, M. (2020). Importance of focus groups in
qualitative research. The International Journal of
Humanities & Social Studies, 8(11).
https://doi.org/10.24940/theijhss/2020/v8/i11/HS2011-
082
Horry, R., Booth, C. A., Mahamadu, A., Manu, P., &
Georgakis, P. (2022). Environmental management
systems in the architectural, engineering and
construction sectors: A roadmap to aid the delivery of
the sustainable development goals. Environment,
Development and Sustainability, 24(9), 10585–10615.
https://doi.org/10.1007/s10668-021-01874-3
Ioannidis, J. P. A. (2018). Meta-research: Why research on
research matters. PLOS Biology, 16(3), e2005468.
https://doi.org/10.1371/journal.pbio.2005468
Islind, A. S., & Lundh Snis, U. (2017). Learning in home
care: A digital artifact as a designated boundary object-
in-use. Journal of Workplace Learning, 29(7/8), 577–
587. https://doi.org/10.1108/JWL-04-2016-0027
Jalundhwala, F., & Londhe, V. (2023). A systematic review
on implementing operational excellence as a strategy to
ensure regulatory compliance: A roadmap for Indian
pharmaceutical industry. International Journal of Lean
Roadmap for Implementing Business Intelligence Systems in Higher Education Institutions: Validation of a Case Study at the University of
Trás-os-Montes and Alto Douro
53

Six Sigma, 14(4), 730–758. https://doi.org/10.1108/
IJLSS-04-2022-0078
Juaristi, M., Konstantinou, T., Gómez-Acebo, T., &
Monge-Barrio, A. (2020). Development and validation
of a roadmap to assist the performance-based early-
stage design process of adaptive opaque facades.
Sustainability, 12(23), 10118. https://doi.org/10.3390/
su122310118
Julianti, M. R., Gaol, F. L., Ranti, B., & Supangkat, S. H.
(2021). IT governance framework for academic
information system at higher education institutions: a
systematic literature review. 2021 International
Conference on ICT for Smart Society (ICISS), 1–6.
https://doi.org/10.1109/ICISS53185.2021.9533213
Kayanda, A., Busagala, L., Oyelere, S., & Tedre, M.
(2023). The use of design science and agile
methodologies for improved information systems in the
Tanzanian higher education context. The Electronic
Journal of Information Systems in Developing
Countries, 89(1), e12241. https://doi.org/10.1002/
isd2.12241
Kerr, C., & Phaal, R. (2022). Roadmapping and Roadmaps:
Definition and underpinning concepts. IEEE
Transactions on Engineering Management, 69(1), 6–
16. https://doi.org/10.1109/TEM.2021.3096012
Khan, I. U., Idris, M., & Khan, A. U. (2020). An
Investigation of the factors affecting institutional
performance: Evidence from higher education
institutions. In FWU Journal of Social Sciences, 14(3),
131–144. https://doi.org/10.51709/fw1272j/fall2020/
10
Khashab, B., Gulliver, S. R., & Ayoubi, R. M. (2020). A
framework for customer relationship management
strategy orientation support in higher education
institutions. Journal of Strategic Marketing, 28(3),
246–265. https://doi.org/10.1080/
0965254X.2018.1522363
Kilani, M. A., & Kobziev, V. (2016). An overview of
research methodology in information system. OALib,
03(11), 1–9. https://doi.org/10.4236/oalib.1103126
Kutay, E., & Oner, D. (2022). Coding with Minecraft: The
development of middle school students’ computational
thinking. ACM Transactions on Computing Education,
22(2), 1–19. https://doi.org/10.1145/3471573
Kyza, E. A., Georgiou, Y., Agesilaou, A., & Souropetsis,
M. (2022). A cross-sectional study investigating
primary school children’s coding practices and
computational thinking using ScratchJr. Journal of
Educational Computing Research, 60(1), 220–257.
https://doi.org/10.1177/07356331211027387
Laurent, G., Moussa, M. D., Cirenei, C., Tavernier, B.,
Marcilly, R., & Lamer, A. (2021). Development,
implementation and preliminary evaluation of clinical
dashboards in a department of anesthesia. Journal of
Clinical Monitoring and Computing, 35(3), 617–626.
https://doi.org/10.1007/s10877-020-00522-x
Manuel Mora, Wang, Fen, Gómez, Jorge Marx,
Rainsinghani, Mahesh S., & Savkova, Valentyna.
(2017). Decision-making support systems in quality
management of higher education institutions: a
selective review. International Journal of Decision
Support System Technology, 9(2), 56–79. https://
doi.org/10.4018/IJDSST.2017040104
McCoy, C., & Rosenbaum, H. (2019). Uncovering
unintended and shadow practices of users of decision
support system dashboards in higher education
institutions: Uncovering unintended and shadow
practices of users of decision support system
dashboards in higher education institutions. Journal of
the Association for Information Science and
Technology, 70(4), 370–384. https://doi.org/10.1002/
asi.24131
Meçe, E. K., Sheme, E., Trandafili, E., Juiz, C., Gómez, B.,
& Colomo-Palacios, R. (2020). Governing IT in HEIs:
Systematic mapping review. Business Systems
Research Journal, 11(3), 93–109. https://doi.org/
10.2478/bsrj-2020-0029
Mitchell, S.-L., & Clark, M. (2019). Reconceptualising
product life-cycle theory as stakeholder engagement
with non-profit organisations. Journal of Marketing
Management, 35(1–2), 13–39. https://doi.org/10.1080/
0267257X.2018.1562487
Münch, J., Trieflinger, S., & Lang, D. (2019). The product
roadmap maturity model deep: Validation of a method
for assessing the product roadmap capabilities of
organizations. In S. Hyrynsalmi, M. Suoranta, A.
Nguyen-Duc, P. Tyrväinen, & P. Abrahamsson (Eds.),
Software Business, 370, 97–113. https://doi.org/
10.1007/978-3-030-33742-1_9
Nieto, Y., Gacia-Diaz, V., Montenegro, C., Gonzalez, C.
C., & Gonzalez Crespo, R. (2019). Usage of machine
learning for strategic decision making at higher
educational institutions. IEEE Access, 7, 75007–75017.
https://doi.org/10.1109/ACCESS.2019.2919343
Ozcan, S., Homayounfard, A., Simms, C., & Wasim, J.
(2022). Technology roadmapping using text mining: A
foresight study for the retail industry. IEEE
Transactions on Engineering Management, 69(1), 228–
244. https://doi.org/10.1109/TEM.2021.3068310
Park, J., Mostafa, N. A., & Han, H. (2020). “StoryWeb”: A
storytelling‐based knowledge‐sharing application
among multiple stakeholders. Creativity and
Innovation Management, 29(2), 224–236. https://
doi.org/10.1111/caim.12368
Peffers, K., Tuunanen, T., Rothenberger, M. A., &
Chatterjee, S. (2007). A design science research
methodology for information systems research. Journal
of Management Information Systems, 24(3), 45–77.
https://doi.org/10.2753/MIS0742-1222240302
Pfeiffer, B., Coster, W., Tucker, C., & Piller, A. (2018).
Development and content validity of the participation
and sensory environment questionnaire. Occupational
Therapy in Mental Health, 34(2), 105–121. https://
doi.org/10.1080/0164212X.2017.1383221
Pikas, E., Koskela, L., & Seppänen, O. (2020). Improving
building design processes and design management
practices: A case study. Sustainability, 12(3), 911.
https://doi.org/10.3390/su12030911
Plummer, P. (2017). Focus group methodology. Part 1:
Design considerations. International Journal of
ICSBT 2024 - 21st International Conference on Smart Business Technologies
54

Therapy and Rehabilitation, 24(7), 297–301. https://
doi.org/10.12968/ijtr.2017.24.7.297
Pruzan, P. (2016). Research Methodology: The Aims,
Practices and Ethics of Science, 1–326. https://doi.org/
10.1007/978-3-319-27167-5
Ragab, M. A., & Arisha, A. (2017). Research methodology
in business: A starter’s guide. Management and
Organizational Studies, 5(1), 1. https://doi.org/
10.5430/mos.v5n1p1
Rauschenberger, M., & Baeza-Yates, R. (2021). How to
handle health-related small imbalanced data in machine
learning? I-Com, 19(3), 215–226. https://doi.org/
10.1515/icom-2020-0018
Roberts, L. D., Howell, J. A., & Seaman, K. (2017). Give
me a customizable dashboard: Personalized learning
analytics dashboards in higher education. Technology,
Knowledge and Learning, 22(3), 317–333. https://
doi.org/10.1007/s10758-017-9316-1
Rust, P., Flood, D., & McCaffery, F. (2016). Creation of an
IEC 62304 compliant software development plan: IEC
62304 compliant SDP. Journal of Software: Evolution
and Process, 28(11), 1005–1010. https://doi.org/
10.1002/smr.1826
Sanni-Anibire, M. O., Zin, R. M., & Olatunji, S. O. (2021).
Machine learning—Based framework for construction
delay mitigation. Journal of Information Technology in
Construction, 26, 303–318. https://doi.org/10.36680/
j.itcon.2021.017
Sareminia, S., Hasanzadeh, A., Elahi, S., & Montazer, G.
(2019). Developing technology roadmapping
combinational framework by meta synthesis technique.
International Journal of Innovation and Technology
Management, 16(02), 1950019. https://doi.org/
10.1142/S0219877019500196
Schall, M. C., Cullen, L., Pennathur, P., Chen, H., Burrell,
K., & Matthews, G. (2017). Usability evaluation and
implementation of a health information technology
dashboard of evidence-based quality indicators.
Computers, Informatics, Nursing, 35(6), 281–288.
https://doi.org/10.1097/CIN.0000000000000325
Scholtz, B., Calitz, A., & Haupt, R. (2018). A business
intelligence framework for sustainability information
management in higher education. International Journal
of Sustainability in Higher Education, 19(2), 266–290.
https://doi.org/10.1108/IJSHE-06-2016-0118
Sequeira, N., Reis, A., Branco, F., & Alves, P. (2023).
Roadmap for implementing business intelligence
systems in higher education institutions: Exploratory
work. Proceedings of the 20th International
Conference on Smart Business Technologies, 162–169.
https://doi.org/10.5220/0012118000003552
Sorour, A., Atkins, A. S., Stanier, C. F., & Alharbi, F. D.
(2020). Comparative frameworks for monitoring
quality assurance in higher education institutions using
business intelligence. 2020 International Conference
on Computing and Information Technology (ICCIT-
1441), 1–5. https://doi.org/10.1109/ICCIT-
144147971.2020.9213808
Su, S. I., Fan, X., & Shou, Y. (2020). A design science-
based case study of retail chain delivery operations and
its implications. International Journal of Physical
Distribution & Logistics Management, 51(3), 212–235.
https://doi.org/10.1108/IJPDLM-11-2019-0352
Sutherland, E. (2016). The case study in
telecommunications policy research. INFO, 18(1), 16–
30. https://doi.org/10.1108/info-07-2015-0040
Turnbull, D., Chugh, R., & Luck, J. (2021). The use of case
study design in learning management system research:
A label of convenience? International Journal of
Qualitative Methods, 20, 160940692110041. https://
doi.org/10.1177/16094069211004148
Valdez, A., Cortes, G., Castaneda, S., Vazquez, L., Medina,
J., & Haces, G. (2017). Development and
implementation of the balanced scorecard for a higher
educational institution using business intelligence tools.
International Journal of Advanced Computer Science
and Applications, 8(10). https://doi.org/10.14569/
IJACSA.2017.081022
Vallurupalli, V., & Bose, I. (2018). Business intelligence
for performance measurement: A case based analysis.
Decision Support Systems, 111, 72–85. https://doi.org/
10.1016/j.dss.2018.05.002
Viberg, O., Hatakka, M., Bälter, O., & Mavroudi, A.
(2018). The current landscape of learning analytics in
higher education. Computers in Human Behavior, 89,
98–110. https://doi.org/10.1016/j.chb.2018.07.027
Weggelaar-Jansen, A. M. J. W. M., Broekharst, D. S. E., &
De Bruijne, M. (2018). Developing a hospital-wide
quality and safety dashboard: A qualitative research
study. BMJ Quality & Safety, 27(12), 1000–1007.
https://doi.org/10.1136/bmjqs-2018-007784
Yahaya, J., Hani, N., Deraman, A., & Yah, Y. (2019). The
implementation of business intelligence and analytics
integration for organizational performance
management: A case study in public sector.
International Journal of Advanced Computer Science
and Applications, 10(11). https://doi.org/10.14569/
IJACSA.2019.0101140
Yildiz, E., Møller, C., & Bilberg, A. (2021). Demonstration
and evaluation of a digital twin-based virtual factory.
The International Journal of Advanced Manufacturing
Technology, 114(1–2), 185–203. https://doi.org/
10.1007/s00170-021-06825-w
Zuo, G., Li, M., Yu, J., Wu, C., & Huang, G. (2022). An
efficient motion planning method with a lazy
demonstration graph for repetitive pick-and-place.
Biomimetics, 7(4), 210. https://doi.org/10.3390/
biomimetics7040210
Roadmap for Implementing Business Intelligence Systems in Higher Education Institutions: Validation of a Case Study at the University of
Trás-os-Montes and Alto Douro
55
