
A Decision-Making Approach Combining Process Mining, Data
Mining and Business Intelligence
Olfa Haj Ayed
1a
and Sonia Ayachi Ghannouchi
1,2 b
1
Higher Institute of Management of Sousse, University of Sousse, Tunisia
2
Laboratory RIADI-GDL, ENSI, University of Mannouba, Tunisia
Keywords: Process Mining, Data Mining, Business Intelligence, Visualisations, Dashboards.
Abstract: In the era of Big Data, Process Mining (PM), Data Mining (DM) and Business Intelligence (BI) are essential
analytical tools for companies. By intelligently exploiting big data, these approaches make it possible to
extract valuable information. Although each has its own orientation, concepts, techniques and modes of
visualization, these three disciplines converge towards a common goal: improving decision-making. This
work proposes an innovative approach which consists in combining the strengths of PM, DM and BI within
a powerful global dashboard. This centralized dashboard will bring together visualizations from all three
domains, providing a holistic and interactive overview of key business data. By providing decision-makers
with these information-rich visualizations, the study aims to facilitate and accelerate the decision-making
process, thus allowing informed and responsive strategic choices.
1 INTRODUCTION
In today's information age, informed decision-making
has become a critical issue for businesses. To achieve
this, decision-makers need a comprehensive
overview and a deep understanding of the company's
data. A dashboard, bringing together visualizations
from Process Mining, Data Mining and Business
Intelligence, becomes a valuable tool to meet this
need.
A dashboard combining PM, DM and BI provides
many benefits to decision makers such as having a
global vision, it offers a synthetic overview of the
company by grouping information from different
sources and disciplines. The visualizations from PM,
DM and BI allow to analyse the data in depth, to
identify trends, anomalies and opportunities. By
having a global view and a deep understanding of
data, decision makers can make more informed and
strategic decisions. In addition to effective problem
solving, the dashboard facilitates the identification of
problems and the implementation of adequate
solutions. Visualizations make it possible to follow
the evolution of the key performance indicators
(KPIs) and to measure the effectiveness of the
a
https://orcid.org/0009-0004-5610-0817
b
https://orcid.org/0000-0001-9583-9797
processes. Finally, having a performance
improvement and a better decision-making process
contribute to the improvement of the overall
performance of the company. Our work is part of this
approach by proposing the creation of a powerful
global dashboard combining the strengths of PM, DM
and BI. The major contributions of our work are:
Creation of intermediate PM, DM and BI
dashboards which allow to structure and
analyse the data from each domain
independently.
Development of a powerful global dashboard
which centralizes the visualizations of the three
domains, offering a coherent and interactive
overview.
The rest of this paper presents in detail the
different stages of our work: Section 2 presents our
background. Regarding the third section, it deals with
the related work. In section 4, we illustrate the
research problem and our proposed approach. Section
5 presents the guidance tool. Section 6 presents our
case study result. In section 7, we conclude this paper
450
Haj Ayed, O. and Ghannouchi, S.
A Decision-Making Approach Combining Process Mining, Data Mining and Business Intelligence.
DOI: 10.5220/0012852500003753
Paper published under CC license (CC BY-NC-ND 4.0)
In Proceedings of the 19th International Conference on Software Technologies (ICSOFT 2024), pages 450-457
ISBN: 978-989-758-706-1; ISSN: 2184-2833
Proceedings Copyright © 2024 by SCITEPRESS – Science and Technology Publications, Lda.

2 BACKGROUND
Process mining (PM) is defined as a technology that
utilizes event logs corresponding to real Behavior
recorded during the execution of a business process.
It helps to discover, monitor, and improve processes
in real time by extracting knowledge available in
system log files. It leads to delivering an assessment
on the conformance status of business process
execution (Van der Aalst, 2016).
Data Mining (DM) is defined as a process that
aims to generate knowledge about very large
databases and to produce results in a comprehensive
way to the user. Indeed, DM extracts non-trivial,
implicit, previously unknown and potentially useful
information (Schuh et al., 2019).
Business Intelligence (BI) is a set of methods,
processes, architectures, applications, and
technologies that collect and transform raw data into
meaningful and useful information used to enable
strategic, tactical, and operational insights and more
effective decision-making to drive business
performance (Tripathi et al., 2020).
Data Visualization is the graphical representation
of information extracted from raw data. It consists of
transforming complex and abstract data into images,
tables, graphs and other visual elements that are easy
to understand and interpret. The goal is to make data
easier to understand by making it more accessible and
intuitive (Azzam et al., 2013).
3 RELATED WORK
The scientific literature is full of relevant work
exploring the use of dashboards in BI (Orlovskyi &
Kopp, 2020), PM (Martinez-Millana et al., 2019), and
DM (Maya D. Albayrak & William Gray-Roncal,
2019) approaches. This work demonstrates the
usefulness of dashboards to visualize and analyse data
from different sources, thus facilitating informed
decision-making. This section presents an overview
of relevant previous work related to combination of
approaches.
In (Kumar SM & Meena Belwal, 2017), the
authors use BI, DM and data visualization
technologies to create a scoreboard that presents the
information by underestimating the behaviour of the
company from its inception. In addition, it provides
an overview to users, making complex datasets easier
for them to use, and it also tracks the ability of the
service to meet service level objectives. Based on
several recent works the researchers were able to
create a powerful Dashboard by adding more features
to what is already created among these new functions
including the integration of BI technologies, Data
mining and data visualization technologies to analyse
business trends, business growth, profit amount,
employee performance, customer satisfaction and
improvement areas. The proposed performance
dashboard features an ideal single-pane real-time user
interface, showing a graphical presentation of the
historical status and trends of organizations' key
performance indicators that enable executive
decision-making at a glance and improve business
performance.
In (Nik et al., 2019), the authors describe a custom
visual of Microsoft Power BI, called BIpm, which
was created by combining Process Mining and
Business Intelligence Analysis through a single
platform. To achieve their objectives the researchers
went through several steps, starting with the
preparation of the input fields and placing them in the
Power BI pane as well as the event logs, Let’s not
forget that Process Mining is a technology that
requires the presence of event logs to determine the
behaviour of processes so it is necessary to have
events logs consistent with Power BI. Once all these
fields are entered correctly, BIpm creates the process
model as a directed flow graph. BIpm offers an online
analysis for decision makers in industry. This solution
allows to analyse complex events logs, on the one
hand it enriches the BI dashboards with the
exploration of interactive online processes, and on the
other hand it allows BI users to expand their toolsets
by inferring process models.
According to (Hendricks, 2019), DM can be
used in the field of health, but not only the DM, there
is also the PM which seems similar to the DM in
terms of measuring large data files, but in this case,
we are talking about event logs to a particular process
or a series of processes. The PM was performed on a
Dutch patient hospital log event with sepsis entering
the emergency room, to understand this method of
analysis, highlight the information discovered and
determine its role in data mining, and their release and
possible readmission stages. This analysis makes it
possible to map and analyse the processes, and also to
highlight the areas of clinical operations requiring
further investigation including a possible relationship
with the patient’s readmission and method of release.
A Decision-Making Approach Combining Process Mining, Data Mining and Business Intelligence
451
4 RESEARCH PROBLEM AND
PROPOSED SOLUTION
This section discusses the research problem and our
proposed solution.
4.1 Research Problem
Effective decision-making relies on a comprehensive
understanding of the entire business environment and
granular data. To facilitate this task, dashboards
provide a centralized space for data visualization and
activity tracking, enabling informed decision making
and effective problem solving.
Technological developments, particularly in the
field of information technology, have revolutionized
the decision-making process. Well-designed and
organized dashboards enable decision makers to
efficiently navigate large amounts of data, turning
raw information into actionable insights. The
importance of sound decision-making cannot be
overstated, as it has the potential to propel an
organization to new heights or to its downfalls.
Recognizing the strengths of each individual
approach, our research focuses on integrating BI, DM
and PM methodologies to create a powerful
dashboard that empowers decision-makers.
Specifically, we address the following research
questions:
How much is it useful to combine the three
approaches of DM, PM and BI?
How to produce a dashboard for a decision-
maker considering the three approaches DM,
PM and BI?
4.2 Proposed Solution
Our research aims to develop a powerful dashboard
that facilitates informed decision-making for
managers by combining the strengths of PM (Project
Management), BI (Business Intelligence) and DM
(Data Mining) approaches. To do this, we propose the
creation of intermediate dashboards specific to each
approach, followed by the integration of the most
relevant visualizations in a powerful global
dashboard.
Intermediate BI Dashboard: This dashboard
will focus on analyzing and visualizing
business data, providing decision makers with
an overview of key performance indicators
(KPIs) and business trends.
Intermediate DM Dashboard: This dashboard
will focus on exploring and analyzing
operational data, enabling decision makers to
identify opportunities for process and decision-
making improvement.
Intermediate PM Dashboard: This dashboard
will focus on project management and task
tracking, providing decision makers with
visibility into project progress and potential
risks
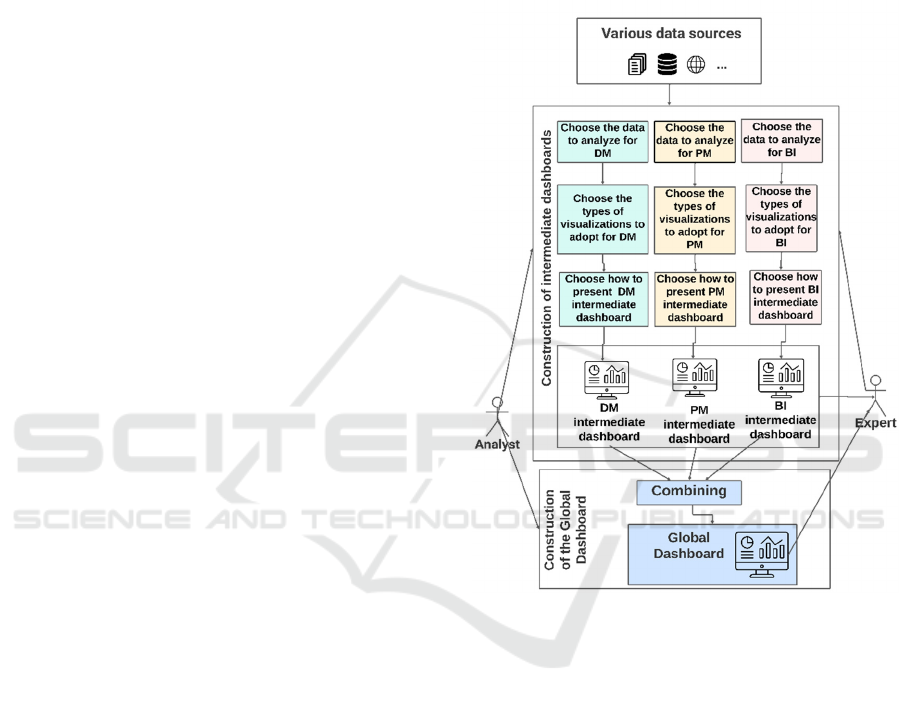
Figure 1 : Overview of the proposed approach.
The judicious selection and combination of the most
relevant and effective visualizations from the
intermediate dashboards will be essential to create a
powerful global dashboard. This global dashboard
will provide decision-makers with a comprehensive
and synthetic view of key information for decision-
making.
To achieve our main objective, it is crucial to define
precise and repetitive sub-objectives for each
approach (PM, BI and DM). These sub-objectives
will guide the selection of the data to be analysed, the
choice of the types of visualization to adopt and the
way to present the final dashboard.
Our approach is distinguished by its ability to
facilitate decision-making and providing managers
with clear and relevant visualizations from the
intermediate dashboards. The advantage lies in the
combination of the three major approaches that are
ICSOFT 2024 - 19th International Conference on Software Technologies
452
PM, DM and BI, thus offering a global and informed
perspective for decision-making.
As shown in Figure 1, we propose to divide this
part into two sub-parts, the first will be dedicated to
the steps followed to develop the three intermediate
dashboards. While the second part will be devoted to
the creation of our global dashboard that combines
visualisations of intermediate dashboards.
Our work involves close collaboration between
business experts, end users of dashboards, and
analysts, in charge of their design. The data comes
from an online sales website. The creation process
goes through several stages. The analyst selects and
prepares (cleans) the relevant data for DM, PM and
BI analyses, guaranteeing their quality and reliability.
Subsequently, in collaboration with the business
expert, the analyst offers a guidance tool that defines
the types of visualizations most suited to the three
approaches and it is up to the trade expert to choose
the visualisations. Then, based on the jointly defined
visualization choices, the analyst selects an
appropriate methodology to create the intermediate
dashboards (PM, DM and BI), making full use of the
prepared data. Finally, the analyst combines
intermediate dashboards, ensuring optimal
consistency and fluidity of information, to create an
informative and intuitive global dashboard.
This collaborative approach ensures that
dashboards meet the specific needs of business
experts while leveraging analysts' expertise in data
processing and visualization. The result is a powerful
dashboard that facilitates informed decision-making
and promotes the achievement of strategic objectives.
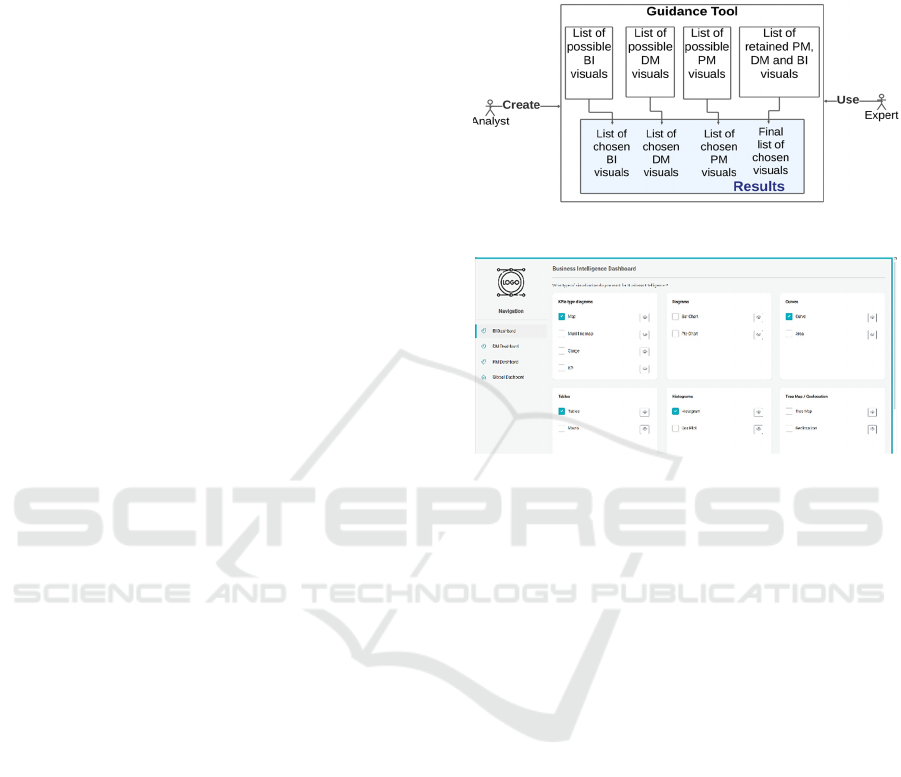
5 GUIDANCE TOOL
The guidance tool, as shown in figures 2 and 3,
developed with the Angular framework, offers an
intuitive and user-friendly interface consisting of four
sub-interfaces dedicated to the selection of
visualizations for BI, DM, PM and the global
dashboard. Each sub-interface presents a list of
relevant visualizations accompanied by an "eye" icon.
By clicking on this icon, the business line manager
accesses a detailed description of the type of
visualization and an illustrative example. To select
the desired visualizations, the business manager
simply ticks the corresponding boxes and clicks on
the "Export" button. An Excel file is then generated,
containing the complete list of selected visualizations.
The business line manager then sends the Excel file
to the analyst, who uses it as the basis for creating the
intermediate dashboards and the global dashboard.
This collaboration ensures that dashboards meet the
specific needs of the business leader while leveraging
the analyst’s expertise in data processing and
visualization.
Figure 2: Overview of the guidance tool.
Figure 3: Interface of BI dashboard construction in the
guidance tool.
6 CASE STUDY
Our case study focuses on the field of e-commerce,
focusing more specifically on the online sales of
medical products. To carry out this analysis, we have
exploited an extensive database from an e-commerce
website specialized in this field. This information-
rich database allowed us to explore customers' buying
behaviours, identify market trends and draw valuable
conclusions for optimizing online sales strategies for
medical products.
6.1 Proposed Solution
For the development of the three intermediate
dashboards, we follow a three-step process: data
selection and preprocessing, visualization technique
selection, and dashboard design.
6.1.1 Choosing and Preprocessing Data to
Analyse
Choosing the right data for analysis, whether it’s BI,
PM or DM, is crucial to making informed decisions
and extracting valuable information from the
A Decision-Making Approach Combining Process Mining, Data Mining and Business Intelligence
453
organization’s information assets. This fundamental
step is to understand the content of the data sources
and carefully align the data with the specific
objectives of the analysis. Let’s take the example of
Process Mining (PM), which aims to analyse business
processes from system logs. To analyse a document
with the PM, it is crucial to have a log file containing
at least three mandatory fields, Case ID, Activity and
Timestamp.
Rigorous data selection and preparation is a
fundamental step for effective analysis, whether in
BI, PM or DM. By following these key steps, we
ensure that the data used is relevant, reliable and
aligned with the objectives of the analysis, thus
obtaining valuable and actionable information.
6.1.2 Choosing Visualisation
We detail below which visualisation is chosen for
each domain.
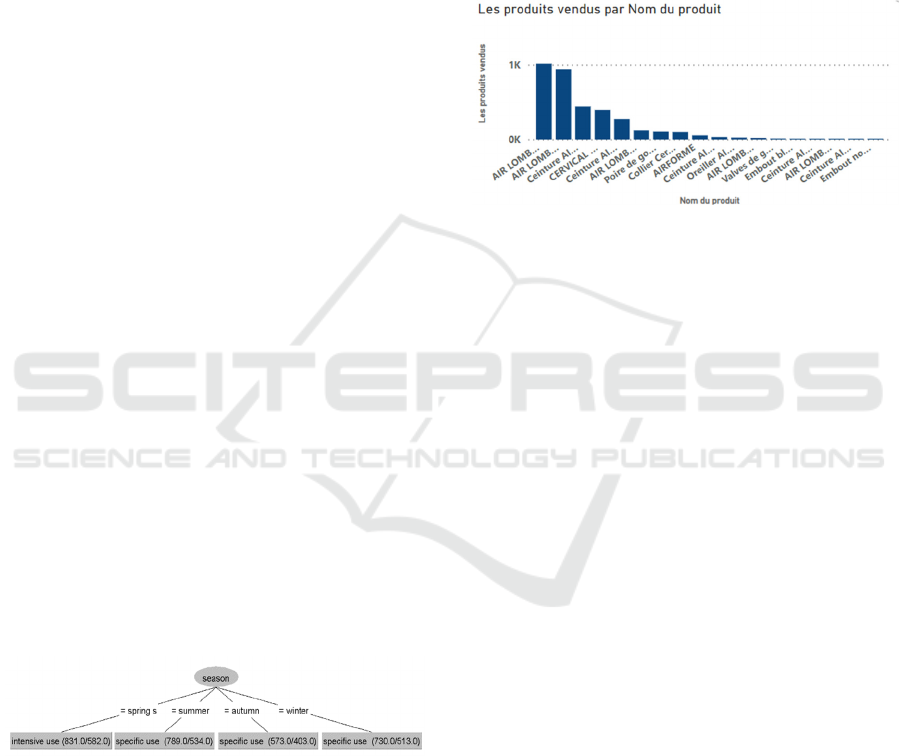
Choosing Visualisation for DM:
The decision tree is a powerful tool for classifying
product usage patterns (Breşfelean, 2007). To classify
the usage patterns of medical products according to
various factors, the expert chose the decision tree, a
method known for its effectiveness and simplicity of
interpretation. Three separate decision trees were
constructed to explore specific aspects of usage
patterns. The first decision tree focused on gender.
Whereas, the second tree, focused on age category.
The last decision tree revolved around season, which
is considered the most important, as it analyses the
impact of the seasons on the trends of use of the
products. The analysis shows that the use of products
is more intensive in spring, while it becomes punctual
in summer, autumn and winter. In addition, product
sales are higher in Spring than in Summer, Autumn
and Winter.
Figure 4: Customers' buying habits according to the season.
These insights allow the decision maker to adapt its
marketing strategy according to the seasons by
proposing relevant products to meet the needs of
customers at each period of the year (fig 4)
The use of SimpleKMeans algorithm might be
useful. It’s a clustering technique recognized in DM.
The use of Scatter Plot in DM is particularly
interesting for its simplicity and flexibility (Soma
Ajibade & Adediran, 2016). It allows an easy and fast
understanding of the data by the decision-makers. In
this case, Scatter Plot illustrates the number of orders
placed by age groups.
Choosing Visualisation for BI:
As part of this analysis, the expert selects five key
types of visualizations to effectively communicate
critical information which are maps, histogram, bar
graph, curve diagram and Pie Chart.
Figure 5 : The greatest product.
Histograms present a classic and effective method for
comparing and classifying multiple elements (Airinei
& Homocianu, 2010), In our case, this visualization
proved particularly useful to identify the best-selling
product. The analysis of the histogram allowed to
deduce the product which knows the greatest success
with the customers (fig 5). The expert also chose the
Bar Chart to present the distribution of customers by
region in terms of total number. This visualization is
particularly useful for decision-makers because it
makes it easier to identify regions with a lower
number of customers (Airinei & Homocianu, 2010).
The analysis of the bar graph makes it possible to
direct marketing efforts towards less active regions,
targeting these potential customers with strategies
adapted to social networks.
Choosing Visualisation for PM:
The first example explores the social network (Turner
et al., 2012) of employees. This analysis allows to
visualize the interactions between employees, to
identify the poles of influence and to understand the
collaborative dynamics within the organization.
The second example implements a Process Map
(Turner et al., 2012), to analyse the sales management
process, as shown in figure 6. This approach makes it
possible to understand the progress of sales steps,
detect inefficiencies and implement optimization
strategies to improve sales performance.
ICSOFT 2024 - 19th International Conference on Software Technologies
454
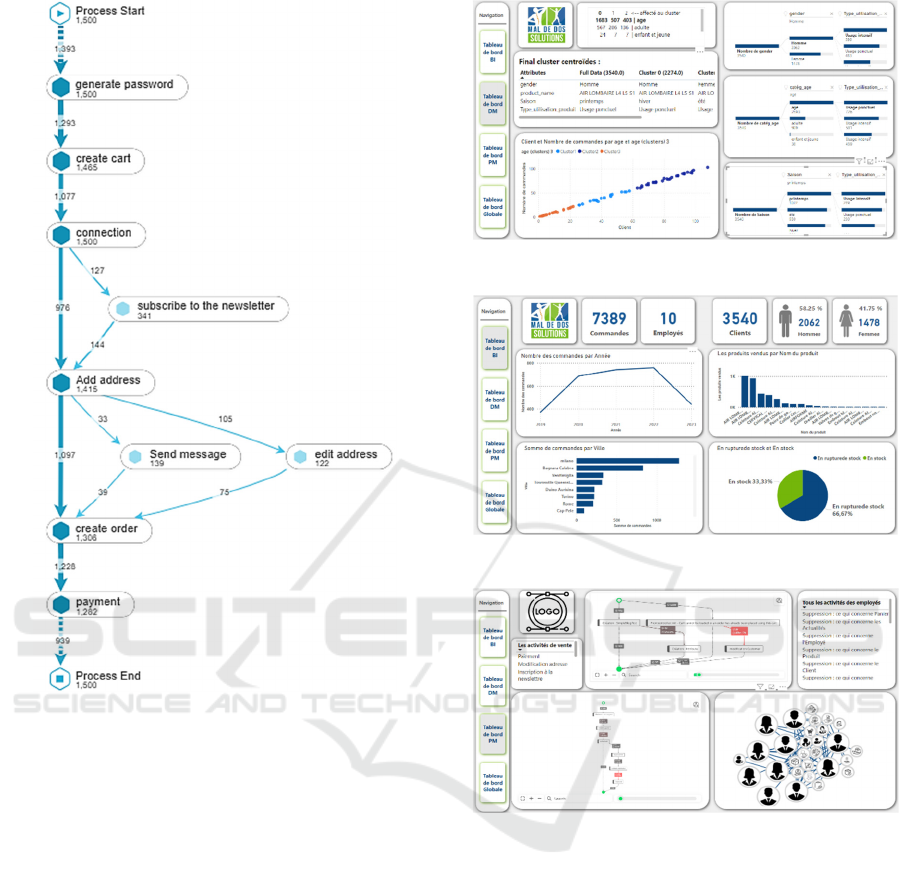
Figure 6: Sales management handling process map.
6.1.3 Choosing How to Represent
Dashboards
Once individual visualizations are developed, the
next step is to integrate them into dashboards in a
clear, concise and visually appealing way. The goal is
to allow users to quickly and easily understand the
data presented. As part of this project, Power BI tool
was chosen to create those dashboards. We have the
most relevant KPIs, which are quantifiable and
measurable, for the goals of our dashboards. Color
and font are also used to highlight important
information and create a visual hierarchy by ensuring
consistency with the corporate graphic charter. In
addition, we keep the layout simple and clean by
trying not to clutter the dashboards with too much
information by focusing on the most important
elements and leaving enough white space for easy
reading. Figures 7, 8 and 9 illustrate the intermediate
DM, BI and PM dashboards obtained, respectively.
Figure 7: Obtained intermediate DM dashboard.
Figure 8: Obtained intermediate BI dashboard.
Figure 9: Obtained intermediate PM dashboard.
6.2 Global Dashboard
The analyst uses the results of the guidance tool to
develop the overall dashboard, which is structured in
three distinct sections, devoted respectively to DM,
PM and BI. Each section presents a defined number
of visualizations, carefully selected to ensure optimal
readability.
In our specific case study, the BI cards were
selected because of their ability to present clear and
useful values. The PM sales management process
map was chosen to illustrate the main sales process,
while the social network allows employees to see
their activities. Finally, the table describing the
SimpleKMeans DM algorithm is chosen for its ability
to confirm decision tree results and provide additional
A Decision-Making Approach Combining Process Mining, Data Mining and Business Intelligence
455
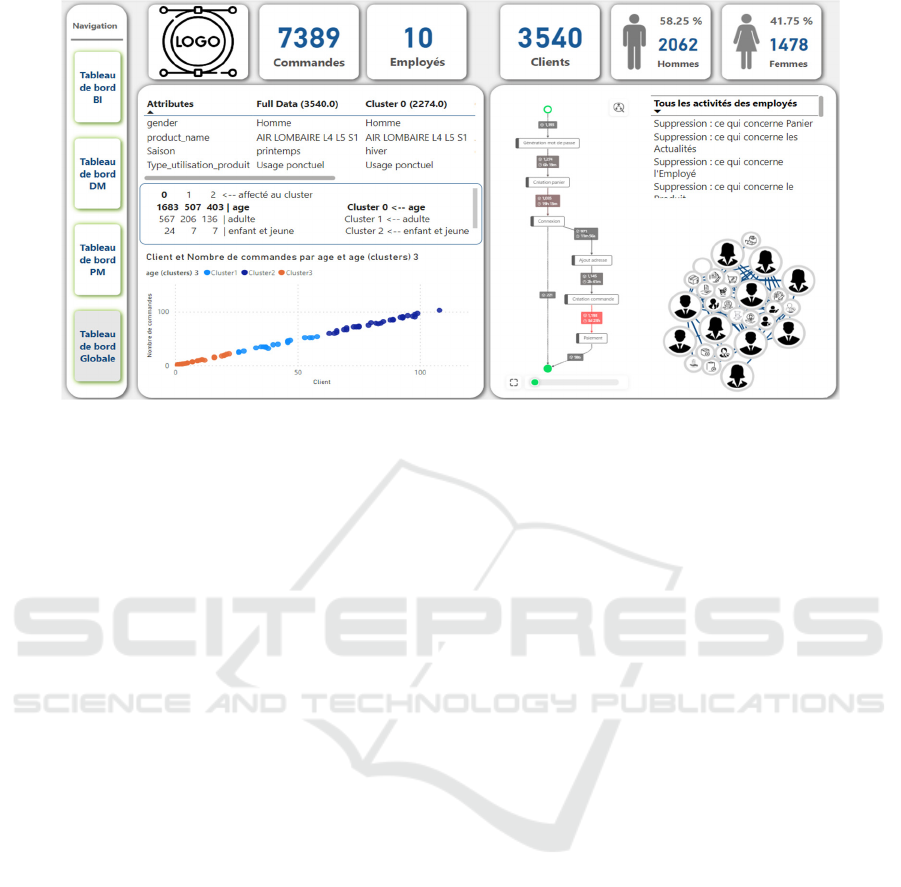
Figure 10: Obtained global dashboard.
information. The global dashboard, which brings
together visualizations from different areas of
analysis, provides a comprehensive overview of the
company’s performance and the factors that influence
it. This holistic approach allows the manager to make
informed decisions based on evidence and a thorough
understanding of different aspects of the business (Fig
10).
The expert then has the freedom to customize the
dashboard according to his/her needs. For example, if
he/she wants to replace a table with a decision tree
visualization, Power BI gives the flexibility to make
this change with ease: simply delete the dashboard,
navigate to the DM Intermediate Dashboard and
transfer the desired visualization to the global
dashboard.
In summary, a global dashboard that combines
visualizations from data mining, business intelligence
and process mining is a powerful tool for companies
looking to improve their performance, make informed
decisions and optimize their operations.
6.3 Validation
A thorough discussion with the expert highlighted the
many benefits of the proposed approach. The expert
first welcomed the notion of intermediate dashboards,
highlighting their ability to facilitate data exploration
and analysis, avoiding direct immersion in a large
database. Besides the usefulness and
complementarity of each of the intermediary
dashboards (respectively specific to Process Mining,
Data Mining and Business Intelligence), their
combination in the global dashboard seemed
particularly relevant to him. In fact, it offers him/her
a global and coherent vision informing him/her about
the health of the company and the functioning of its
activities. The expert particularly appreciated the
ability to customize the global dashboard by selecting
the visualizations that best suit his needs and
preferences. This flexibility allows focusing on the
most important information and saving time in the
decision-making process.
7 CONCLUSION
A single dashboard that integrates Process Mining
(PM), Data Mining (DM), and Business Intelligence
(BI) visualizations offers a powerful solution to this
challenge. This combined approach empowers
decision-makers to identify trends, anomalies, and
opportunities with greater clarity. Beyond effective
problem-solving, the dashboard facilitates proactive
management by aiding in problem identification,
targeted solutions, and KPI tracking. Ultimately, the
improved decision-making facilitated by this
comprehensive data analysis leads to enhanced
overall company performance. This paper outlines
our work, which adheres to this data-driven approach
and proposes the creation of a robust global
dashboard harnessing the strengths of PM, DM, and
BI. We first create intermediate dashboards which
offer independent data structuring and analysis within
each of the domains of PM, DM and BI. Second, we
develop a Powerful Global Dashboard which is a
central hub integrating visualizations from all three
domains, delivering a coherent and interactive
overview. This comprehensive approach fosters a
ICSOFT 2024 - 19th International Conference on Software Technologies
456

data-driven decision-making ecosystem, allowing for
informed choices that propel business forward.
As part of our future work, we propose to extend
the scope of our project by integrating case studies
from other sectors of activity, such as e-health. This
challenge represents an essential strategic step to
enrich our project, broaden its scope of application,
strengthen its credibility and contribute to the
advancement of knowledge in the field of data
analysis.
In order to further optimize the user experience
and decision-making, we consider the integration of
artificial intelligence (AI) as a major development
axis. AI will enrich dashboards and provide valuable
decision support to users. Specifically, we will
explore the use of machine learning techniques such
as time series analysis algorithms to identify trends
and anomalies in real time. In addition, natural
language processing (NLP) could be integrated to
analyze the texts present in the data and thus enrich
the insights extracted. With these AI technologies,
users will receive immediate feedback and alerts
based on real-time analysis of dashboard content.
REFERENCES
Airinei, D., & Homocianu, D. (2010). Data visualization in
business intelligence. Proc. of the 11th WSEAS Int.
Conf. on Mathematics and Computers in Business and
Economics, MCBE ’10, Proc. of the 11th WSEAS Int.
Conf. on Mathematics and Computers in Biology and
Chemistry, MCBC ’10, 164–167. https://doi.org/
10.4324/9781315471136-6
Azzam, T., Evergreen, S., Germuth, A. A., & Kistler, S. J.
(2013). Data visualization and evaluation. New
Directions for Evaluation, 2013(139), 7–32.
https://doi.org/10.1002/ev.20065
Breşfelean, V. P. (2007). Analysis and predictions on
students’ behavior using decision trees in weka
environment. Proceedings of the International
Conference on Information Technology Interfaces, ITI,
51–56. https://doi.org/10.1109/ITI.2007.4283743
Hendricks, R. (2019). Process Mining of Incoming Patients
with Sepsis. Online Journal of Public Health
Informatics, 11(2). https://doi.org/10.5210/ojphi.v11
i2.10151
Kumar SM, & Meena Belwal. (2017). Performance
Dashboard Cutting-Edge Business Intelligence and
Data Visualization. IEEE.
Martinez-Millana, A., Lizondo, A., Gatta, R., Vera, S.,
Salcedo, V. T., & Fernandez-Llatas, C. (2019). Process
mining dashboard in operating rooms: Analysis of staff
expectations with analytic hierarchy process.
International Journal of Environmental Research and
Public Health, 16(2). https://doi.org/10.33
90/ijerph16020199
Maya D. Albayrak, & William Gray-Roncal. (2019). Data
mining and sentiment analysis of real-time Twitter
messages for monitoring and predicting events.
Nik, M. R. H., Van Der Aalst, W. M. P., & Sani, M. F.
(2019). BIPM: Combining Bi and process mining.
DATA 2019 - Proceedings of the 8th International
Conference on Data Science, Technology and
Applications, 123–128. https://doi.org/10.5220/0
007741901230128
Orlovskyi, D., & Kopp, A. (2020). A Business Intelligence
Dashboard Design Approach to Improve Data
Analytics and Decision Making.
Schuh, G. , Reinhart, G. , Prote, J. P. , Sauermann, F. ,
Horsthofer, J. , Oppolzer, F. , & Knoll, D. (2019). Data
mining definitions and applications for the
management of production complexity.
Soma Ajibade, S., & Adediran, A. (2016). An Overview of
Big Data Visualization Techniques in Data Mining. In
International Journal of Computer Science and
Information Technology Research (Vol. 4).
www.researchpublish.com
Tripathi, A., Bagga, T., & Aggarwal, R. K. (2020).
Strategic Impact of Business Intelligence: A Review of
Literature Abstract.
Turner, C. J. , Tiwari A, & Olaiya R. (2012). Business
Process Mining: From Theory to Practice.
Van der Aalst, W. (2016). Process mining: Data science in
action. In Process Mining: Data Science in Action.
Springer Berlin Heidelberg. https://doi.org/10.100
7/978-3-662-49851-4
A Decision-Making Approach Combining Process Mining, Data Mining and Business Intelligence
457
