
Evaluating the Relative Importance of Product Line Features
Using Centrality Metrics
Fathiya Mohammed
1
a
, Mike Mannion
2
b
, Hermann Kaindl
3
c
and James Paterson
2
d
1
School of Computing, Engineering & Physical Sciences, University of West of Scotland, Paisley, U.K.
2
Department of Computing, Glasgow Caledonian University, 70 Cowcaddens Road, Glasgow, G4 0BA, U.K.
3
Institute of Computer Technology, TU Wien, Austria
Keywords: Feature Model, Centrality Metrics, Product Line.
Abstract: A software product line is a set of products that share a set of software features and assets, which satisfy the
specific needs of one or more target markets. One common artefact of software product line engineering is a
feature model, usually represented as a directed acyclic graph, which shows the product line as a set of
structural feature relationships. We argue that there are benefits to considering a feature model as a directed
graph and an undirected graph, respectively. One element of managing the impact of a change to these models,
as they increase in complexity, is to evaluate the relative importance of the features. This paper explores the
application of centrality metrics from social network analysis for the identification of the relative importance
of features in feature models. The metrics considered are degree centrality, closeness centrality, eccentricity
centrality, eigenvector centrality and between-ness centrality. To illustrate, a product feature model is
constructed from a real-world GSMA AI-mobile phone product line requirements specification.
1 INTRODUCTION
A software product line is a common platform to
develop a family of products at lower cost, reduced
time to market and with better quality (BS ISO 2017).
The discipline of systematically planning,
constructing, evolving and managing that set of
products is known as Software Product Line
Engineering (SPLE). In SPLE, a product line feature
model consists of a hierarchy of features with some
additional cross-cutting relationships.
Over time, within a product line organisation, as
the volume and variety of products increase in scope
and scale, and personnel come and go, the risk of the
organization not fully understanding the product line
increases. Feature model analysis methods and tools
can help mitigate that risk. Feature models are usually
represented as (directed acyclic) graphs. Graphs can
represent application problems in many fields e.g.
city networks, biological networks, social media.
Feature model analysis can benefit from graph
a
https://orcid.org/0009-0004-7563-5614
b
https://orcid.org/0000-0003-2589-3901
c
https://orcid.org/0000-0002-1133-0529
d
https://orcid.org/0000-0002-6955-1009
analysis theory.
There can be different purposes for analyszing a
feature model. (Benavides, 2010) provides a review
of automated approaches to analysis for discovering
valid product configurations and managing them
effectively. Other purposes include conducting an
impact analysis of a change to the model, planning the
introduction of a new product, or making a
comparison of products configured from the model.
Within most product lines, some features are
often perceived by different stakeholders as having a
different level of importance than others. A high
relative importance might be attributed, for example,
to a feature being a key differentiator in its market
sector, of significant value to a key customer, a
significant conduit for communication between other
features, or as start of a set of features whose design
will be allocated to an external third party. Often,
during feature model analysis, the greater the relative
importance of a feature, the more attention it receives
and the more influence it has on the analysis outcome.
Mohammed, F., Mannion, M., Kaindl, H. and Paterson, J.
Evaluating the Relative Importance of Product Line Features Using Centrality Metrics.
DOI: 10.5220/0012853300003753
Paper published under CC license (CC BY-NC-ND 4.0)
In Proceedings of the 19th International Conference on Software Technologies (ICSOFT 2024), pages 469-476
ISBN: 978-989-758-706-1; ISSN: 2184-2833
Proceedings Copyright © 2024 by SCITEPRESS – Science and Technology Publications, Lda.
469

Some characteristics that contribute to the
calculation of a feature’s relative importance can be
determined by its semantic properties e.g. its
significance to a key customer. Other characteristics
can be determined by its structural properties within
the model e.g. how many features depend on it. For a
product line that contains thousands of features the
calculation of relative importance values is only
practical when done automatically.
Different structural graph analysis metrics afford
an insight into the scope and scale of an application
problem. They are a useful aid when the scale and
scope of the graph make visual inspection unwieldy.
In social network analysis (Scott, 2017) centrality
metrics provide an assessment of each vertex’s
structural relative importance within a graph i.e. its
“centrality” to the graph.
This paper explores the application of several
centrality metrics to help identify the relative
importance of different features in a product line
feature model. The metrics considered are: degree
centrality, close centrality, eccentricity centrality,
eigenvector centrality and between-ness centrality.
Our research question is:
RQ1: What are the effects of different metrics for
calculating a feature’s relative importance
in a software product line?
We address this question by constructing a feature
model from a real-world product line requirements
specification and examining the value of the metrics.
Section 2 reviews the representation of a product
line feature model as a graph to make this paper self-
contained. Section 3 introduces a real-world product
line specification for next generation mobile phones.
Section 4 shows the calculations for centrality
metrics. Section 5 presents the application of the
metrics to the mobile phone specification. Section 6
discusses the the findings. Section 7 refers to related
work. Section 8 draws some conclusions.
2 SPL FEATURE MODELS
Feature models are often large and complex and many
factors affect their design e.g. graphical notation,
language rigour, tool support availability, ease of
comprehension, navigation difficulty, encoding
simplicity, analysis complexity, and product
configuration process. A feature model is often
constructed as a set of structural feature relationships
organized in a hierarchical graph with some abstract
features that aid modelling but are unimplemented.
The most popular graphical representation of a
feature model is a tree with additional crosscutting
relationships between nodes (Appendix 1), resulting
in an undirected acyclic graph.
Expressing crosscutting relationships between
features in different parts of the graph is hard and
often done separately in text. In (BS ISO, 2017) such
relationships are restricted to requires and excludes.
Sometimes, these relationships are so complex that
product-preserving transformation mechanisms are
needed to convert them into a feature modelling
language (Knuppel et al, 2017) to make processing
easier albeit longer
.
Product configuration is the task of selecting
features for a product from the feature model. During
selection, the feature model can be traversed using
different methods. Regardless, selection decisions are
largely governed by a feature’s variability type. This
property anticipates that not all features will appear in
every product. Domain engineers who construct and
maintain a feature model allocate values to feature
variability-type properties based on the existing
product portfolio and product roadmaps. Over the
lifecycle of a product line, for any individual feature,
the value of its variability-type property may also
change as features move in and out of popularity.
Table 1 shows four commonly used variability
types (BS ISO, 2017). When a feature is selected and
its variability type is Mandatory, it is automatically
selected. When a feature is selected and its variability
type is Exclusive-OR then only one of the set of
mutually exclusive features must be selected. When a
feature is selected and its variability type is Inclusive-
OR then one, some or all must be selected. When a
feature is selected and its variability type is Optional,
then it can be selected or not.
Table 1: Description of Variability Type.
Variability Type Description
Mandatory
A mandatory feature is automatically
selected.
Exclusive-OR
A set of choices which are mutually
exclusive and only one must be selecte
d
Inclusive-OR
A set of choices of which one, some or all
must be selected
Option
A single choice which may or may not be
selected
A feature model is sometimes implicitly
considered a directed graph because some features
are regarded as parents and some as children, In an
undirected graph, edges represent a two-way
connection between features. Deciding if a product
line feature model an undirected or a directed graph
can vary depending on the purposes of the modelling.
ICSOFT 2024 - 19th International Conference on Software Technologies
470

3 GSMA APPLICATION
The Global Systems for Mobile communications
Association (GSMA) is a worldwide industry trade
body to support and promote the interests of hundreds
of mobile operators. Its purposes include easing
cooperation between countries deploying GSM
technology, facilitating protocols and standards,
supporting interoperability, and encouraging
innovation across the mobile ecosystem.
In July 2023, to accelerate the deployment of AI
technology across the industry, GSMA published a
non-confidential Artificial Intelligence (AI) Mobile
Device Requirements Specification (GSMA, 2023).
In effect, it specifies a set of product line
requirements. Actual products derived from this
specification will have some but not all of the features
this specification points to. In the specification,
readers are directed to (Bradner, 1997) to understand
the interpretation of the keywords “MUST”, “MUST
NOT”, “REQUIRED”, “SHALL”, “SHALL NOT”,
“SHOULD”, “SHOULD NOT”,
“RECOMMENDED”, “MAY” and “OPTIONAL”.
We used this specification to construct a feature
model. We introduced some abstract features in the
model to aid modelling and understanding, but they
would not be implemented in any product. We gave
each requirement an identifier. A full list showing
how we labelled each requirement in the specification
and where we introduced some abstract requirements
is at https://figshare.com/s/1475000bed40c6f7bc56.
We did not have access to the authors of this
document so in structuring the feature model and
allocating a variability type for each feature (using
Table 1) we used our own interpretation and do not
claim it to be the best.
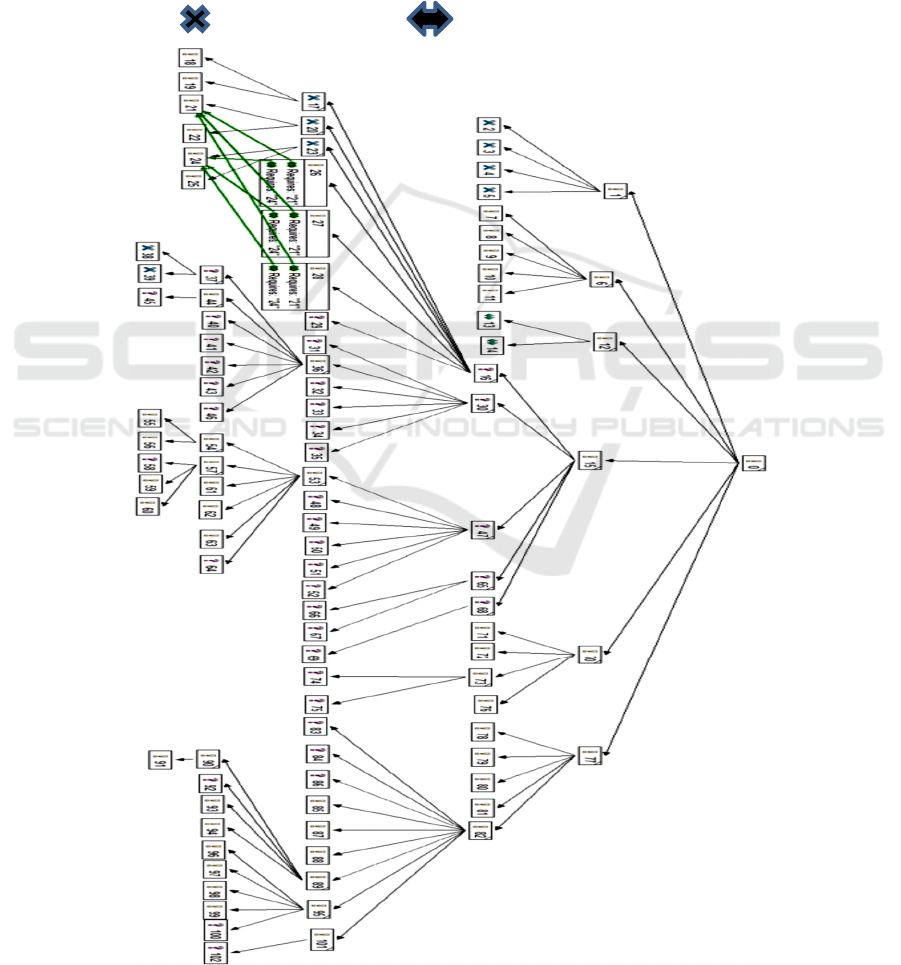
Appendix 1 shows a feature model. It uses the
notation of the tool it was constructed with,
pure::variants (Pure Systems, 2024). Many feature
models are implicitly assumed to be directed graphs
because they adopt the guidance in (Lee et al, 2002)
i.e. the model captures structural or conceptual
relationships among features e.g. a composed-of
relationship, a generalization-specialization
relationship, an implemented-by relationship which in
turn assumes information flow direction. In practice,
when analysing a feature model the comprehension
process is iterative and includes viewing the model as
a directed and an undirected graph.
To illustrate product configuration, let us assume
for simplicity that the GSMA feature model is
traversed depth-first starting at Feature 0. Feature 1 is
considered first and selected automatically because it
is Mandatory a. Next, one or more of Features 2, 3, 4,
5 are selected because their variability type is
Inclusive-OR. Feature 6 is selected automatically
because it is Mandatory. Then, one or more of
features 7, 8, 9, 10, 11 are selected because their
variability type is Inclusive-OR. Feature 12 is
selected automatically because it is mandatory. Then
either Feature 13 or Feature 14 is selected because
their variability-type is Exclusive-OR. The process
continues until all selections have been made.
4 DETERMINING A FEATURE’S
RELATIVE IMPORTANCE
The process of allocation of a relative importance
value to a feature is undertaken before feature
analysis takes place. Importance is normally
represented by attaching a weight to a feature and/or
to the edges connecting it. Maintaining agreement on
weights allocation is difficult for many reasons
including the different perspectives of organizational
stakeholders, changes to the model, having people
who work on the product line come and go over time.
Collectively, they motivate seeking an automatic
weight allocation method.
Social Network Analysis (Scott, 2017) is the
discipline of analyzing the relationships of interaction
among actors in a social network. A network is
arranged as a graph with vertices and edges
connecting the vertices. Important vertices are
typically those which maintain the graph’s
cohesiveness, or are significant information conduits
from lying on pathways through which other vertices
are reached. Normally, the higher the connectivity of
a feature the greater is its relative importance.
In a product line feature model, a vertex is a
feature. Centrality metrics can provide an assessment
of each feature’s relative importance within a feature
model. There are many centrality metrics, each one a
function of the number of connections a feature has
to other features and the strength of each connection.
Connectivity can be measured in different ways,
reflecting an understanding that a feature might be
strongly connected locally within the graph but
weakly connected globally, or vice-versa. Some
metrics also consider connectivity to highly important
features wherever they are in the graph. Such features
may exist a priori from the graph structure e.g. the
root of a tree, or are designated by an engineer.
In large feature models, the manual allocation of
weights is not tenable and an agreed algorithm for the
automatic allocation of weights needs to be
established. We do not address this issue in this paper.
Degree Centrality: The connection strength of a
feature F can be formed by calculating the degree of
each feature (vertex) on a graph i.e. the sum of the
Evaluating the Relative Importance of Product Line Features Using Centrality Metrics
471

total number of edges going into the feature (in-
degree) and the total number of edges coming out of
the feature (out-degree). Eq. (1) shows that for an
undirected graph, the Degree Centrality (DC) of a
feature F is the sum of the connection strengths FG
i
for each F directly connected to a feature G
i
(i.e. “one-
hop”) where D
F
is the total number of connections to
feature F. Normalisation between 0 and 1 is achieved
through division by (N-1) where N is the total number
of features in the graph.
D
F
DC (F)= (Σ FG
i
) / (N-1)
(1)
i=0
Closeness Centrality: The overall connection
strength of a feature F can be formed by calculating
the average shortest distance from each feature to
every other feature G
i
where N is the total number of
features in the graph (Eq. 2). For undirected graphs
inward and outward edges are included in the
calculations. For directed graphs, only the out-degree
is included. If there is no (directed) path from F to G
i
then the distance is 0. If the sum of the distances for
a feature is small then its closeness is high. The higher
the closeness the quicker a feature can communicate
to other features across the graph. Closeness
Centrality can be a useful measure of identifying
global connectivity but in a highly connected
network, many features can have similar scores and
are less distinctive in their global relevance.
Closeness Centrality can also help with finding
influential features in an isolated large cluster.
D
F
CC (F) = 1 / (Σ FG
i
(avg shortest path distance)) (2)
i=0
Eccentricity Centrality: The overall connection
strength of a feature F can be formed by calculating
the maximum distance (longest path) between the
feature and any other feature G
i
in the graph. Eq. 3
shows Eccentricity Centrality to be the inverse of the
maximum distance i.e. the shorter the distance the
greater the relative importance. Eccentricity can be a
useful indicator of the absolute centrality of a feature
within a graph. For undirected graphs, inward and
outward edges are included in the calculations. For
directed graphs, only outward edges are included, and
if there is no outward edge e.g. on leaf features, then
the eccentricity score is 0.
D
F
EC (F) = 1 / Σ FG
i
(max distance) (3)
j= 0
Eigenvector Centrality: The overall connection
strength of a feature F can be formed by calculating if
it has an outgoing connection to features that in turn
have outgoing connections or if it has incoming
connections from features that themselves have
incoming connections. Eq. (4) shows that the
Eigenvector Centrality of F connected to G
i
is a
function of the eigenvector centralities of the features
that G
i
is connected to. For undirected graphs inward
and outward edges are included in the calculations.
For directed graphs, only outward edges are included.
Eigenvector centrality can be a useful measure of
global relevance. For directed graphs, a feature’s
importance derives from the centrality of the features
that point to it; for undirected graphs, a feature’s
importance combines the centrality of features that
point to it and those to which it points where
D
F
is the
set of features directly connected to F and where λ is
a constant.
D
F
EGC (F) = (1/λ) Σ EGC(G
i
) (4)
i=0
Between-ness Centrality: The overall connection
strength of a feature F can be formed by calculating
the number of times it lies on one of the shortest paths
between two other features P
i
and Q
j
(Eq. 5). For
undirected graphs inward and outward edges are
included in the calculations. For directed graphs, only
the out-degree is included. Features with high
between-ness centrality are important because they
typically connect different groups of features.
Features with a low between-ness centrality are less
important and are often located at the periphery of a
network. To normalize the value between 0 and 1
divide by (N-1)(N-2) where N is the total number of
features in the graph. For directed graphs divide by
(N-1)(N-2)/2.
D
F
BC (F) = Σ No. shortest paths in P
i
Q
j
going through F (5)
i,j, i≠j
No. of shortest paths in P
i
Q
j
Table 2 summarises the Centrality Metrics used
Table 2: Summary of Centrality Metrics.
Metric Benefits
Degree
Centrality
a measure of a feature’s local connectivity
(“one-hop” connections)
Closeness
Centrality
a measure of how quickly a feature can
communicate to other features across the
graph
–
the closer the bette
r
Eccentricity
Centrality
a measure of a feature’s distance to the absolute
centre point of the graph
Eigenvector
Centrality
a measure of a feature’s connectivity to other
important features
Between-ness
Centrality
a measure of a feature’s connectivity to
disparate groups of features
The metrics in Eqs. (1-5) assume that the connection
strength value (“weight”) of the connecting edge
between features is the same throughout the network
and equal to 1, effectively “unweighted”.
ICSOFT 2024 - 19th International Conference on Software Technologies
472

5 GSMA MODEL
Using the GSMA feature model we calculated values
for each of the five centrality metrics in Section 3.
Table 3 and 4 show the top 10 ranked features for
each centrality metric when considering the feature
model as an unweighted undirected graph. and an
unweighted directed graph.
Full tables are available at:
https://figshare.com/s/
1475000bed40c6f7bc56.
Table 3: Centrality Metrics for Feature Model as an
Unweighted Undirected Graph.
Unweighted Undirected Graph
Feature Rank DC CC EC EGC BC
1 82 15 0 16 15
2 16 0 15 15 0
3 36 77 77 82 77
4 30 16 1 0 82
5 47 30 6 30 47
6 53 47 12 77 30
7 0 6 70 47 16
8 6 12 16 26 53
9 15 65 30 27 36
10 77 68 47 28 70
Table 4: Centrality Metrics for Feature Model as an
Unweighted Directed Graph.
Directed Graph
Feature Rank DC CC EC EGC BC
1 82 1 2 21 15
2 16 6 3 24 82
3 36 12 4 38 47
4 30 17 5 39 53
5 47 20 7 45 30
6 53 23 8 55 36
7 0 26 9 56 16
8 6 27 10 58 77
9 15 28 11 59 89
10 77 37 13 60 95
When comparing metrics on the same graph, the
feature rank is more helpful than the absolute value
because the calculations are different. Absolute
values can be helpful when comparing the structure
of two different graphs with the same metric (using
normalised values between 0 and 1). Table 5a and 6b
show the frequency with which a feature appears in
the Top 10 rankings in Table 3 e.g. in Table 3 Feature
15 appears in the Top 10 for all five metrics.
For the unweighted undirected graph, the most
prominent six features that appear in each metric list
are: Features, 0, 15, 16, 30, 47, 77. Appendix 1 shows
these features occupy prominent roles in the upper
echelons of the model. Interestingly, Features 16, 30
and 47 are all Optional which raises the question of
whether they actually should be Optional. In other
cases, where a feature appears in the Top 10 of only
one metric, consideration might be given to whether
these features are connected appropriately within the
model. For example, consider Features 26 and 27
concerning device unlocking and application login,
respectively. Given that access to many functions is
dependent on if a device is locked or not and whether
a user is logged in or not, one might review if these
features should be situated higher up the model.
Table 5: Frequency of Top Features in Centrality Metrics
for Unweighted Graphs (a) Undirected (b) Directed.
Undirected (Table 3) Directed (Table 4)
Feature Top 10
Ranking
Frequency
Feature
Top 10
Ranking
Frequency
0 5 6 2
15 5 16 2
16 5 36* 2
30 5 47 2
47 5 53 2
77 5 77 2
6 4 82 2
82 3 89* 2
12,36,53,70 2 95* 2
*These 3 features also share the highest value for Closeness Centrality
with 16 other features so arguably are slightly more important.
For the unweighted directed graph, several
prominent features are also prominent in the
undirected graph i.e. Features 6, 16, 36, 47, 77, 82,
but their Top 10 ranking frequency is lower, which
seems to be less helpful. Similarly, Feature 15, which
appears prominently in the undirected graph, does not
appear in the directed graph principally because it is
not in the top 10 rankings for the closeness,
eccentricity or eigenvector metrics. However,
representing a feature model as a directed graph helps
identify “root nodes” and “leaf nodes”. Root nodes
have only outward connections i.e. their in-degree
value is 0. Leaf nodes have only inward connections
i.e. their out-degree is 0, and the closeness, between-
ness and eigenvector centrality metrics will be 0.
6 DISCUSSION AND THREATS
TO VALIDITY
Product line feature models evolve over time and can
include changes to their topology and to each
feature’s properties and its relative importance.
Relative importance metrics offer clues to where
significant impacts might occur as a model evolves
and are computationally straightforward.
Any analysis of a feature model using metrics
requires the normal degree of caution and prudence
about relying on any one metric. A single individual
metric is likely to be of greater value to managers and
Evaluating the Relative Importance of Product Line Features Using Centrality Metrics
473

engineers when it is placed against other sources of
evidence. The practices of reflection, relying on
intuition and any visual inspection of the graphical
version of a feature model, if available and practical,
remain valuable methods to deploy alongside metrics.
Relative Importance here refers only to a feature’s
prominence within the model and may be affected by
other perspectives of the supplier or a customer,
captured in a feature’s semantic properties. Future
work might explore the value of other centrality
metrics as well as combining them with semantic
property values. The usefulness of a metric is often
determined by the running time of the algorithm that
implements it. We did not explore the running times
of each of these metrics on very large feature models.
Allocating weights to features and edges in a
feature model can offer additional insight into the
relationships between features. In large feature
models, weights allocation is untenable without the
use of an automated algorithm. We did not address
automatic weight allocation in this paper. Future
work might also consider whether weights should be
adapted to reflect different influences that features
might have on one another when models are
scrutinised for different purposes e.g. examining the
impact of proposed changes on different customers,
exploring design or implementation considerations,
or considering outsourcing arrangements.
We used the open-source tool Gephi version
0.10.1 (Gephi, 2024). We observed that the
calculation for degree centrality includes both inward
and outward edges whether the graph is directed or
undirected. However, when calculating the other four
metrics in a directed graph, Gephi only includes
outward edges. We also noted that if there are weights
attached to edges, Gephi includes these in its
calculations for degree centrality, but ignores them
for the other four metrics. We have not explored how
other tools behave.
7 RELATED WORK
Many graph metrics have been proposed to identify
important vertices in a graph, across many different
fields. Selecting the most suitable for specific
applications remains a challenge. To address this
problem a culling method is proposed (Chebotarev et
2003) that involves forming a set of candidate
measures, generating the minimum number of graphs
needed to distinguish each measure, constructing a
decision-tree survey for experts, and identifying the
measure consistent with the expert’s view.
Centrality metrics have been investigated for
diverse applications. For internet topology analysis,
(Wills et al, 2020) made a comparison of commonly
used graph metrics and distance measures to discern
between common topological features found in both
random graph models and real-world networks. They
proposed a multi-scale picture of a graph structure to
study the effect of global and local structures on
changes in distance measures. In (Wan et al, 2011) a
small number of centrality metrics are discussed in
their application and performance for solving various
computing and engineering problems in networks
based on extensive simulation experiments. A com-
parative overview of metrics for evaluating network
robustness is presented in (Oehlers et al, 2021). Other
applications include mobile social network applica-
tions (Zhou et al, 2018), visual reasoning in online
social networks (Correa et al, 2012), water distribu-
tion networks (Narayanan et al, 2014) and traffic
management for space satellite networks (Zhang et al,
2018). (Jirapanthong 2012) proposed the use of a
social network to represent software product line
artefacts and relationships between those artefacts to
apply centrality metrics for analysing the dependen-
cies between software artefacts and stakeholders to
improve software processes.
(Bagheri et al, 2011) showed that structural met-
rics in an SPLE feature model can be used to predict
its maintainability. Thresholds for implementation
metrics were examined in (Vale at al 2015). In
(Bagheri et al, 2010) a Stratified Analytic Hierarchy
Process (S-AHP) method is presented for prioritizing
(ranking) and filtering the features based on the judg-
ments of users of a product line, to enhance and ex-
pedite the feature selection and product configuration
process. An algorithm was described in (Peng et al,
2016) to identify the relative importance of a feature
in a feature model assumed to be a directed acyclic
weighted graph. Relative importance was calculated
as a function of weighted degree centrality i.e. the
weighted in-degree divided by the weighted out-de-
gree. The weight values allocated were 1 to manda-
tory, 0.5 to optional, 1/N for XOR where N is the total
number of features that are mutually exclusive and for
I-OR the weight is some value between 1/N and 1
where N is the total number of features that can be
included. Another approach to weight allocation was
presented in (Mannion et al, 2023), where features
were allocated weights based on their variability type
and where the calculations relied on designated start
and end vertices i.e. a directed graph was assumed.
In object-oriented software engineering, the
connections between classes and objects can be used
to build a dependency graph of classes from which
ICSOFT 2024 - 19th International Conference on Software Technologies
474

centrality measures can be extracted. This type of
graph was used in (Ouellet et al, 2023) to show that
using centrality measures in combination with object-
oriented metrics can improve the prediction of fault-
prone classes as well as the prediction of the number
of faults in a class. Centrality measures when
combined with object-oriented metrics can also be
shown (Levasseur et al, 2024) to better predict the
unit testing effort and help prioritize unit tests.
8 CONCLUSION
During product line feature model analysis, the more
important a feature, the more attention it receives and
the more influence it has on the analysis outcome.
Over time, as a product line evolves, features’ relative
importance values change and need to be
recalculated. We show how a small number of
centrality metrics drawn from social network analysis
can be used to establish a feature’s relative
importance for feature model analysis. The metrics
selected were: degree centrality, closeness centrality,
eccentricity centrality, eigenvector centrality and
between-ness centrality. The metrics provide some
insight into a feature’s contribution to a model’s
cohesiveness and the information flows between
features. We acknowledge that a feature’s relative
importance refers here only to its structural
prominence within a feature model and does not
include its value from other perspectives. We
recommended comparing how a feature ranks across
several metrics rather than just one metric.
REFERENCES
Bagheri, E., Gasevic, Assessing the Maintainability of
Software Product Line Feature Models using Structural
Metrics D., Software Qual J (2011) 19:579–612.
Bagheri, E., Asadi, M., Gasevic, D., Soltani, S. (2010).
Stratified Analytic Hierarchy Process: Prioritization
and Selection of Software Features, Proceedings of
14th Int’l Conference on Software Product Lines, SPLC
2010, LNCS 6287, J. Bosch and J. Lee (Eds.), 300–315.
Benavides, D., Sergio, S., Ruiz-Cortés, A. (2010).
Automated Analysis of Feature Models 20 Years Later:
A Literature Review, Information Sys, 35, 6, 615-636.
Bradner, S. (1997). Key words for use in RFCs to Indicate
Requirement Levels. See http://www.ietf.org/rfc
/rfc2119.txt (accessed 27/4/24)
BS ISO/IEC 26558:2017 (2017). Software and Systems
Engineering. Methods and Tools for Variability
Modelling in Software and Systems Product Line.
Chebotarev, P. Gubanov, D: How to Choose the Most
Appropriate Centrality Measure? A Decision Tree
Approach, https://arxiv.org/abs/2003.01052 (accessed
27/4/24)
C. Correa, T. Crnovrsanin, and K. Ma. (2012). Visual
Reasoning About Social Networks Using Centrality
Sensitivity. IEEE Transactions on Visualization and
Computer Graphics 18, 1 (Jan. 2012), 106–120.
Gephi, https://gephi.org/ (accessed 27/4/24)
Global Systems for Mobile communications Association
(GSMA), (2023). AI Mobile Device Requirements
Specification Version 2.0, https://www.gsma.com/new
sroom/wp-content/uploads//TS.47-v2.0.pdf (accessed
27/4/24)
Jirapanthong, W. (2012). Using Social Network Analysis
Technique for supporting Software Product Line
Process, Proc 2012 IEEE Int’l Conf. on Computer
Science and Automation Engineering, 344-348.
Knüppel, T., Thüm, S.. Mennicke, J.. Meinicke, J.,
Schaefer, I. (2017). Is There a Mismatch between Real-
World Feature Models and Product-Line Research,
ESEC/FSE’17, Sept 4-8, Paderborn, Germany, 291-302.
Lee, K., Kang, K.C., Lee, J. (2002). Concepts and
Guidelines of Feature Modeling for Product Line
Software Engineering, in Proceedings of International
Conference on Software Reuse, ICSR 2002:Software
Reuse: Methods, Techniques, and Tools, 62–77.
Levasseur, M-A., Mourad, B. (2024). Prioritizing unit tests
using object-oriented metrics, centrality measures, and
machine learning algorithms, Innovations in Systems
and Software Engineering, https://doi.org/10.1007
/s11334-024-00550-9.
Mannion, M., Kaind, H. (2023). Using Binary Strings for
Comparing Products from Software-Intensive Systems
Product Lines. In: Proceedings of 2023 IEEE 47th
Annual Computers, Software, and Applications
Conference (COMPSAC), Torino, 1638-1645.
Narayanan, I. Vasan, A., Sarangan, V., Kadengal, J.,
Sivasubramaniam, A. (2014). Little Knowledge Isn’t
Always Dangerous–Understanding Water Distribution
Networks Using Centrality Metrics. IEEE Transactions
on Emerging Topics in Computing, 2, 2, 225–238.
Oehlers, M., Fabian, B., (2021). Graph Metrics for Network
Robustness—A Survey
. Mathematics, 9(8), 895.
Ouellet, A., Mourad, B. (2024). Combining Object‐
Oriented Metrics and Centrality Measures to Predict
Faults in Object‐Oriented Software: An Empirical
Validation, Journal of Software Evolution and Process,
36, 4, April, e2548
Peng, Z., Wang, J., He, K., Li ,H. (2016). An Approach for
Prioritizing Software Features Based on Node
Centrality in Probability Network, Proc of the 15th Int’l
Conf on Software Reuse, ICSR 2016, Kapitsaki, G.M.,
Santana de Almeida, E (Eds.), 106–121.
Pure Systems, https://www.pure-systems.com/purevariants
(accessed 27/4/24)
Scott, J. (2017). Social Network Analysis, 4th edition.
Vale, G., Albuquerque, D., Figueiredo, E., Garcia, A.
(2015) Defining Metric Thresholds for Software
Product Lines: A Comparative Study, Proc of 19
th
Int’l
Conf on Software Product Lines, SPLC 2015, 176-185.
Evaluating the Relative Importance of Product Line Features Using Centrality Metrics
475
Wan, Z., Mahajan, Y., Kang, B.W., Moore, T.J., Cho, J-H.,
A Survey on Centrality Metrics and Their Implications
in Network Resilience, https://arxiv.org/pdf/2011.14
575.pdf (accessed 27/4/24)
Wills, P. Meyer, F., Chen, P-Y. (2020). Metrics for Graph
Comparison: A Practitioner's Guide, PloS one, 15, 2,
p.e0228728-e0228728
Zhang, Z., Jiang, C., Guo, G., Qian, Y. and Y. Ren. (2018).
Temporal Centrality-balanced Traffic Management for
Space Satellite networks. IEEE Transactions on
Vehicular Technology 67, 5, 4427–4439.
Zhou, H., Ruan, M., Zhu, C., Leung, V,. Xu, S., Huang. C.
(2018). A Time-ordered Aggregation Model-based
Centrality Metric for Mobile Social Networks. IEEE
Access 6, 25588–25599.
APPENDIX
GSMA Mobile Phone Specification
!
Mandatory Inclusive_OR Exclusive-OR
?
Optional
ICSOFT 2024 - 19th International Conference on Software Technologies
476
