
Visualizing OWL and RDF: Advancing Ontology Representation for
Enhanced Semantic Clarity and Communication
Giulia Biagioni
a
Unit ISP, Netherlands Organisation for Applied Scientific Research (TNO), New Babylon, Anna van Buerenplein 41a,
Den Haag, The Netherlands
Keywords:
Ontology Engineering, Visualization Tools, Standardized Visual Representation, RDF Semantics,
OWL Semantics.
Abstract:
This position paper advocates for the development of advanced visualization tools specifically designed to rep-
resent the full range of expressiveness conveyed by the vocabulary terms of OWL and RDFs. It highlights the
urgent need for a standardized way to visually refer to these vocabulary terms, addressing current challenges
in ontology visualization. The paper outlines the significant benefits that such tools and initiatives will deliver,
including enhanced clarity, improved communication among stakeholders, and more efficient management
of semantic data. By standardizing visual representations, the paper argues for a more intuitive and accessi-
ble approach to interacting with complex semantic structures, ultimately facilitating better understanding and
broader adoption of semantic web technologies.
1 INTRODUCTION
In the landscape of European Union initiatives, in-
cluding the establishment of data spaces and Inter-
net of Things (IoT) driven frameworks for smart en-
vironments, ontologies have emerged as essential in-
struments (Corcho and Simper, 2022)(Commission,
2022). These frameworks are instrumental in stan-
dardizing data across a myriad of sectors, enhanc-
ing interoperability, ensuring regulatory compliance,
and augmenting the functionality and integration of
smart technologies. This integration fosters interop-
erable and efficient communication among devices.
Despite the widespread acknowledgment of their util-
ity and the broad adoption across various domains, a
significant challenge persists: the lack of efficient vi-
sualization tools for examining the logical structures
of ontologies defined through RDFs (Resource De-
scription Framework) and OWL (Web Ontology Lan-
guage) standardized semantics
1
.
Current visualization tools fall short in enabling
users to effectively and thoroughly explore the intri-
cacies of ontology structures, encompassing their ax-
ioms, rules, and taxonomical classifications (Dud
´
as
a
https://orcid.org/0000-0002-9005-7945
1
For RDFs and OWL semantics cf. respectively: https:
//www.w3.org/TR/rdf-schema/ and https://www.w3.org/
TR/owl-guide/
et al., 2018). This gap in technological capability
significantly impedes users’ ability to conduct com-
prehensive inspections, which are critical to verify-
ing the consistency and accuracy of semantic con-
structions within ontologies. Moreover, this situa-
tion is compounded by the limitations inherent in ex-
isting RDFs and OWL-based reasoners, which often
struggle to identify contradictions or process infer-
ences with the necessary precision for ensuring se-
mantic consistency. Adding to these challenges is the
lack of a standardized approach for visually represent-
ing the vocabulary and symbols associated with OWL
and RDFS. This absence of a uniform visual language
hinders effective communication and comprehension
among stakeholders who interact with these semantic
systems.
There is a pressing need not only for improved
visualization tools that can adeptly handle the com-
plexity of ontological structures but also for the de-
velopment of a cohesive visual language that can
standardize the representation of semantic constructs.
Such advancements would greatly enhance clarity and
usability, enabling users to more effectively engage
with and utilize semantic technologies in their respec-
tive fields. This position paper will delve into these
challenges and propose strategic pathways to address
these critical gaps. The content of this paper is pre-
sented by respecting the following order. Section 1
Biagioni, G.
Visualizing OWL and RDF: Advancing Ontology Representation for Enhanced Semantic Clarity and Communication.
DOI: 10.5220/0012855900003756
Paper published under CC license (CC BY-NC-ND 4.0)
In Proceedings of the 13th International Conference on Data Science, Technology and Applications (DATA 2024), pages 571-576
ISBN: 978-989-758-707-8; ISSN: 2184-285X
Proceedings Copyright © 2024 by SCITEPRESS – Science and Technology Publications, Lda.
571

delineates the introduction. Section 2 addresses the
current state of ontology visualization tools and the
challenges faced by ontology engineers. Section 3 in-
vestigates the shortcomings of reasoners in analyzing
ontological structures and provide support to ontol-
ogy engineers in assessing the logical consistency of
the ontology. Section 4 discusses how semiotic prin-
ciples can enhance ontology visualization by creat-
ing intuitive and meaningful representations that fa-
cilitate better communication and understanding. The
conclusion emphasizes the critical need for integrat-
ing semiotic principles into visualization tools as the
semantic web grows, advocating for both the develop-
ment of visualization tools targeting the semantics of
OWL and RDFs and the creation of a standardized vi-
sual language (i.e set of symbols used in visualization
tools for ontologies) to refer to them.
2 STATUS & CHALLENGES
In the field of the semantic web, no visualization tool
or method has yet been universally adopted as the
standard, according to Dudas and colleagues (Dud
´
as
et al., 2018). This lack of a standard can be attributed
primarily to two main reasons. Firstly, there is no
’one-size-fits-all’ solution that caters to the varied re-
quirements of different users. Secondly, there has
been minimal progress in this area since 2007.
Dudas et al. (Dud
´
as et al., 2018) identify four
primary high-level use cases for ontology visualiza-
tion tools: editing, learning, inspecting, and sharing.
Visual editing involves generating an ontology script
automatically from a diagram, a feature particularly
useful for users unfamiliar with RDF(S) and OWL
syntax. Visualization tools also play a crucial role
in learning and inspecting ontology structures. These
activities are primarily aimed at ontology engineers
who need to identify and rectify semantic errors, in-
consistencies, and contradictions. Finally, sharing
knowledge representations visually provides an ef-
fective means to quickly communicate the scope of
ontologies, thereby enhancing understanding and col-
laboration.
Visualization tools offer a range of benefits that
can significantly enhance information processing and
management (Bernasconi et al., 2023). By increas-
ing cognitive memory and optimizing resource pro-
cessing, these tools make it easier and faster to ac-
cess and assimilate information (Skulmowski and Xu,
2022). They simplify the search for information and
enhance the ability to detect patterns, thus facilitating
quicker and more effective decision-making. Visual-
ization tools also support perceptual inference oper-
ations and improve attention mechanisms, which are
crucial for monitoring complex systems. Addition-
ally, these tools encode information in a format that is
easy to manipulate, allowing users to handle and ana-
lyze large datasets efficiently. They provide a com-
prehensive overview while enabling detailed explo-
ration, helping users to maintain a broad perspective
even as they delve into specific data points. Further-
more, visualization tools are invaluable for tracking
various elements and activities, and they excel at pro-
ducing abstract representations of scenarios by selec-
tively omitting and emphasizing certain pieces of in-
formation, thereby simplifying complex situations.
The visualization of ontologies, encompasses a di-
verse array of methods each suited to specific use
cases, including indented lists, node-link visualiza-
tions, force-directed layouts, tree layouts, radial lay-
outs, circle layouts, inverted radial tree layouts, Euler
diagrams, treemaps, 2.5D visualizations, and 3D vi-
sualizations. Each method caters to distinct aspects
of ontology visualization, from simple indented lists
that show hierarchical relationships in a straightfor-
ward, text-based format to more complex 3D visual-
izations that provide a spatial representation of data
but may struggle with the translation to 2D screens.
Additional features enhancing these visualizations in-
clude radar views for a minimap perspective, graphi-
cal and semantic zooming to adjust detail, entity fo-
cus to highlight specific data points, and history track-
ing for navigation. Advanced techniques like concept
clustering and semantic zooming allow for dynamic
interaction with the ontology, emphasizing the visual-
ization’s adaptability to user needs and the complex-
ity of the information displayed. Ultimately, visual-
ization tools for ontologies serve two primary pur-
poses: they can display data records structured ac-
cording to the ontologies, or they can visualize the
semantic constructs in OWL and RDFs that form the
foundation of the ontologies themselves. The latter
category of tools is crucial for illustrating how on-
tologies are built, revealing the composition and in-
teractions of various semantic elements that enable
machines to comprehend and process the meaning of
information and data, and infer new data.
Regarding specialized visualization tools de-
signed for displaying OWL and RDFS constructs us-
ing ’signs’ or ’symbols’, two notable examples are
Chowlk (Ch
´
avez-Feria et al., 2022) and WebVOWL
(Lohmann et al., 2017). Chowlk
2
enables users to
edit ontologies through a visualization interface, mak-
ing it an invaluable resource for those needing to
develop or modify ontologies while assessing their
2
Chowlk is accessible at: https://chowlk.linkeddata.es/
notation.html
DATA 2024 - 13th International Conference on Data Science, Technology and Applications
572
structure and semantics. Conversely, WebVOWL
3
focuses exclusively on inspection, offering a platform
for users to examine and understand the relationships
and structures within an ontology, though it lacks edit-
ing capabilities. Despite their significant contribu-
tions to enhancing the accessibility and usability of
ontological data, these tools also face specific limita-
tions. Chowlk, for example, does not permit the up-
loading and visualization of existing ontologies, lim-
iting its applicability. Meanwhile, WebVOWL, while
providing a visual insight into ontology semantics,
falls short in effectively revealing the detailed logi-
cal structure of ontologies, which can hinder a thor-
ough analysis of their construction. Moreover, both
tools do not support the visualization of all RDFs and
OWL constructs.
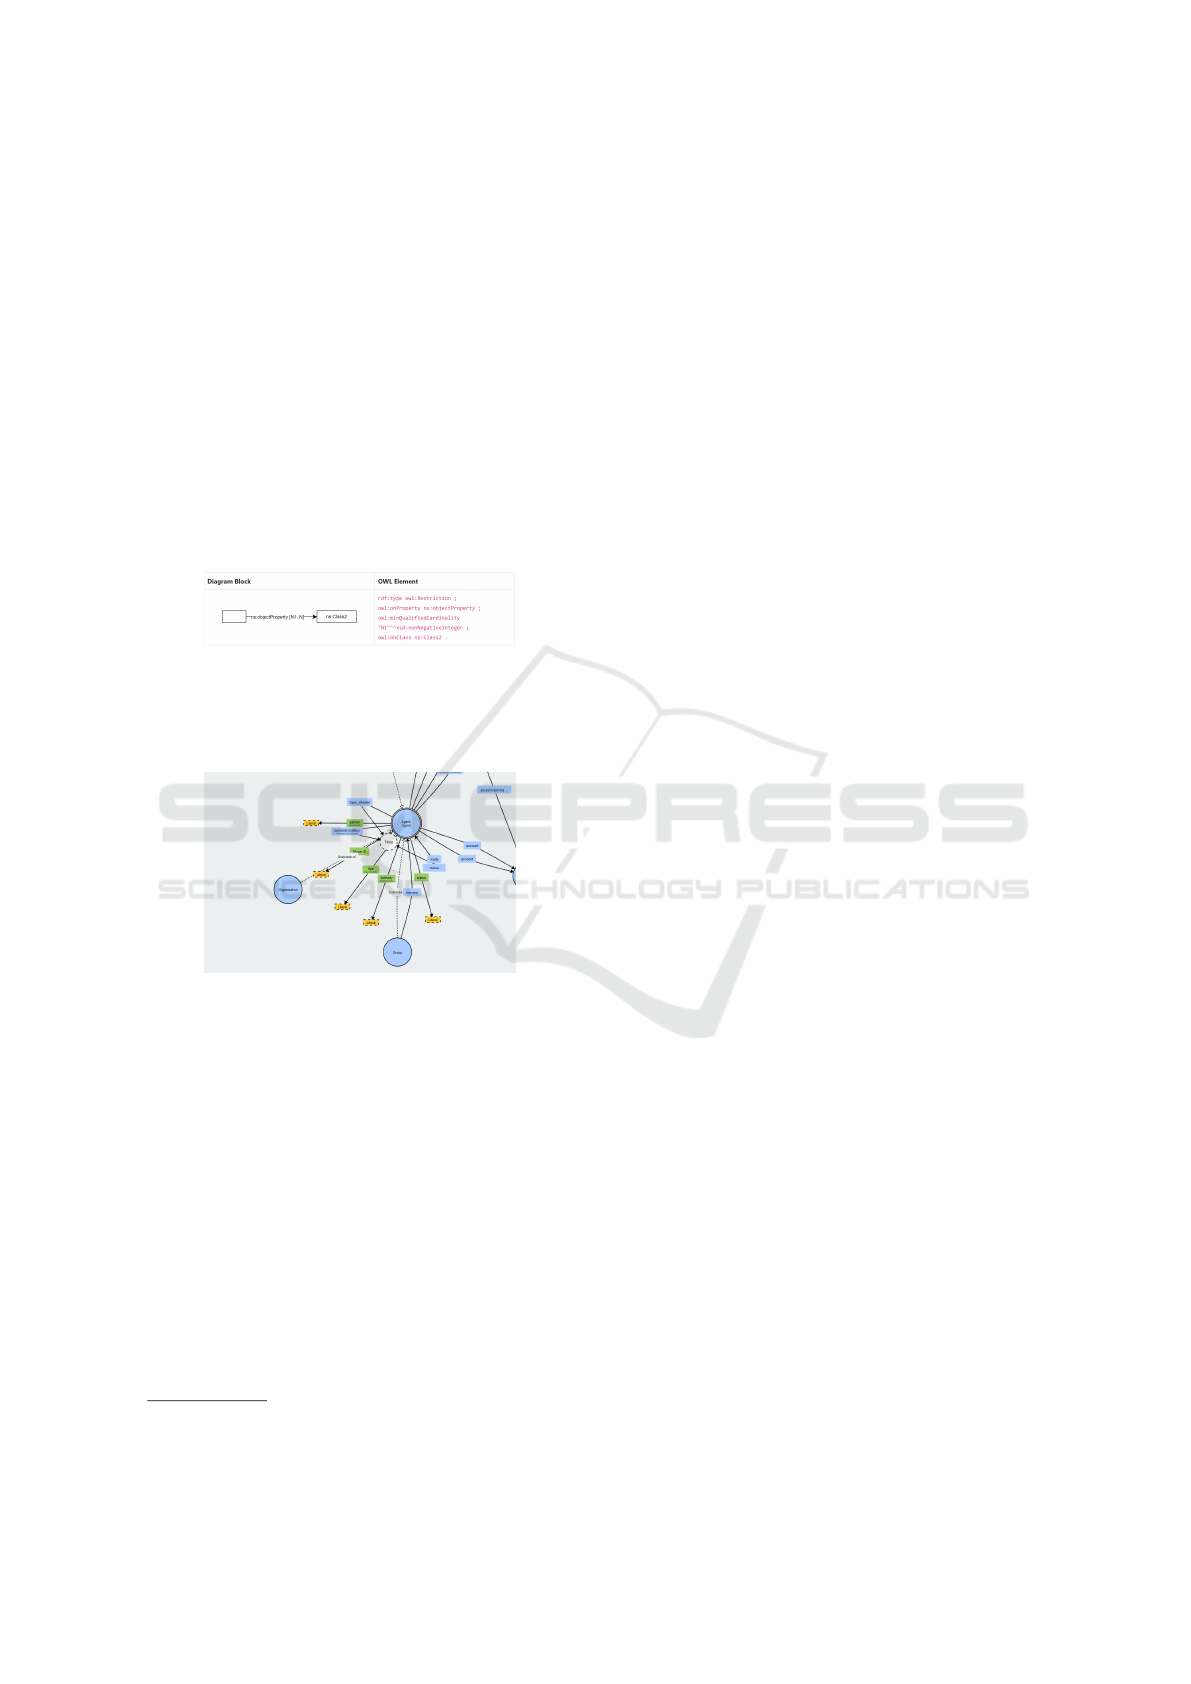
Figure 1: Example visualization for the semantic
OWL construct (owl:minQualifiedCardinality) adopted by
Chowlk. The image has been sourced from https : / /
chowlk.linkeddata.es/notation.html.
Figure 2: Example visualization for semantics OWL and
RDFs constructs adopted by WebVOWL. The image has
been sourced from https://service.tib.eu/webvowl/.
The lack of visualization tools capable of allow-
ing users to fully visually inspect the axiomatic and
taxonomic structures of vocabularies poses a signifi-
cant challenge. This problem is compounded by the
absence of a standardized method for visually repre-
senting OWL and RDFs constructs. Such limitations
create a substantial barrier for those working to de-
velop, refine, or simply understand the intricate rela-
tionships and rules within these semantic frameworks.
The ability to visually navigate these structures is cru-
cial for effective analysis and verification of ontologi-
cal consistency, which underpins many advanced data
processing and AI systems. Moreover, the gaps in vi-
sualization capabilities are particularly problematic in
3
accessible at: https : / / github.com / VisualDataWeb /
WebVOWL
light of the limitations of open-source reasoners, as it
will be further explained in the subsequent section.
3 REASONERS’ LIMITS
Reasoners are powerful tools used in the semantic
web to process and infer logical consequences from
a set of ontologies. Inference is the process by which
these tools deduce new knowledge from the facts al-
ready defined in the ontology. For example, if an on-
tology states that all mammals are warm-blooded and
that whales are mammals, a reasoner can infer that
whales are warm-blooded. This ability to derive new
facts extends the utility of ontologies, enabling more
complex queries and enhanced data interaction.
Contradictions occur when conflicting informa-
tion is deduced or entered into the ontology, such as
stating both that no birds are mammals and that some
birds are mammals. Effective reasoners are designed
to detect these contradictions, which are critical for
maintaining the integrity and reliability of data. How-
ever, detecting contradictions does not always happen
automatically. In complex ontologies where multiple
relationships and properties interact in subtle ways,
contradictions might be less apparent and can be over-
looked by reasoners, especially if the reasoner is not
fully compliant with all rules and nuances of the on-
tology language or is limited by performance con-
straints.
According to Gomez-Perez et al. (Gomez-Perez,
1994), (Gomez-Perez et al., 2001), (Gomez-Perez
et al., 1999) and Fahad et al. (Fahad et al., 2007), (Fa-
had and Qadir, na), inconsistencies and contradictions
in ontologies typically arise from three main types of
errors: Circluatory Errors, Partition Errors and Se-
mantic Inconsistency Errors. Circulatory Errors oc-
cur when a class or property is wrongly defined as
a subclass or superclass (or subproperty, superprop-
erty) of itself, creating a loop in the ontology’s hier-
archy. Partition Errors happen when an entity, such
as a class, property, or instance, is incorrectly clas-
sified under multiple disjoint categories, often dur-
ing the process of breaking down a concept into sub-
concepts or when dealing with exhaustive decompo-
sition where an external instance does not fit any de-
fined category. Lastly, Semantic Inconsistency Errors
arise from incorrect hierarchical classifications, such
as placing a concept as a subclass under an incompat-
ible superclass. This type of error usually stems from
three situations: subclasses representing a broader do-
main than their superclass (i.e. weaker domain spec-
ified by subclass error), subclasses introducing char-
acteristics that contradict their superclass’s traits (i.e.
Visualizing OWL and RDF: Advancing Ontology Representation for Enhanced Semantic Clarity and Communication
573

domain breach specified by subclass error), and sub-
classes being placed under a concept from a disjoint
domain (i.e disjoint domain specified by subclass er-
ror).
In 2008, Fahad et al (Fahad et al., 2008). con-
ducted a test which revealed that a number of reason-
ers were unable to detect partition errors and semantic
inconsistency errors. Recently, I replicated this exact
experiment using a selection of well-regarded reason-
ers to assess their current capabilities. Among these
were HermiT 1.4.3.456, known for its strict adher-
ence to OWL 2 DL ontologies, and Pellet 2.2, still
relevant for its extensive OWL 2 DL support. I also
tested Pellet Incremental to evaluate its efficacy in
dynamic environments where ontologies frequently
change, allowing for real-time updates without the
need for full reprocessing. Additionally, Elk, valued
for its speed in handling EL++ ontologies despite po-
tential stability issues, and FaCT++, recognized for its
performance albeit with installation challenges, were
included in the test. The ontology used was the same
as described by Fahad et al.(Fahad et al., 2008), and
the reasoners were operated within the Protege frame-
work. The following results were attained.
In the experiment replicating the tests originally
performed by Fahad et al.(Fahad et al., 2008), I found
that the current selection of reasoners still struggled
with detecting specific types of semantic inconsis-
tency errors. Notably, they failed to identify issues
such as weaker domain specified by subclass error.
For example, an error was not detected in a scenario
where ’Owner owns some PassengerVehicle’ was cre-
ated as a subclass of the concept ’Owner4Vehicle
owns exactly 4 PassengerVehicle’. Additionally, the
Domain Breach Specified by Subclass Error went un-
detected, such as in the case where ’OwnerManyVe-
hicle’, defined as owning more than 3 but less than 8
PassengerVehicles, was incorrectly subclassed under
’Owner of exactly 4 Vehicles’.
Moreover, the reasoners did not detect violations
of the OWL propertyDisjointWith vocabulary term,
which specifies that two properties should never relate
the same pair of resources. Instances where properties
supposedly disjoint still related the same entities were
overlooked by reasoners.
The experiment also revealed shortcomings in the
reasoners’ ability to infer new information based on
conceptual distances or hierarchies extending beyond
an arc distance of +10 from the initial concept. Fur-
thermore, Circulatory Errors, which lead to circular
reasoning and thus inconsistencies, were not recog-
nized by the reasoners. These results highlight per-
sistent gaps in the capabilities of ontology reasoners,
underscoring the need for ongoing improvements in
their algorithms to handle complex logical constructs
more effectively. Ultimately, these findings empha-
size that reasoners cannot solely be relied upon by
ontology engineers during the conceptualization pro-
cess or when assessing the consistency and efficiency
of their models. This underscores the necessity for
additional tools to aid in the development and verifi-
cation of ontologies. Visualization tools, in particular,
can offer substantial support in this regard, provided
there is a standardized and uniform way used to visu-
ally represent and refer to OWL and RDFS constructs.
By integrating such visualization tools, ontology en-
gineers can gain better insights into the structure and
interrelations within their ontologies, making it eas-
ier to spot inconsistencies and inefficiencies that rea-
soners might miss. This dual approach of using both
reasoners and visualization tools can significantly en-
hance the robustness and utility of semantic data mod-
eling.
Building on the identified limitations of ontology
reasoners and the potential of visualization tools to
enhance the conceptualization and validation process
in semantic data modeling, it becomes apparent that
integrating semiotics (i.e. the study of signs and sym-
bols and their use or interpretation) into ontology en-
gineering could provide further advantages. Just as
reasoners parse and interpret data based on logical
constructs, visualization tools can use semiotic prin-
ciples to encode and represent complex information,
making abstract concepts more accessible and inter-
pretable as it will be discussed in the next part.
4 THE SEMIOTICS OF
VISUALIZATION TOOLS
Semiotics, the study of signs and symbols and their
interpretation, serves as the foundational framework
of semantics, crucial for building the semantic web.
Signs encompass a variety of forms including words,
images, objects, and even smells, which acquire
meaning only when humans assign significance to
them. This field is heavily influenced by the theories
of Ferdinand de Saussure and Charles Sanders Peirce,
as highlighted by Vickers et al. (Vickers et al., 2013).
Saussure’s model explains a sign as consisting of a
signifier (the form the sign takes, such as a word or
sound) and the signified (the concept it represents).
For example, the sound pattern /cat/ signifies the ani-
mal cat. Conversely, Peirce’s model introduces a tri-
adic relationship involving the object (the entity being
represented), the representamen (the physical form of
the sign), and the interpretant (the understanding at-
tributed to the sign by observers).
DATA 2024 - 13th International Conference on Data Science, Technology and Applications
574

Applying these principles to ontology visualiza-
tion allows for the use of diverse signs to effectively
demonstrate how different ontologies are structured,
thereby enabling various types of structural analyses.
Each sign or symbol in a visualization could be delib-
erately designed to represent specific OWL and RDFS
vocabulary terms. This method not only standard-
izes visual representations but also assigns specific,
agreed-upon meanings to these signs. For example,
different shapes, colors, or icons might be used to de-
note classes, properties, subclasses, and other onto-
logical elements, transforming a visual diagram into
a readable, meaningful map of an ontology.
This semiotic encoding bridges the gap between
the complex data managed by reasoners and the hu-
man understanding necessary for efficient ontology
engineering. It allows engineers to quickly grasp the
ontology’s structure and logic, facilitating the identi-
fication of relationships, hierarchies, and potential in-
consistencies without needing to parse complex codes
or logical expressions. Ultimately, integrating the
computational power of reasoners with the intuitive
clarity of semiotically-enhanced visualization tools
enables ontology engineers to achieve a deeper, more
nuanced understanding of their data models.
The creation of a tool designed to visualize stan-
dardized symbols representing vocabulary terms of
OWL and RDFS would bring significant benefits to
the field of ontology engineering. Such a tool would
greatly enhance the clarity and accessibility of com-
plex ontological structures, making it easier for en-
gineers and stakeholders to grasp and interact with
the semantic layers underlying their data. Standard-
ized visual representations would facilitate quicker
and more accurate interpretation of relationships and
hierarchies within ontologies, reducing the cognitive
load on users and speeding up both the design and
troubleshooting processes. Additionally, by provid-
ing a universal language of visual symbols, this tool
would promote better communication and collabora-
tion across diverse teams and disciplines, ensuring
that ontologies are not only consistently understood
but also more effectively integrated into broader sys-
tems. This could lead to advancements in data inter-
operability and more seamless integration of seman-
tic web technologies across different platforms and
applications, ultimately driving innovation and effi-
ciency in the use and management of knowledge.
5 CONCLUSION
The integration of semiotic principles into ontology
visualization tools is not merely an enhancement but a
necessity. As the Semantic Web continues to grow in
both size and significance, the ability to effectively vi-
sualize ontological structures in a semantically mean-
ingful way becomes critical. Tools that can bridge the
gap between complex semantic structures and user-
friendly visual representations will play a pivotal role
in the advancement of knowledge engineering. This
endeavor not only supports the technical development
of ontologies but also facilitates a broader understand-
ing and adoption of semantic technologies across var-
ious sectors.
In this evolving landscape, the development and
standardization of visualization tools capable of ac-
curately representing OWL and RDFs constructs are
paramount. By creating systems that visually encode
ontology semantics, we enable more intuitive interac-
tions with data, enhance the capacity for insight, and
significantly improve the accuracy of ontology engi-
neering tasks. This approach not only aids ontology
engineers in managing the inherent complexities of
semantic frameworks but also empowers stakeholders
across different domains to engage with and leverage
the full potential of semantic technologies.
Moreover, these visualization tools serve as a crit-
ical complement to reasoners, addressing the cur-
rent limitations in detecting inconsistencies and in-
ferring new knowledge. By integrating robust visu-
alization technologies with advanced reasoning capa-
bilities, we can forge a more comprehensive toolkit
for ontology engineers, enhancing both the develop-
ment and application of ontologies within the digital
ecosystems.
Thus, as the advocacy for the advancement of se-
mantic web technologies continues, the focus must
also shift towards refining the tools that facilitate this
advancement. Establishing a standard for visual rep-
resentations of semantic data, paired with ongoing en-
hancements to reasoning technologies and visualiza-
tion tools, will not only address the current challenges
but also pave the way for future innovations in this
critical area of technology.
ACKNOWLEDGEMENTS
This research activity was conducted as part of the
Norm Engineering Program at TNO, funded by the
Dutch Ministry of the Interior and Kingdom Rela-
tions. I would also like to extend my gratitude to my
colleague Ioannis Tolios for his valuable feedback on
the paper.
Visualizing OWL and RDF: Advancing Ontology Representation for Enhanced Semantic Clarity and Communication
575

REFERENCES
Bernasconi, E., Ceriani, M., Di Pierro, D., Ferilli, S., and
Redavid, D. (2023). Linked data interfaces: A survey.
Information, 14(9):483.
Ch
´
avez-Feria, S., Garc
´
ıa-Castro, R., and Poveda-Villal
´
on,
M. (2022). Chowlk: From uml-based ontology con-
ceptualizations to owl. In Proceedings of the 19th Ex-
tended Semantic Web Conference (ESWC 2022), page
Conference specific pagination. Accessed: 2024-04-
18.
Commission, E. (2022). Moving towards a euro-
pean data space: New eu law for data-sharing.
https://data.europa.eu/en/news-events/news/moving-
towards - european - data - space - new - eu - law - data -
sharing. Last accessed 2024/04/18.
Corcho, O. and Simper, E. (2022). data.europa.eu and the
european common data spaces, a report on challenges
and opportunitie.
Dud
´
as, M., Lohmann, S., Sv
´
atek, V., and Pavlov, D. (2018).
Ontology visualization methods and tools: A survey
of the state of the art. The Knowledge Engineering
Review, 33.
Fahad, M., Qadir, M., and Noshairwan, W. (2007). Seman-
tic inconsistency errors in ontologies. In Proceedings
of the IEEE GRC 2007, pages 283–286, Silicon Val-
ley, USA. IEEE Computer Society.
Fahad, M. and Qadir, M. A. (n.a). A framework for ontol-
ogy evaluation. In Proceedings of the Workshop at
CEUR Workshop Proceedings, Mohammad Ali Jin-
nah University, Islamabad, Pakistan. CEUR Work-
shop Proceedings.
Fahad, M., Qadir, M. A., and Shah, S. (2008). Evaluation of
ontologies and dl reasoners. In Intelligent Information
Processing IV, volume 288, pages 17–27. Springer.
Gomez-Perez, A. (1994). Some ideas and examples to eval-
uate ontologies. Technical report, Knowledge Sys-
tems Laboratory, Stanford University, Stanford, CA.
Gomez-Perez, A. et al. (1999). Evaluation of taxonomic
knowledge on ontologies and knowledge-based sys-
tems. In Proceedings of the International Workshop
on Knowledge Acquisition, Modeling and Manage-
ment.
Gomez-Perez, A., Lopez, M., and Garcia, O. (2001). On-
tological Engineering: With Examples from the Areas
of Knowledge Management, E-Commerce and the Se-
mantic Web. Springer.
Lohmann, S., Haag, F., Ertl, T., and Negru, S. (2017). Visu-
alizing ontologies with vowl. Semantic Web Journal.
Accessed: 2024-04-18.
Skulmowski, A. and Xu, K. M. (2022). Understanding cog-
nitive load in digital and online learning: A new per-
spective on extraneous cognitive load. Educational
Psychology Review, 34:171–196.
Vickers, P. et al. (2013). Understanding visualization: A
formal approach using category theory and semiotics.
IEEE Transactions on Visualization and Computer
Graphics.
DATA 2024 - 13th International Conference on Data Science, Technology and Applications
576
