
Navigating the AI Timeline: From 1995 to Today
Vincenza Carchiolo
a
and Michele Malgeri
b
DIEEI - Universit
´
a degli Studi di Catania, Italy
Keywords:
Artificial Intelligence, Review, Data Analysis, NLP.
Abstract:
In recent years, the exponential growth of Artificial Intelligence (AI) has transcended disciplinary boundaries,
expanding into diverse fields beyond computer science. This study analyzes AI’s distribution across disciplines
using a large dataset of scientific publications. Contrary to expectations, substantial AI research extends into
medicine, engineering, social sciences, and humanities. This interdisciplinary presence heralds new possibil-
ities for collaborative innovation to tackle contemporary challenges. The analysis identifies emerging trends,
contributing to a deeper understanding of AI’s evolving role in society.
1 INTRODUCTION
Artificial intelligence (AI) has experienced an expo-
nential rise in recent years, both in terms of popularity
and societal impact. This is evident from the increase
in scientific output in the field, with a growing number
of publications, conferences, and initiatives dedicated
to AI.
However, within this rapidly evolving landscape,
an intriguing inquiry arises: how is AI research dis-
tributed across different disciplinary fields? Is it pri-
marily concentrated within the computer science do-
main, or has it diffused into other application areas?
This analysis aims to examine scientific output in
the field of AI with the goal of determining its distri-
bution across different disciplinary sectors. Through
the analysis of a large dataset of scientific publica-
tions, we will show that, contrary to what one might
assume, a substantial share of AI research does not
take place within the computer science field. Rather,
it is found in a variety of application areas, includ-
ing medicine, engineering, social sciences, and even
humanities.
This finding has important implications for our
understanding of AI and its potential impact on so-
ciety. It demonstrates that AI is no longer confined to
a narrow technical domain but is permeating a wide
range of disciplines and application areas. This opens
up new and exciting possibilities for interdisciplinary
collaboration and for the development of innovative
a
https://orcid.org/0000-0002-1671-840X
b
https://orcid.org/0000-0002-9279-3129
AI-based solutions that can address the most pressing
challenges of our time.
Furthermore, this analysis will allow us to iden-
tify emerging trends in AI research and to better un-
derstand the future directions of this rapidly evolv-
ing field. Ultimately, this research will contribute to a
more comprehensive understanding of AI and its role
in society.
While a comprehensive analysis of the entire lit-
erature encompassing AI is an insurmountable task,
we have chosen to utilize the Scopus database as the
foundation for our investigation. Scopus, managed
by Elsevier, stands as one of the world’s most com-
prehensive repositories of bibliographic and abstract
data within the scientific realm (Elsevier B.V., b) (El-
sevier B.V., a). Its extensive disciplinary coverage,
encompassing a broad spectrum of scientific fields,
including natural sciences, social sciences, medical
sciences, and engineering, aligns perfectly with our
objective of understanding AI’s impact across diverse
sectors. Furthermore, Scopus provides an array of an-
alytical tools that facilitate effective exploration of the
database in alignment with our research goals.
Scopus is therefore generalist in that it covers a
wide range of scientific disciplines, but there are some
more specialized or niche research areas that may not
be fully represented in its database. Scopus allows
us to query its database through various APIs. Sco-
pus contains approximately 82 million articles, and
searches can be conducted across different fields of
research.
In the literature, there are many examples of the
use of the Scopus database. For instance, in (H
ˆ
ancean
Carchiolo, V. and Malgeri, M.
Navigating the AI Timeline: From 1995 to Today.
DOI: 10.5220/0012856700003756
Paper published under CC license (CC BY-NC-ND 4.0)
In Proceedings of the 13th International Conference on Data Science, Technology and Applications (DATA 2024), pages 577-584
ISBN: 978-989-758-707-8; ISSN: 2184-285X
Proceedings Copyright © 2024 by SCITEPRESS – Science and Technology Publications, Lda.
577

et al., 2021) (De Stefano et al., 2011) (Carchiolo et al.,
2022a) some examples of generating co-authorship
networks are presented with the idea of represent-
ing the collaborations of the authors. In other cases
(Carchiolo et al., 2022b), (Bordons et al., 2015) (Car-
chiolo et al., 2023), the data extracted from Scopus
have been used to analyze the importance of certain
researchers or their performance in terms of specific
indices.
Our analysis, grounded in a robust dataset of sci-
entific publications, maps the distribution of AI re-
search across these diverse disciplines. The data
speaks volumes: AI is not just a tool but a collabo-
rator, opening doors to new realms of knowledge and
understanding.
Section 2 introduces how the dataset was con-
structed, while Section 3 presents the temporal anal-
ysis and thematic distribution of the publications, and
some results are discussed in detail. Section 4 pro-
vides an overview of some of the most cited articles.
We finally consider further works and concluding re-
marks in Section 5.
2 DATASET
The study of scientific output in the field of Arti-
ficial Intelligence (AI) holds immense significance,
given its prominence as a contemporary research fo-
cus that extends beyond the confines of computer sci-
ence. Researchers across diverse disciplines, even
those seemingly distant from computer science, are
increasingly exploring the potential of AI as a vi-
able solution for their respective fields of study. For
this study, to capture the subset of articles focusing
on Artificial Intelligence, a query against the Sco-
pus database was performed using the keyword field.
Instead of using only the keyword ”Artificial Intel-
ligence,” 18 different keywords were chosen, the ta-
ble 1 lists the 18 keywords used and the number of
articles selected for each. With this keyword selec-
tion, a total of 2, 156, 387 articles were selected, of
which 2, 081, 397, about 96.5% were written in En-
glish. This percentage remains relatively constant
over the years; for example, in 2023, it is approxi-
mately 97%.
The analysis of these documents, totaling
2,156,387, reveals that a very small fraction (a few
thousand) are incorrectly categorized and cover a
topic do not related to artificial intelligence that, typ-
ically, pertain to keywords such as ”Pattern Recogni-
tion,” ”Reinforcement Learning,” ”Optimization Al-
gorithms,” and ”Data Analysis”. However, given the
small percentage, they cannot bias our analysis. Some
Table 1: Keywords in Artificial Intelligence.
Keyword Document number
Artificial Intelligence 460 755
Machine Learning 455 294
Deep Learning 348 589
Data Analysis 272 258
Pattern Recognition 227 417
Convolutional Neural Networks 182 998
Computer Vision 180 619
Artificial Neural Networks 154 046
Natural Language Processing 108 584
Optimization Algorithms 80 415
Reinforcement Learning 77 935
Expert Systems 56 364
Supervised Learning 45 794
Recurrent Neural Networks 43 456
Machine Learning Algorithms 17 022
Unsupervised Learning 14 376
Artificial Intelligence Applications 950
Cognitive Robotics 796
of the documents are quite old, dating back further
than expected (see Figure 1.(a)) It should not be sur-
prising to find articles from the early 1950s, as the
term ”AI” was coined by John McCarthy in 1955 dur-
ing a conference at Dartmouth College. McCarthy
and other scholars laid the groundwork for a new
research field aimed at developing machines capa-
ble of learning, reasoning, and problem-solving au-
tonomously. However, traces of AI-related concepts
can be found even before 1955 in the writings of Alan
Turing, Marvin Minsky, who founded the MIT Arti-
ficial Intelligence Laboratory in 1951, one of the pio-
neering research centers in AI, and Arthur Samuel,
who in 1959 developed the ”Gameplay” program,
considered one of the earliest examples of artificial
intelligence applied to a game, specifically checkers.
Nevertheless, in recent decades, due to technologi-
cal advancements, the availability of large amounts
of data, and improvements in algorithms, AI has ex-
perienced a resurgence and has begun to influence an
increasing number of societal sectors.
The initial analyses presented in this paper aimed
to delineate the sectors to which the publications
could be attributed. Scopus organizes its database by
assigning a ”Subject Area” to each publication based
on the publication venue. As depicted in Figure 1.(b),
it is evident that slightly over 50% of the publications
are categorized under Computer Science, a proportion
that has varied between 45% and 60% over the years.
This observation underscores the dominant presence
of Computer Science within the dataset.
Furthermore, we conducted an analysis of the
”Subject Areas” in which Scopus classifies docu-
ments, the table 2 lists all the ”Subject Areas” present
in Scopus, along with the number of publications se-
lected by us attributed to each area. In our case, the
documents are divided into Computer Science and
Engineering for more than 80% of the cases. More-
over, it can be appreciated that the most relevant ap-
plication fields in table 2
DATA 2024 - 13th International Conference on Data Science, Technology and Applications
578
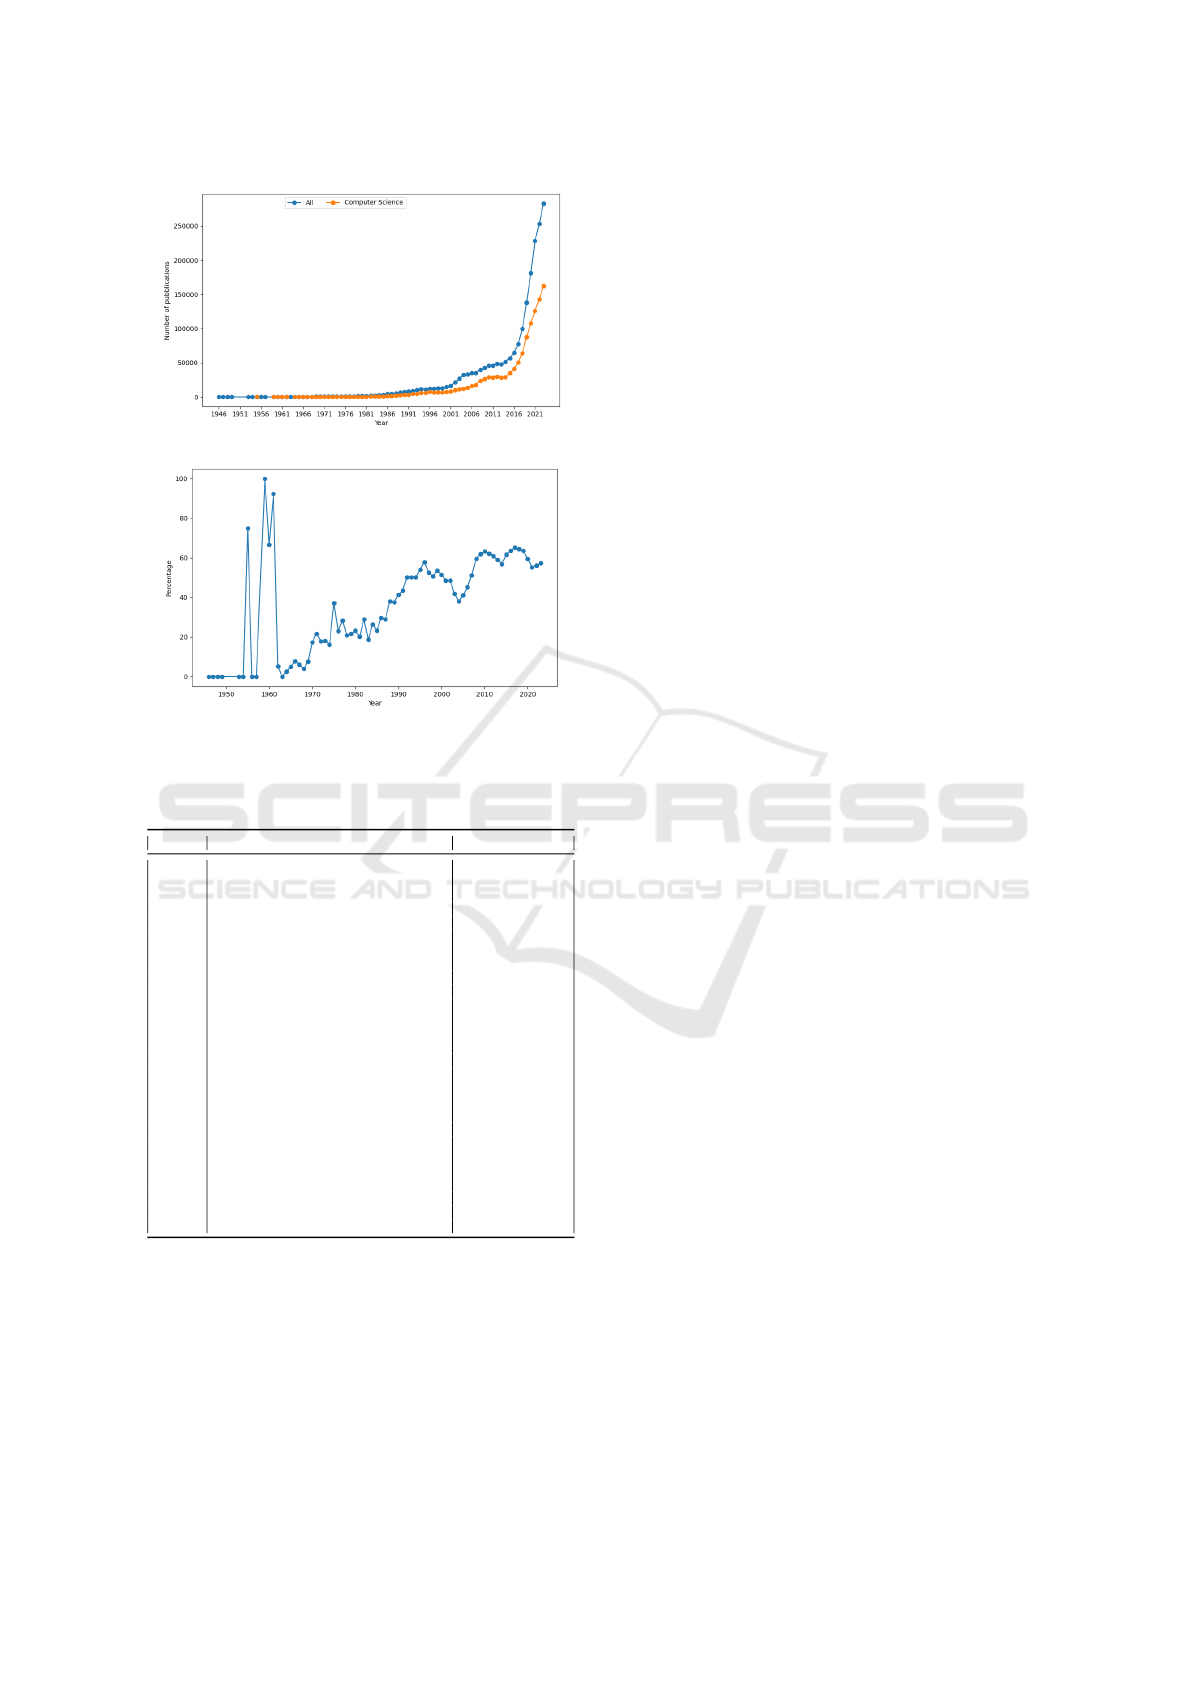
(a) Growth in publications over time.
(b) CS publications relative to all publications.
Figure 1: Total and Computer Science document analysis.
Table 2: Subject Area and Document Number.
Ref. Subject Area Document Number
CS Computer Science 1 213 347
ENG Engineering 720 705
MAT Mathematics 413 249
MED Medicine 335 620
PA Physics and Astronomy 194 224
BGMB Biochemistry Genetics and Molecular Biology 145 330
MS Materials Science 123 975
DS Decision Sciences 114 903
SS Social Sciences 110 184
NS Neuroscience 87 705
EN Energy 82 665
EPS Earth and Planetary Sciences 80 569
ES Environmental Science 76 425
CHM Chemistry 61 793
ABS Agricultural and Biological Sciences 49 042
AH Arts and Humanities 45 293
CHE Chemical Engineering 43 689
PSY Psychology 41 260
BMA Business Management and Accounting 40 372
HP Health Professions 32 916
MUL Multidisciplinary 31 149
PTP Pharmacology Toxicology and Pharmaceutics 30 093
IM Immunology and Microbiology 26 421
NUR Nursing 14 553
EEF Economics Econometrics and Finance 12 689
VET Veterinary 3 607
DNT Dentistry 3 110
Finally, we investigated the affiliations of the doc-
uments, which originate from various countries; how-
ever, the predominant affiliations are located in China
and the USA. Among the top 60 affiliations, signifi-
cant presence is observed from France, Canada, Sin-
gapore, the UK, Bangladesh, Japan, Germany, India,
Switzerland, Australia, Hong Kong, Italy, Belgium,
and Brazil.
3 AI PUBLICATIONS TRENDS
The choice to focus the analysis of publications start-
ing from 1995 in the present study is motivated by
several crucial considerations to ensure the validity
and relevance of our conclusions within the current
research context. Firstly, it is important to note that
the data obtained from Scopus for the years 1950-
1995 are significantly limited in our field of investi-
gation. This limited availability of information can be
attributed to various factors, including technological
and methodological constraints of the time, as well
as the reduced use of bibliometric and citation sys-
tems. Secondly, we consider the dynamic evolution
of our research field over the years. There has been a
growing consensus regarding the increasing relevance
of recent publications in reflecting the current state of
knowledge and developments in the field. Therefore,
recent (in our case, around 30 years) publications pro-
vide a more precise and updated picture of the current
scientific landscape. Additionally, it is worth men-
tioning that significant trends and advancements in
our field have occurred primarily during the last few
decades, making publications after 1995 particularly
relevant for our analysis. Finally, our decision is also
motivated by the need to maintain consistency with
contemporary research practices and to provide re-
sults that are fully aligned with the current scientific
context, thus offering significant contributions to aca-
demic literature.
3.1 Number of Publications per Year
As a first analysis, a cumulative analysis of publica-
tions over the years was chosen, which naturally re-
veals a consistent growth in the number of scientific
articles in the field of artificial intelligence. Examin-
ing the temporal growth of publications, a clear pos-
itive trend emerges over the years, indicative of an
increasingly intense and continuous research activity.
This approach also allows for the evaluation of long-
term trends, revealing a steady increase in the number
of publications year after year. Moreover, such anal-
ysis enables the identification of significant turning
points in the growth rate, suggesting moments when
research activity has undergone important changes or
developments. These turning points can be indicative
of innovations in the field, changes in research trends,
or significant events that have influenced academic in-
terest. Figure 2 shows the cumulative trend over the
years from 1995 to 2023. It can be readily observed
that around 2010, there is a knee in the curve, indi-
cating a sudden growth in the number of publications.
This year is widely recognized as a pivotal year in the
Navigating the AI Timeline: From 1995 to Today
579
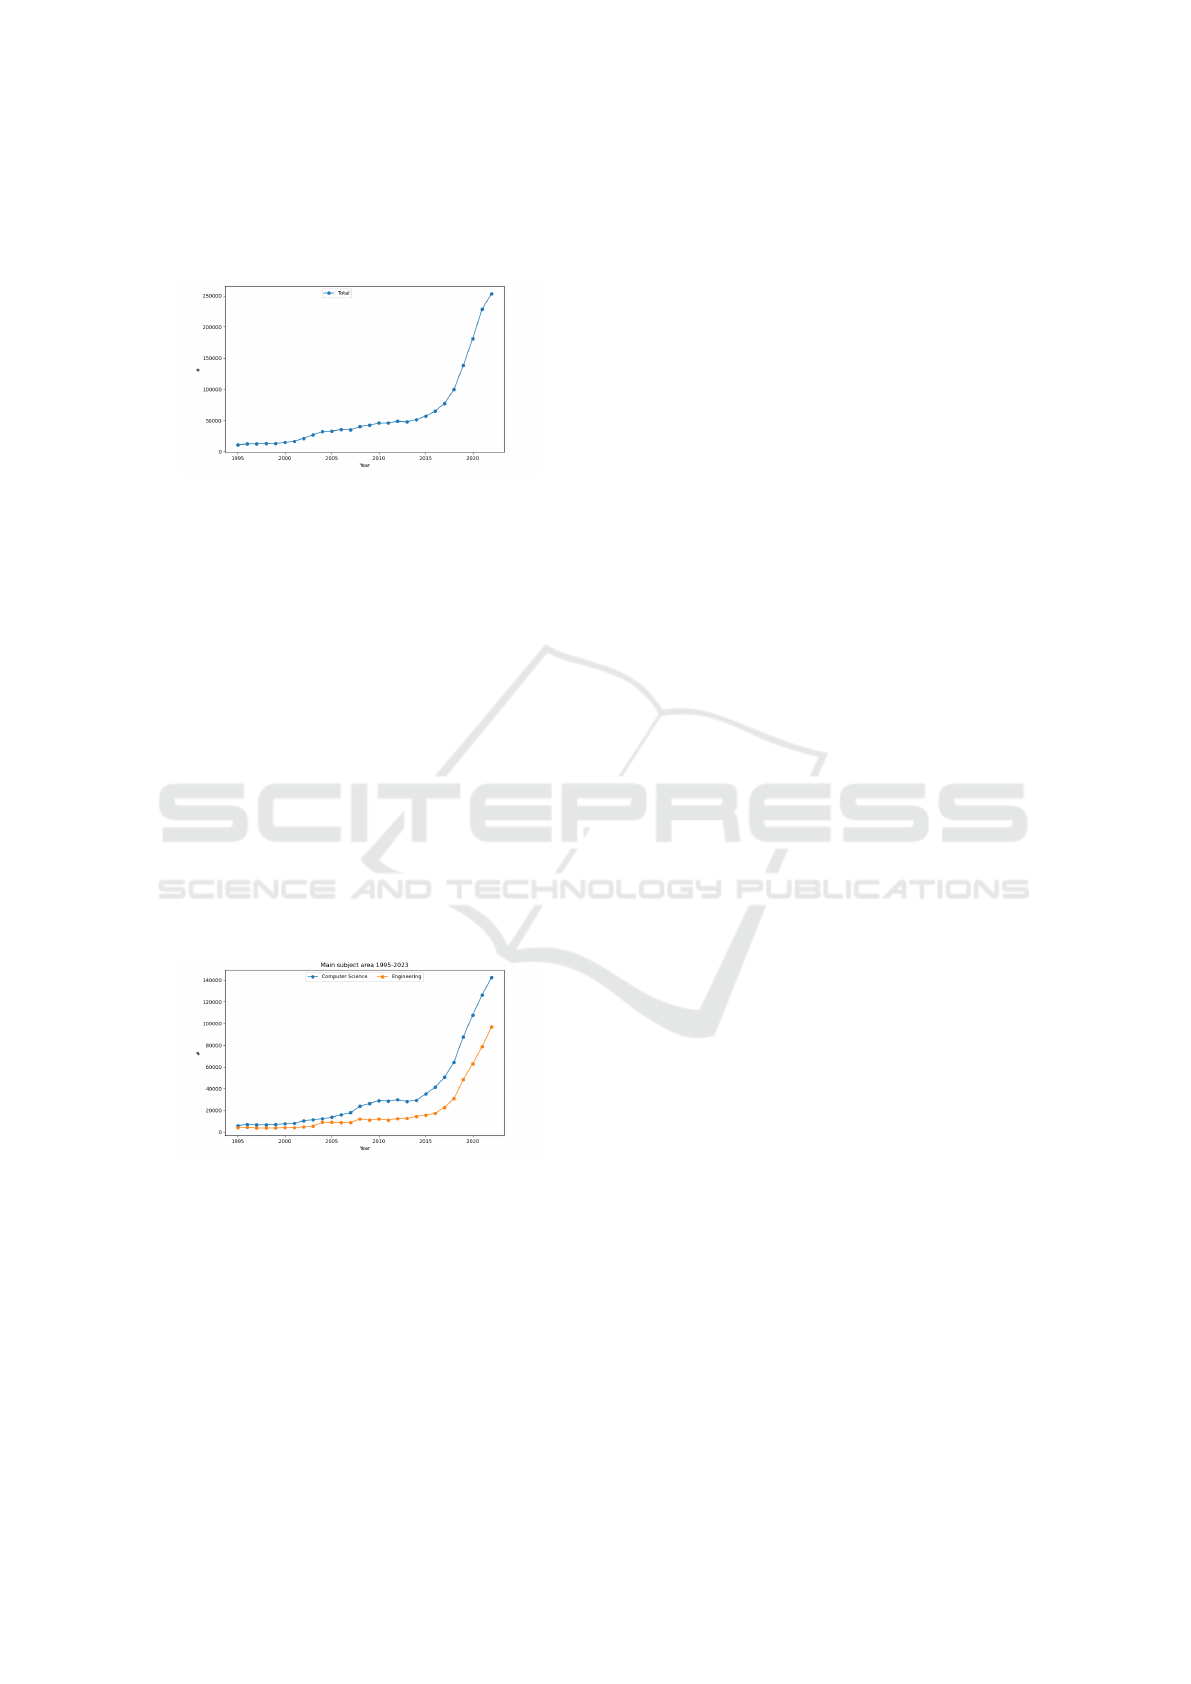
field of artificial intelligence (AI) for a number of cru-
cial reasons, such as, there were significant advance-
ments in deep learning.
Figure 2: Cumulative trend of publications from 1995 to
2023.
3.2 Subject Areas by Year
In this section, we present the evolution of Subject
Area from 1995 to 2023. As previously indicated,
Scopus assigns a Subject Area to each publication
based on its publication venue and the topic it cov-
ers within that source. Based on this analysis, it can
be observed (see Figure 3) that the majority of publi-
cations fall within the fields of Computer Science or
Engineering, with Computer Science being the pre-
dominant subject area.
As illustrated in Figure 4, Computer Science and
Engineering emerge as the two primary Subject Ar-
eas, exhibiting a parallel growth pattern. This pat-
tern suggests a close relationship between these two
fields, with advancements in Computer Science often
preceding similar developments in Engineering.
Figure 4: Trend of Computer Science & Engineering Sub-
ject Area.
To delve into the trends beyond the two dominant
Subject Areas of Computer Science and Engineer-
ing, Figure 5 presents an overview of the remaining
Subject Areas. This visualization aims to highlight
the diverse patterns and trajectories observed across
a broader range of disciplines. As evident, the Sub-
ject Areas beyond Computer Science and Engineer-
ing exhibit a more nuanced growth pattern. While
some Subject Areas, display a more gradual or even
plateauing growth trajectory. These observations un-
derscore the multifaceted nature of AI research and its
impact across a diverse spectrum of academic fields.
To further elucidate the distinct growth patterns
observed, we present the trend of subject areas group-
ing them in smaller sets in order to enhance the
specific behaviours that are hidden in global fig-
ure, therefore figure 6 presents the trends for the
Subject Areas immediately following the two dom-
inant fields (Mathematics Physics and Astronomy,
Medicine, Biochemistry, Genetics, and Molecular Bi-
ology) and figure 7 delves into the trends of the next
four prominent Subject Areas, Materials Science, De-
cision Sciences, Social Sciences, and Neuroscience.
As depicted in Figure 6, Mathematics displays
a growth pattern akin to the top two Subject Ar-
eas. Conversely, Physics and Astronomy, as well
as Biochemistry, Genetics, and Molecular Biology,
exhibit a delayed onset of growth. Furthermore,
Medicine initiates its upward trajectory with a slope
comparable to Computer Science around 2013, while
Physics and Astronomy and Biochemistry, Genetics,
and Molecular Biology follow suit around 2015. In-
triguingly, both Medicine and Biochemistry, Genet-
ics, and Molecular Biology encounter a deceleration
in their growth rates from 2021 onward.
Figure 7 delves into the trends of the next four
prominent Subject Areas: Materials Science, Deci-
sion Sciences, Social Sciences, and Neuroscience.
This visualization sheds light on the evolving dynam-
ics of these emerging fields within the AI landscape.
Interestingly, Decision Sciences stands out as an ex-
ceptional case, exhibiting a surge in growth starting
from 2018. This upward trajectory suggests a grow-
ing recognition of the potential of AI in decision-
making processes across various domains. In con-
trast, Neuroscience, which initially followed a simi-
lar growth pattern to the other Subject Areas, experi-
enced a stagnation in its growth from 2018 onwards.
This observation may warrant further investigation to
understand the underlying factors contributing to this
trend.
3.3 Geographical Landscape of AI
Research
In the dynamic landscape of Artificial Intelligence
(AI), analyzing the number of publications by country
per year between 1995 and 2023 serves as a valuable
lens through which to observe global research trends
in this revolutionary field. Understanding the geo-
graphical distribution of scientific output in AI goes
beyond mere mapping. It’s a deep exploration that
enables us to assess the impact of AI in different con-
DATA 2024 - 13th International Conference on Data Science, Technology and Applications
580
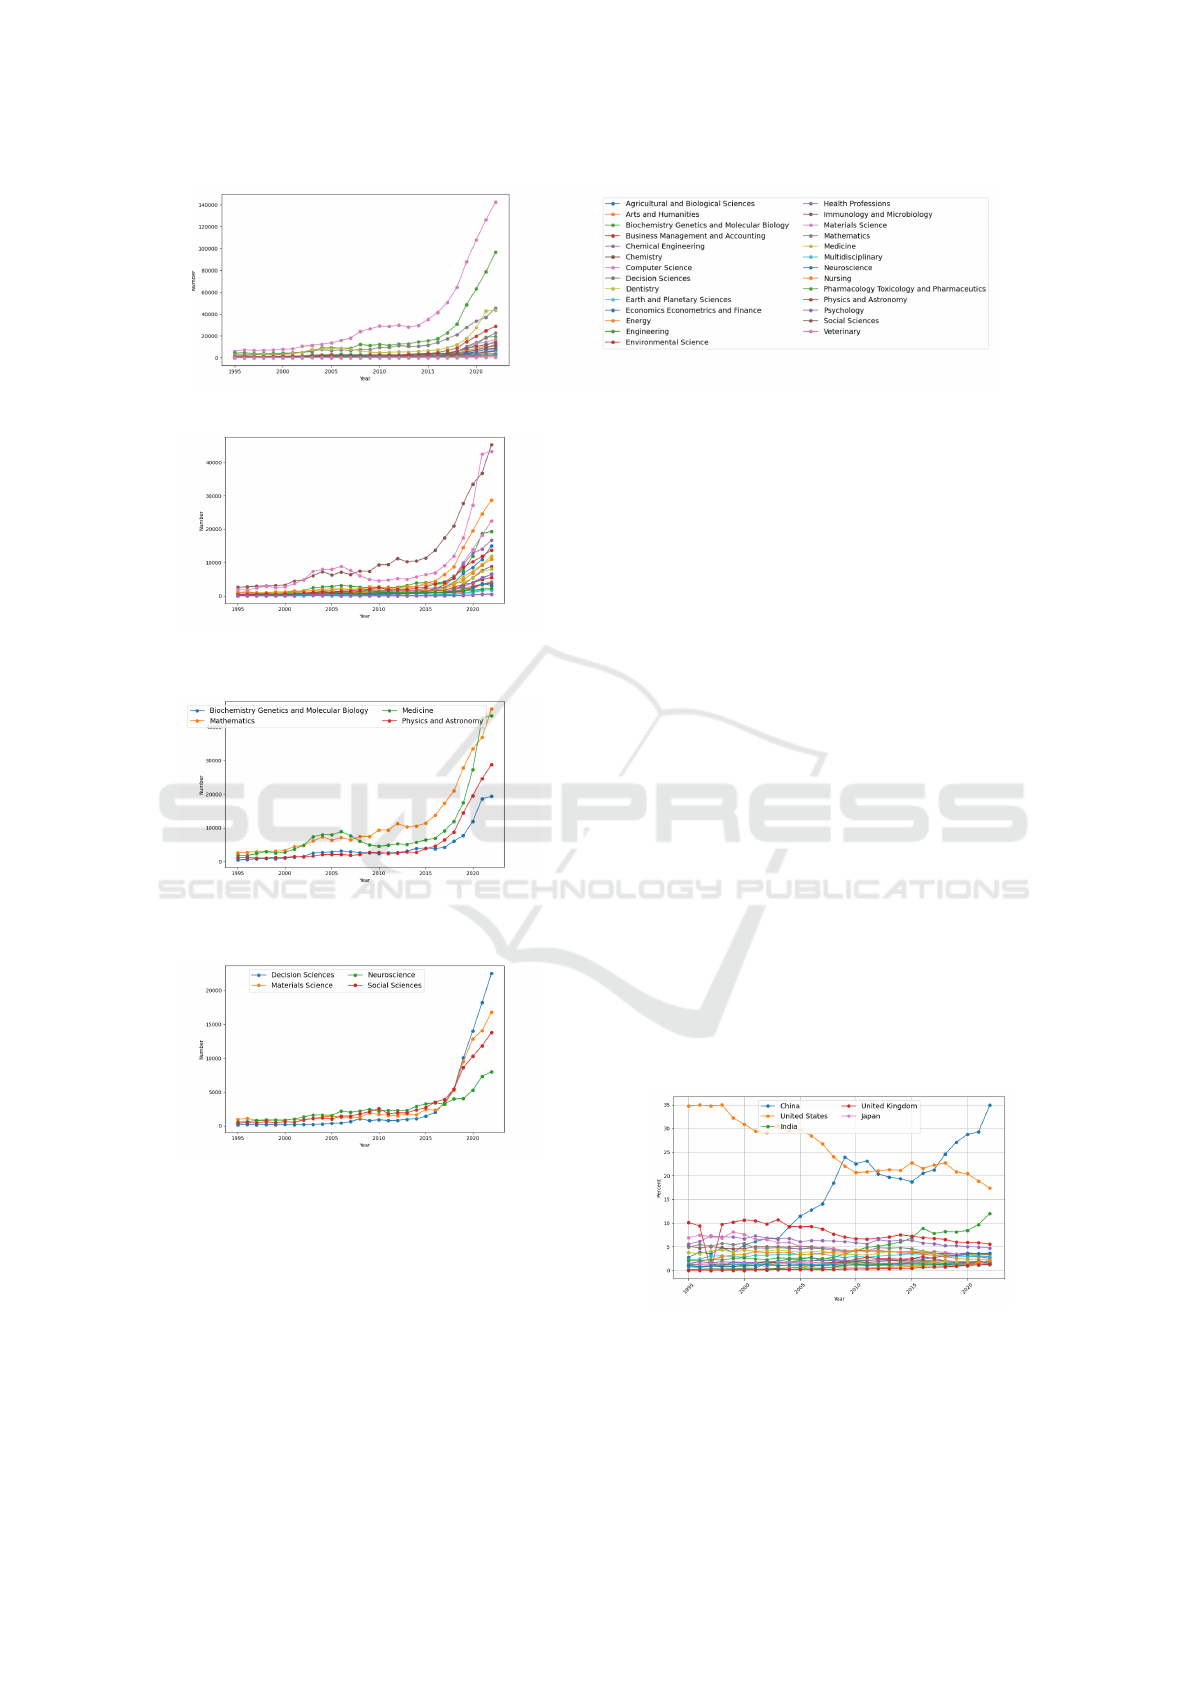
Figure 3: Trend of Subject Area from 1995 to 2023.
Figure 5: Trend of Subject Areas excluding dominant ones
from 1995-2023.
Figure 6: Trend of Mathematics Physics and Astronomy,
Medicine, Biochemistry, Genetics, and Molecular Biology.
Figure 7: Trend of Materials Science, Decision Sciences,
Social Sciences, and Neuroscience Subject.
texts, uncovering how this technology is shaping and
influencing various societies and cultures worldwide.
Through this analysis, centers of excellence in AI re-
search become clear, acting as strategic benchmarks
for international collaboration and attracting top tal-
ent in the field. The data gathered serves as a compass
to guide national and international policies and strate-
gic decisions, allowing for effective resource alloca-
tion and the development of targeted strategies to pro-
mote AI adoption in every context. Furthermore, an-
alyzing the number of publications by country proves
to be a powerful tool for monitoring the progress of AI
research over time. It offers a tangible assessment of
this technology’s impact on society and allows for the
identification of new trends and emerging research ar-
eas that will shape the future of AI. In doing so, for the
sake of simplicity and efficiency, we narrowed down
the analysis to the top 24 countries. This approach
streamlines the data collection and analysis process,
optimizing computational resources and expediting
the study’s completion. While this decision excludes
other countries, it does not diminish the significance
of their AI research endeavors. Complementary stud-
ies could be conducted to delve into the research dy-
namics of nations with lower levels of AI scientific
output. Ultimately, the choice to focus on the 24 top
AI-publishing countries represents a strategic balance
between comprehensiveness and feasibility, yielding
a focused and in-depth perspective on research trends
and patterns within the global epicenters of this trans-
formative field.
Figure 8 illustrates the percentage distribution of
publications across the years under consideration, re-
vealing that China and the USA collectively account
for nearly 50% of the publications. Specifically,
the USA’s contribution peaks at 35% in 1995, while
China reaches the same percentage in 2023.
Figure 8: Percentage of Publications by Country.
To better appreciate the trend for each of the coun-
tries, a cumulative trend analysis was conducted, dis-
playing subsets of selected states for similarities in
subsequent figures. Figure 9a shows the trend for the
Navigating the AI Timeline: From 1995 to Today
581
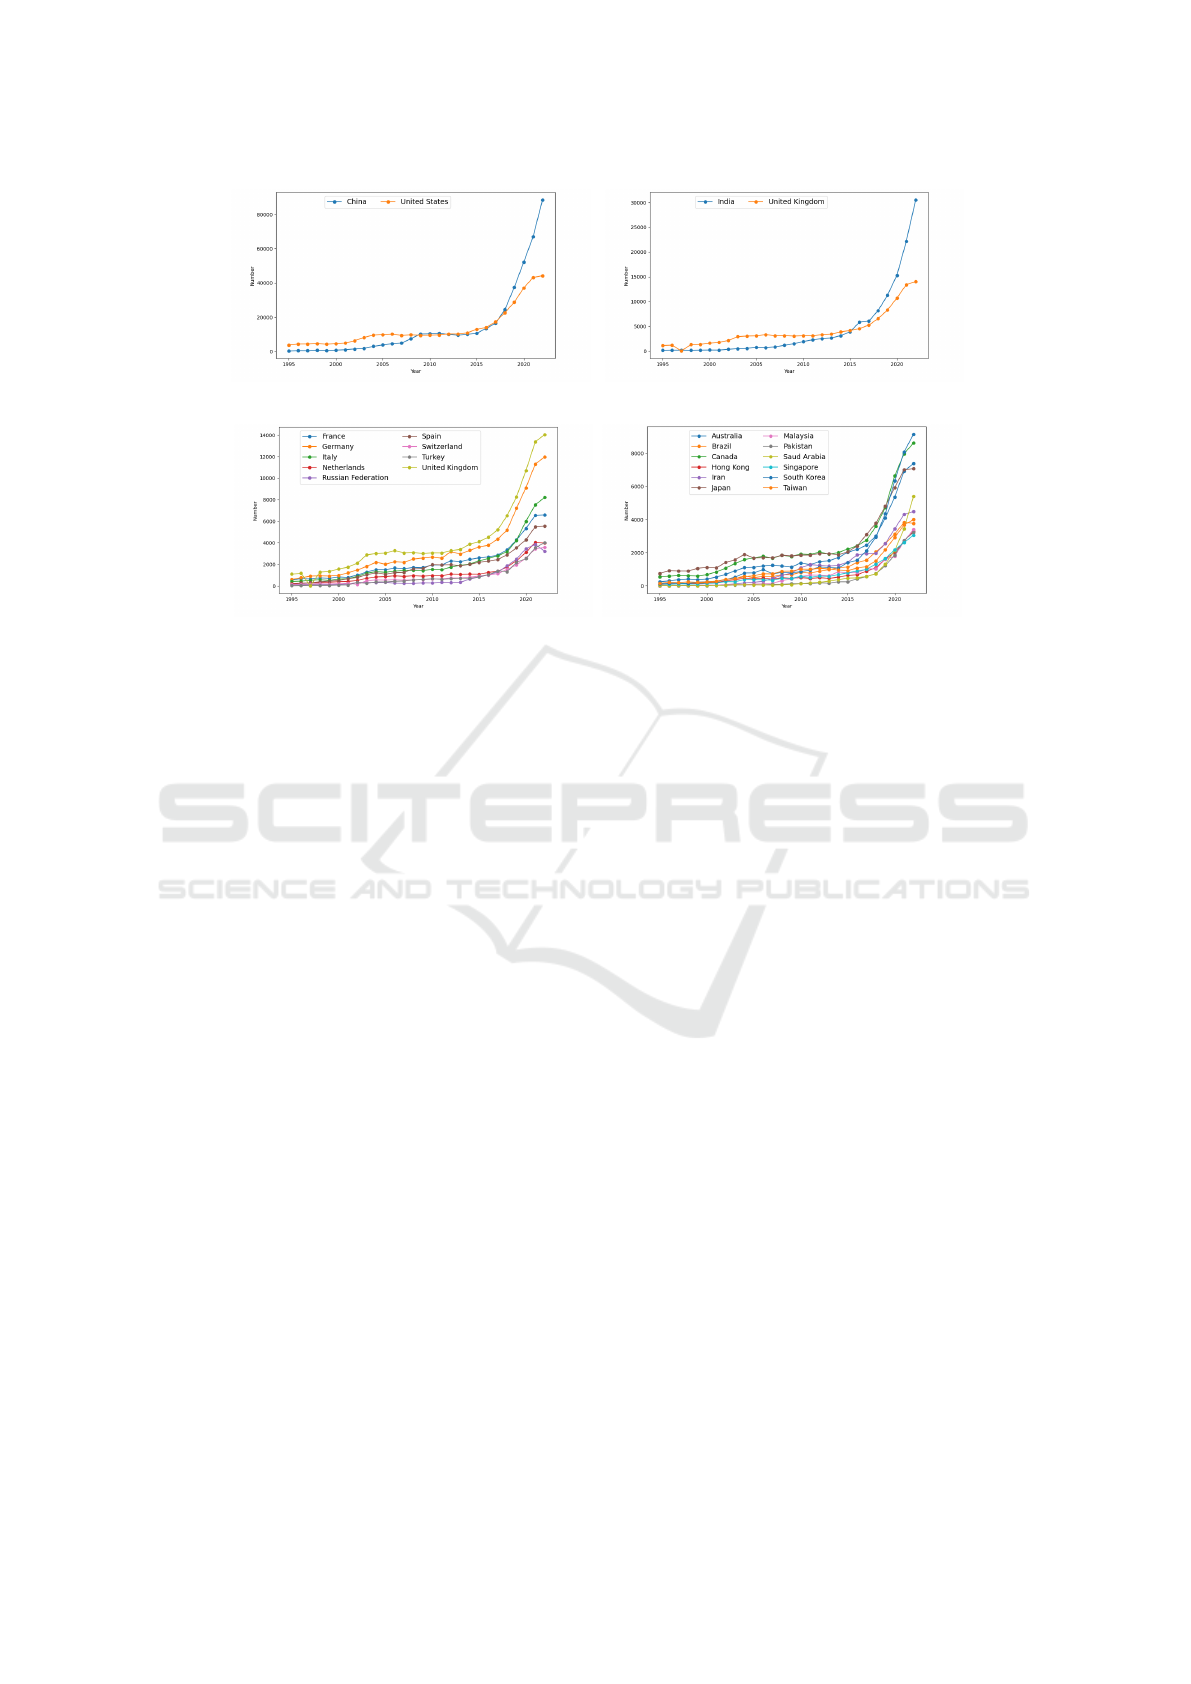
(a) China and USA (b) India and UK
(c) Europe (d) Other States
Figure 9: Cumulative growth of publications.
USA and China, which are the states with the highest
number of publications. Figure 9b shows the trends
for India and the UK, while figure 9c shows some of
the European states. Finally, figure 9d displays the
trends for the other states.
3.4 Keywords Analysis
The analysis of keywords in research articles on Arti-
ficial Intelligence (AI) from 1995 to 2023 represents a
wealth of information for understanding global trends
in this constantly evolving field. By examining the
most frequent keywords in articles, we can identify
the most popular themes and research areas within the
field of AI during a specific period. This allows us
to track the evolution of research interests over time
and identify emerging trends. Keywords, that are usu-
ally inserted by authors, can also provide insights into
the methodological approach used by researchers. For
example, the presence of statistical terms may indi-
cate the use of data-driven models, while keywords
related to machine learning may suggest the use of
machine learning algorithms. By examining the most
frequent keywords in strategic years, we can iden-
tify dominant themes, prevalent methodological ap-
proaches, and the impact of AI across various spheres
of society. This approach offers several advantages,
including the ability to highlight long-term trends, re-
duce complexity, and optimize resources.
To do this, the years 2010, 2015, 2020, 2021,
2022, and 2023 were selected, all following the rapid
growth of AI on the international scene. For each
year, the top 160 most recurring keywords were ex-
tracted. Before conducting any analysis, the list of ex-
tracted keywords was processed using some Natural
Language Processing techniques (NLP) (Cambria and
White, 2014) to eliminate keywords that lexically ex-
press the same concept. To perform the filtering from
this list of keywords after transforming all strings to
lowercase, the following steps were carried out:
1. Synonym Identification: WordNet (Pedersen
et al., 2004), a lexical database of English words,
was used to identify synonyms for each keyword.
WordNet provides relationships between words,
including synonyms, antonyms, hyponyms (more
specific words), and hypernyms (more general
words).
2. Acronym Expansion: Using an acronym dictio-
nary, the acronyms and abbreviations found in the
list of keywords were expanded.
3. Similarity Calculation: For each keyword, co-
sine similarity with its potential synonyms or
acronym expansions was calculated (Wang and
Dong, 2020). A removal threshold of 0.8 was cho-
sen.
These operations allowed for the calculation of the
overall occurrence count of each keyword in a given
year, shown in Table 3, thus enabling the determina-
tion of the top 10 most recurring keywords for each
of the years.
To comprehend the trends of interest in specific ar-
eas of artificial intelligence, we elected to investigate
the top 15 keywords appearing across approximately
DATA 2024 - 13th International Conference on Data Science, Technology and Applications
582
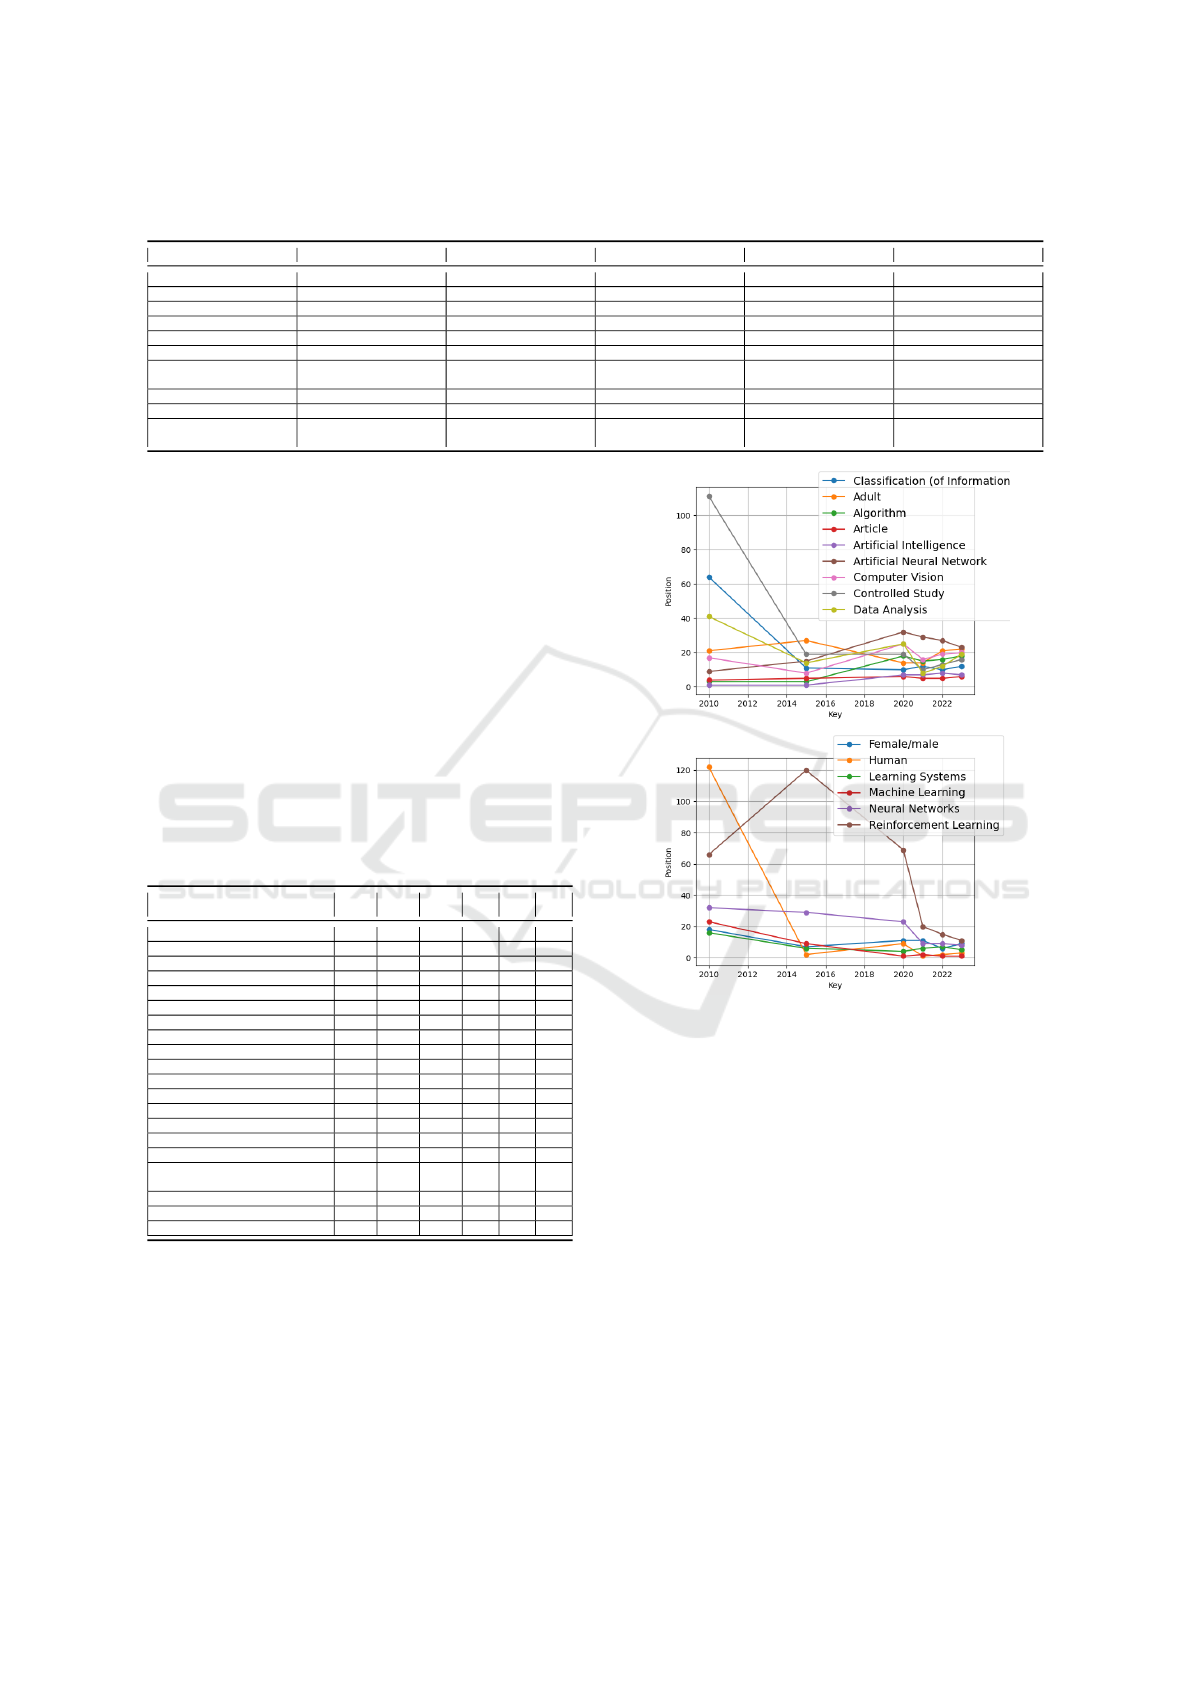
Table 3: First 10 keyword for year, where AI, ML, CNN, NLP stands for Artificial Intelligence, Machine Learning, Convolu-
tional neural networks, Natural Language Processing respectively.
2015 2010 2020 2021 2022 2023
AI AI ML Human ML ML
Genetic Algorithm Human Decision Tree ML Human Deep Learning
Algorithm Algorithm CNN CNN CNN Human
Article Pattern Recognition Learning Systems Deep Learning Deep Learning CNN
Pattern Recognition Article Genetics Learning systems Article Learning systems
Computer Science Learning Systems Article AI Female/Male Article
NLP Female/Male AI Data Analysis Magnetic resonance
imaging
AI
Feature Extraction Computer Vision Feature Extraction Neural Networks AI Neural Networks
Artificial Neural Network ML Human Controlled study Neural Network Female/Male
Controllers Multilayer Neural
Networks
Classification Female/Male Classification Features Extraction
2 million publications on the subject, selected inde-
pendently of the year (this procedure was conducted
after filtering). Table 4 presents the top keywords and
their respective ranks in each year, while Figure 10
depicts the ranking trend of the top 15 keywords. To
facilitate the reader, the figure 10 is divided into two
parts, in each of which the change of keywords rank-
ing over the years can be observed. It can be noted
that the keywords ”Controlled Study” and ”Human,”
absent in the early years, have achieved high rankings
(it is worth noting that a low position value indicates a
high ranking), as well as ”Neural Networks” and ”Re-
inforcement Learning”. On the contrary, some key-
words as ”Artificial intelligence” and ”Artificial Neu-
ral Network” have lost positions in the ranking.
Table 4: Main keyword and their ranking (first 160) in each
year.
2010
2015
2020
2021
2022
2023
Adult 21 27 14 14 21 22
Algorithm 3 3 18 15 16 18
Article 4 5 6 5 5 6
Artificial Intelligence 1 1 7 7 8 7
Artificial Neural Network 9 15 32 29 27 23
Classification 64 11 10 12 10 12
Computer Vision 17 8 25 16 19 20
Controlled Study 111 19 19 10 13 16
Convolutional Neural Network - 47 3 3 3 4
Data Analysis 41 14 24 8 12 19
Deep Learning - 79 51 4 4 2
Female/male 18 7 11 11 6 9
Forecasting - 30 121 20 17 15
Human 122 2 9 1 2 3
Learning Systems 16 6 4 6 7 5
Machine Learning 23 9 1 2 1 1
Natural Language Processing
Systems
8 - 21 23 18 13
Neural Networks 32 29 23 9 9 8
Pattern Recognition 5 4 - - - -
Reinforcement Learning6 66 120 69 20 15 11
4 HIGHLY CITED PAPER
In this brief section, we aim to demonstrate that nu-
merous articles of great interest have been published
during the period under consideration.
In particular, we would like to highlight some of
Figure 10: Trend of the top 15 keywords.
the most cited articles by listing them in chronological
order.
Among the 200 most cited articles in our dataset,
the most cited article from 1995 (the first year of our
analysis) is (Cortes and Vapnik, 1995). The main top-
ics addressed in this article are the use of neural net-
works, particularly in the field of pattern recognition,
which is one of the most common fields of application
and on which researchers have focused their efforts
in the field of AI. The most recent of the 200 most
cited is (Jumper et al., 2021). The article presents a
protein structure prediction approach based on deep
learning and this shows how techniques have evolved
and how the fields of application of greatest interest
have changed
Finally, the two most cited articles with over
100,000 citations are (He et al., 2016) and (Livak and
Navigating the AI Timeline: From 1995 to Today
583

Schmittgen, 2001). In (He et al., 2016) aims to ad-
dress the challenges of training very deep neural net-
works and it propose a new framework called resid-
ual learning which makes it easier to train deeper net-
works compared to previous methods. (Livak and
Schmittgen, 2001) falls within the field of molec-
ular biology, with a specific focus on genetics and
deals with the analysis of data obtained from real-time
quantitative PCR (qPCR) experiments. These two ar-
ticles further demonstrate that the trend in fields of
application is increasingly shifting from computer vi-
sion to applications in the field of genetics.
5 CONCLUSION
The authors emphasize the value of examining re-
views from previous years to gain a comprehensive
understanding of the AI landscape. This longitudi-
nal approach can reveal trends, patterns, and semi-
nal contributions that might be missed by focusing
solely on recent publications. The analysis has high-
lighted some peculiarities of publications in the AI
field. Nevertheless, this analysis is still in its early
stages. This could involve identifying emerging key-
words, tracking changes in keyword usage over time,
and exploring the relationships between different key-
words.
ACKNOWLEDGEMENTS
The work is partially supported by UDMA project,
CUP: G69J18001040007.
REFERENCES
Bordons, M., Aparicio, J., Gonz
´
alez-Albo, B., and D
´
ıaz-
Faes, A. A. (2015). The relationship between the re-
search performance of scientists and their position in
co-authorship networks in three fields. Journal of In-
formetrics, 9(1):135–144.
Cambria, E. and White, B. (2014). Jumping nlp curves: A
review of natural language processing research. IEEE
Computational intelligence magazine, 9(2):48–57.
Carchiolo, V., Grassia, M., Malgeri, M., and Mangioni, G.
(2022a). Co-authorship networks analysis to discover
collaboration patterns among italian researchers. Fu-
ture Internet, 14(6).
Carchiolo, V., Grassia, M., Malgeri, M., and Mangioni, G.
(2022b). Network topology to predict bibliometrics
indices: A case study. In Pardede, E., Delir Haghighi,
P., Khalil, I., and Kotsis, G., editors, Information Inte-
gration and Web Intelligence, pages 166–180, Cham.
Springer Nature Switzerland.
Carchiolo, V., Grassia, M., Malgeri, M., and Mangioni, G.
(2023). Correlation between researchers’ centrality
and h-index: A case study. In Braubach, L., Jan-
der, K., and B
˘
adic
˘
a, C., editors, Intelligent Distributed
Computing XV, pages 133–143, Cham. Springer Inter-
national Publishing.
Cortes, C. and Vapnik, V. (1995). Support-vector networks.
Machine Learning, 20(3):273–297.
De Stefano, D., Giordano, G., and Vitale, M. (2011). Issues
in the analysis of co-authorship networks. Quality &
Quantity, 45:1091–1107.
Elsevier B.V. Elsevier Developer - Academic Research.
https://dev.elsevier.com/api\ service\ agreement.
html. Accessed: July, 2021.
Elsevier B.V. Elsevier Developer - API Service Agree-
ment. https://dev.elsevier.com/academic\ research\
scopus.html. Accessed: Juy, 2021.
He, K., Zhang, X., Ren, S., and Sun, J. (2016). Deep resid-
ual learning for image recognition. In 2016 IEEE Con-
ference on Computer Vision and Pattern Recognition
(CVPR), pages 770–778.
H
ˆ
ancean, M., Perc, M., and Lerner, J. (2021). The coau-
thorship networks of the most productive european re-
searchers. Scientometrics, 126:201–224.
Jumper, J., Evans, R., and Pritzel, A. e. a. (2021). Highly
accurate protein structure prediction with alphafold.
Nature, 596(7873):583–589.
Livak, K. J. and Schmittgen, T. D. (2001). Analysis of
relative gene expression data using real-time quantita-
tive pcr and the 2(-delta delta c(t)) method. Methods,
25(4):402–408.
Pedersen, T., Patwardhan, S., Michelizzi, J., et al. (2004).
Wordnet:: Similarity-measuring the relatedness of
concepts. In AAAI, volume 4, pages 25–29.
Wang, J. and Dong, Y. (2020). Measurement of text simi-
larity: a survey. Information, 11(9):421.
DATA 2024 - 13th International Conference on Data Science, Technology and Applications
584
