
Virtually Free Randomisations of NTT in RLWE Cryptosystem to
Counteract Side Channel Attack Based on Belief Propagation
Christophe Negre
1
and Mbaye Ngom
1,2
1
DALI-LIRMM, Perpignan, France
2
eShard, Pessac, France
Keywords:
Side Channel Attack, Belief Propagation, Number Theoretic Transform, Randomisation, Post-Quantum
Cryptosystems.
Abstract:
At CHES 2017, Primas, Pessl and Mangard presented an attack on RLWE cryptosystem based on Belief Prop-
agation. The attack applies on the Number Theoretic Transform (NTT) used to decipher a message. It gathers
power consumption leakage of the multiplication by roots of unity in the NTT and then applies Belief Propa-
gation to circulate the information of all leakage nodes, until the combined leakage reveal most of the output
coefficients of the NTT. In this paper we present some randomisations which either induce in NTT some ran-
dom mask on values or randomly rearrange the sequence of operations. We evaluate the level of randomisation
provided by the proposed counter-measures and also the effect on the processed values in the NTT. We apply
Belief Propagation on the proposed randomised NTT and we study how these randomisations affect the attack.
Finally we point out that a set of three combined strategies provide a high level of randomisation and a good
protection against Belief Propagation attack of Primas et al.
1 INTRODUCTION
The progress of quantum computers combined with
Shor’s algorithm (Shor, 1999) is threatening cryp-
tosystems like RSA, ECC. NIST launched a compe-
tition in 2017
1
for selecting a set of post-quantum
cryptosystems. The competition is now finished, an-
other round of competition was launch for additional
digital signature scheme. There were many candi-
dates based on Ring/Module Learning With Error
(RLWE/MLWE) problem for key establishment and
digital signature and some were selected. The theo-
retical security of these post-quantum cryptosystems
were intensively analysed during these past years. Se-
curity and protection against side channel analysis
might be pursued.
One component in RLWE computation is the
Number Theoretic Transform (NTT) which evaluates
a polynomial at the roots of unity. This is used for
efficient multiplication in the ring Z
q
[X]/(X
n
+ 1) of
RLWE cryptosystems. In 2017 Primas, Pessl and
Mangard (Primas et al., 2017) proposed an attack on
NTT based on Belief Propagation (Pearl, 1982). Their
1
https://csrc.nist.gov/projects/post-quantum-
cryptography
attack used leakage in power consumption or electro-
magnetic emanation in the computation of the NTT.
They used Belief Propagation to gather scattered in-
formation due to leakage in the multiplication by the
roots of unity, in order to recover most of the output
coefficients of the NTT. This attack only requires a
single trace and is an important threat on RLWE cryp-
tosystem on embedded devices. The purpose of this
paper is to propose and study counter-measures pre-
venting this attack.
Contributions. We study a set of randomisations of
NTT computation to counteract Primas et al.’s at-
tack. We focus on virtually free randomisation, which
means that the studied randomisation does not imply
additional operations in the ring Z
q
[X]/(X
n
+ 1). We
study the following approaches: shuffling of opera-
tions at each stage of the NTT, randomisation of the
roots of unity, randomisation by random multiplica-
tive masks, randomisation of the reduction modulo q,
and random choice of the butterfly formula in NTT.
For all these considered randomisations we study the
effect on the data processed in NTT and provide the
level of randomisation. We also simulate the Belief
Propagation attack on randomised NTT to evaluate
the effect of the randomisation on this attack.
866
Negre, C. and Ngom, M.
Virtually Free Randomisations of NTT in RLWE Cryptosystem to Counteract Side Channel Attack Based on Belief Propagation.
DOI: 10.5220/0012857500003767
In Proceedings of the 21st International Conference on Security and Cryptography (SECRYPT 2024), pages 866-875
ISBN: 978-989-758-709-2; ISSN: 2184-7711
Copyright © 2024 by Paper published under CC license (CC BY-NC-ND 4.0)

Organisation of the Paper. In Section 2 we review
some background on RLWE cryptosystem and algo-
rithms used for NTT. In Section 3 we review Belief
Propagation and the attack of Primas et al. (Primas
et al., 2017). In Section 4 we present a set of ran-
domisation of NTT to counteract Primas et al.’s at-
tack, we analyse the impact of the randomisation on
the processed value in NTT. In Section 5 we provide
some simulation results of Belief Propagation attack
applied on our proposed randomised NTT. Finally, in
Section 6, we give some concluding remarks.
2 RLWE CRYPTOSYSTEM AND
NUMBER THEORETIC
TRANSFORM (NTT)
In this section we review a cryptosystem presented
in (Lyubashevsky et al., 2010) based on the Ring
Learning with Error (RLWE) problem. This cryp-
tosystem will be our reference encryption scheme to
analyse the proposed counter-measure on this type of
cryptosystem. We also review the algorithm used for
the NTT computation involved in the ring multiplica-
tion of the ciphering/deciphering operations.
2.1 RLWE Cryptosystem
In (Lyubashevsky et al., 2010) Lyubashevsky et al.
present a public-key encryption scheme based on
RLWE. Let us first recall the RLWE problem. We
consider a ring R
q
= Z
q
[X]/(X
n
+ 1) with q a prime
integer, the coefficients of an element in R
q
are taken
in {−⌊q/2⌋,... ,⌊q/2⌋}. We also consider two ran-
dom distributions on R
q
:
• a
U
←− R
q
the uniform distribution.
• e
χ
←− R
q
a distribution centered at 0 with small
coefficients, e.g., a discrete Gaussian distribution
with a small standard deviation.
Then, the RLWE can be formulated as follows.
Definition 1 (RLWE problem.). We randomly set
a
U
←− R
q
and s, e
χ
←− R
q
. The RLWE problem consists
in computing s from:
a and b = a ×s + e
It was shown in (Regev, 2009) that the LWE prob-
lem is as hard as finding short vector/basis in a lattice
(the RLWE is also assumed to be difficult but to the
best of our knowledge its hardness is unknown).
The public-key encryption scheme of (Lyuba-
shevsky et al., 2010) based on RLWE problem works
as follows: the plaintext is a bit string m of n bits
m
0
,. .. , m
n−1
, and it is transformed into a polynomial
m ∈ R
q
with coefficients m
i
= (−1)
m
i
×⌊q/4⌋.
• Key Generation:
– Private : r
1
,r
2
χ
←− R
q
– Public : a
U
←− R
q
and b = r
1
−a ·r
2
• Encryption: Plaintext m ∈ {0,1}
n
is first en-
coded as m ∈ R
q
, and then encrypted as
(c
1
,c
2
) = (a ·e
1
+ e
2
,b ·e
1
+ e
3
+ m)
with e
i
χ
←− R
q
.
• Decryption:
m = Decode(c
1
·r
2
+ c
2
)
where Decode rounds each coefficient towards
±⌊q/4⌋ and then deduces the bits m
i
.
In the recent NIST competition
2
for Post Quantum
Cryptography standards a number of the candidates
were variants of the above cryptosystem based on
RLWE. So the discussion in the remaining of the pa-
per could be applied with only a few changes to these
cryptosystems. Specifically, the chosen standard Ky-
ber (Bos et al., 2018) for key-encapsulation can bene-
fit from the proposed counter-measure against BP at-
tack.
2.2 Number Theoretic Transform
(NTT)
The main operation in RLWE encryption and decryp-
tion is the multiplication in R
q
. The prime q is gen-
erally chosen in order to have a primitive 2n-th root
ω of unity in R
q
. In this case, X
n
+ 1 splits entirely
and the multiplication in R
q
can be transformed into
a point-wise multiplication through the Chinese re-
mainder theorem (CRT) isomorphism
Z
q
[X]/(X
n
+ 1)
∼
=
∏
n−1
i=0
Z
q
[X]/(X −ω
2i+1
)
f 7→ (f(ω
2i+1
))
i=0,...,n−1
where we used the following on the right side:
f(X) mod (X −ω
2i+1
) = f(ω
2i+1
). Then, applying,
the above isomorphism to f(X) =
∑
n−1
i=0
f
i
X
i
consists
in computing for i = 0, .. .,n −1:
f(ω
2i+1
) =
n−1
∑
j=0
f
j
ω
(2i+1) j
=
n−1
∑
j=0
( f
j
ω
j
)(ω
2i
)
j
. (1)
2
https://csrc.nist.gov/projects/post-quantum-
cryptography
Virtually Free Randomisations of NTT in RLWE Cryptosystem to Counteract Side Channel Attack Based on Belief Propagation
867
The NTT
n
is the multi-evaluation of a polynomial at
the n-th roots of unity. This means that the right side
of equation (1) is the NTT of f
′
(X) =
∑
n−1
j=0
( f
j
ω
j
)X
j
in the n-th root of unity ω
2i
for i = 0, .. .,n −1. The
NTT
n
of a degree n −1 polynomial can be computed
recursively with O(nlog(n)) operations modulo q, as
shown in the following subsections.
2.2.1 NTT with Odd-Even Splitting
We briefly recall the approach of Cooley-Tukey (Coo-
ley and Tukey, 1965) for the computation of NTT.
This approach uses an even-odd splitting of the poly-
nomial f(X):
f(X) =
n/2−1
∑
k=0
f
2i
X
2i
| {z }
f
e
(X
2
)
+X ×
n/2−1
∑
i=0
f
2i+1
X
2i
| {z }
f
o
(X
2
)
If we evaluate the above equation in ω
j
for j =
0,. .. , n −1 we will get the following equations. This
shows that NT T
n
of f is deduced from NT T
n/2
(f
e
) and
NT T
n/2
(f
o
) by the following butterfly operations:
f(ω
j
) = f
e
(ω
2 j
) + ω
j
f
o
(ω
2 j
)
f(ω
n/2+ j
) = f
e
(ω
2 j
) −ω
j
f
o
(ω
2 j
)
Figure 1a shows the sequence of operations (reorder-
ing, recursion, multiplication and addition) involved
in the Cooley-Tukey NTT computation. We can no-
tice that in this case the multiplication is always done
ahead of an addition and a subtraction.
2.2.2 NTT with High-Low Splitting
We recall Gentleman-Sande’s approach for the NTT
computation. Let us consider the two following poly-
nomials
f
′
(X) =
∑
n/2−1
i=0
( f
i
+ f
n/2+i
)X
i
,
f
′′
(X) =
∑
n/2−1
i=0
( f
i
− f
n/2+i
)ω
i
X
i
.
We obtain the NTT
n
coefficients of f for even powers
(resp. odd powers) of ω from the NTT
n
2
of f
′
(resp. of
f
′′
) as follows:
f(ω
2 j
) = f
′
(ω
2 j
) for j = 0,. ..,
n
2
−1
f(ω
2 j+1
) = f
′′
(ω
2 j
) for j = 0,. ..,
n
2
−1
The diagram shown in Fig. 1b provides the sequence
of operations (High-Low splitting, multiplication, ad-
dition/subtraction, recursion and reordering) with the
High-Low splitting approach for NTT.
Organisation of the NTT Operations. In the sequel we
will randomise the computations done in the NTT, so
add
NTT n/2
sub
NTT n/2
Recursion
Recursion
mult
Odd-even splitting
ω,...,ω
0
n/2-1
(a) Odd-Even splitting
add
NTT n/2
sub
Recursion
mult
NTT n/2
Recursion
ω,...,ω
0
n/2-1
High Low splitting
(b) High-Low splitting
Figure 1: NTT recursions.
to clearly explain how these randomisations are done
we need to clearly established the sequence of opera-
tions done in an NTT. The operations at each level are
as follows:
• In level 0. We have one group of butterfly opera-
tions on the n input coefficients f
i
.
• In level 1. We have two groups of butterfly op-
erations: one on the coefficients 0,. .., n/2 and a
second on the coefficients 0,. .., n/2.
• In level 2. we have four groups of butterfly opera-
tions, each of size n/4.
• etc.
We provide in Fig. 2 an NTT with 2 recursion levels
of the High-Low splitting approach.
3 BELIEF PROPAGATION ON
NTT
In (Primas et al., 2017) Primas, Pessl and Mangard
proposed an attack on NTT which uses side chan-
nel leakage of multiplication by the root of unity
and apply belief propagation (Pearl, 1982) to de-
duce most of the coefficients of the output polynomial
NT T (f). This attack is an extension of the SASCA
attack (Veyrat-Charvillon et al., 2014) on AES to the
SECRYPT 2024 - 21st International Conference on Security and Cryptography
868

Add
f
f
f
f
Add
Sub
Sub
Mul
Mul
ω
1
ω
0
Add
Add
Sub
Sub
Mul
Mul
ω
0
ω
0
0
1
2
3
f
f
f
f
0
1
2
3
^
^
^
^
level 0
level 1
Figure 2: Leakage in NTT
4
computation.
NTT computation. We briefly review the principle of
this attack and give some background on belief prop-
agation.
The authors in (Primas et al., 2017) use a leakage
in the multiplication by ω
i
in the NTT in order to get
a likelihood estimation of the value x ∈ Z
q
processed
in this multiplication. Figure 2 shows an example of
leakage in NTT
4
. This likelihood estimation can be
obtained by constructing a template of the leakage of
a multiplication by a prescribed root of unity ω
i
.
The information provided by all the likelihood es-
timation at each multiplication of the NTT does not
give likelihood estimation for all other values pro-
cessed in the NTT. Indeed, some temporary values in
the NTT are not directly involved in a multiplication
with ω
j
, so such values remain unknown. The authors
in (Primas et al., 2017) propose to use the belief prop-
agation algorithm (BP) (Pearl, 1982) to propagate the
scattered information throughout the NTT computa-
tions, in order to deduce the missing unknown values.
Let us sketch the idea of belief propagation on a
simple example. We consider the addition z = x + y
mod q of two values x, y ∈ Z
q
. Let us denote P(x)
(resp. P(y)) as the probability (i.e. likelihood estima-
tion) of the value x (resp. y) input to an adder (Fig. 3).
x
y
Add
z
P(x) P(y)
P(z)
Figure 3: Probability propagation on an addition.
We can propagate these probabilities, to get the
probability P(z) of the output z = x + y as
P(z) =
∑
x+y mod q=z
P(x)P(y) (2)
Let us illustrate this fact with a small example: we
assume that q = 3 and that the probabilities of x and
y are the ones shown in the table below. With these
probabilities we know with a high probability that x =
−1 and y = 0. Then propagating the probability to z
with the above formula leads to the probability of z
shown in the table. And then we know that with high
probability z = −1.
Variable Probabilities
x P(−1) = 0.9, P(0) = 0.05, P(1) = 0.05
y P(−1) = 0.03, P(0) = 0.91, P(1) = 0.06
z P(−1)
∼
=
0.82, P(0)
∼
=
0.101, P(1)
∼
=
0.075
Note that, in belief propagation, the probabilities are
also propagated as follows: from P(z) and P(y) to get
P(x) and from P(z) and P(x) to get P(y).
Belief Propagation on NTT. Due to lack of space we
just sketch the main process of the Belief Propagation
on the NTT of (Primas et al., 2017). For further de-
tails the reader may refer to (Primas et al., 2017). For
all intermediate variables of the NTT we set a proba-
bility for each variable: for variable resulting from a
multiplication with ω
k
this probability comes from a
template of the power consumption leakage, for other
variables the probality it set to the uniform distribu-
tion. The propagation is then done by applying prop-
agation formula similar to the one in (2) for each Add
and Sub operation of the NTT. We repeat this process
a number of times, and this effectively propagates the
information of the templates to unkown variables (the
one with uniform distribution). At the end, we suc-
ceed if in the output variables of the NTT the values
with the highest propbabilities a the correct correct
values.
4 RANDOMISATION OF NTT
In this section we first review the randomisation pro-
posed in the literature. We then present a set of ran-
domisations and evaluate their effect to prevent Belief
Propagation attack on NTT.
State of the Art: Randomisation at the Input of
the NTT. In the literature we can find the three fol-
lowing strategies for the randomisation of the input of
the NTT:
Virtually Free Randomisations of NTT in RLWE Cryptosystem to Counteract Side Channel Attack Based on Belief Propagation
869

Multiplicative
mask
f
′
= α ×f with a random α ∈ Z
q
b
f
′
= NT T (f
′
)
b
f = α
−1
×
b
f
′
Additive mask
random split f = f
′
+ f
′′
b
f
′
= NT T (f
′
)
b
f
′′
= NT T (f
′′
)
b
f =
b
f
′
+
b
f
′′
Shifting
f
′
= X
r
×f mod (X
n
−1)
b
f
′
= NT T (f
′
)
b
f = (ω
−ir
b
f
′
i
)
i=0,...,n−1
These three randomisations do not protect NTT
from the attack of Primas et al. based on Belief Prop-
agation. Indeed, the attack can be conducted on the
computation of NT T (f
′
) (and NT T (f
′′
) for the addi-
tive mask). Then to recover f we just have to add f
′
and f
′′
for the additive mask, or guess the random pa-
rameter (α or r) for the two other strategies and then
proceed to the computation of the secret key as in Pri-
mas et al. attack (Primas et al., 2017).
State of the Art: Randomisation of the Whole
NTT.
Ravi et al. in (Ravi et al., 2020) proposed the fol-
lowing shuffling and masking randomisation to pro-
tect the NTT from Primas et al.’s attack..
Shuffling. This approach is detailed in (Ravi et al.,
2020) but it is classical approach known for some
time. At each level butterfly operations are performed
in a random order, using a pseudo random generator
which randomly produces the pairs of (m,i) of each
butterfly iteration of level j: m gives the group of but-
terflies of level j and i the index of this butterfly in
this group.
This randomisation renders difficult to associate
each portion of power trace of multiplication by a
root ω
k
of unity. But if the processed values are not
masked, it could then be easier for attacker to find
the root ω
k
involved in the trace and/or link input and
output value from two NTT recursion levels. So this
randomisation might be associated with another one
to be effective.
Let us eavaluation the level of randomisation: in
the general case, at each level of NTT the are
n
2
! pos-
sible reordering of the pairs (m,i). This gives a level
of randomization of (
n
2
!)
log
2
(n)
.
Multiplicative Mask. This approach masks each in-
termediate variable a with a multiplicative mask a
′
=
a ×ω
r
a
, with r
a
random, which is refreshed at each
butterfly operation. In (Ravi et al., 2020) the authors
propose several variants of this approach to reduce the
cost. But all these strategies have, at least, an increase
in cost of
n
2
log
2
(n) multiplications in the NTT.
4.1 Proposed Randomisations
We present in this section a set of virtually free
randomisation techniques of the NTT. Virtually free
means that they do not induce additionnal operations
in Z
q
. Shuffling approach is an example of such ap-
proach, and we will consider it in the sequel as a com-
plement of the proposed approaches.
4.1.1 Random Primitive Root of Unity
• Description of the randomisation. This approach
only applies to NTT with High-Low splitting. In
this approach, at any recursive level of the NTT,
and before each group of butterfly operations, we
randomly pick the primitive root of unity. Since
n = 2
t
the primitive roots are w
e
with e an odd
integer smaller than n. This results in the follow-
ing pseudo-code for the splitting part of the NTT
recursion.
e
U
←− {1,3, . .. ,n −3,n −1}
ω
′
= ω
e
// High-Low splitting and butterfly operations
f
′
←
∑
n/2−1
i=0
( f
i
+ f
n/2+i
)X
i
f
′′
←
∑
n/2−1
i=0
( f
i
− f
n/2+i
)ω
′i
X
i
This randomisation does not involve any addi-
tional cost in Z
q
, when all ω
i
are precomputed.
• Quality of the Randomisation. As we can see in
the pseudo code
– At each recursion level, only half of the coeffi-
cients are masked by the random root: n/2 in
level 1, 2 ×n/4 = n/2 in level 2, 4×n/8 = n/2
in level 3, and so on.
– The number of coefficients masked at least
once during the whole NTT computation is
n/2 after the level 1, n/2 + n/4 after level 2,
n/2 + n/4 + n/8 after level 3 and so on. So at
the end we get n −2 masked coefficients (the
last level does not involve multiplication).
• Level of Randomisation At the i-th level of the
NTT recursion, there are 2
i
group of butterfly op-
eration and for each group we pick ω
′
among
n/2
i+1
primitive roots of unity. Taking the prod-
uct for i = 0, ... ,t −2, we obtain the following
level of randomisation:
∏
t−2
i=0
(2
t−1−i
)
2
i
=2
∑
t−2
i=0
(t−1−i)2
i
=
2
n−1
n
SECRYPT 2024 - 21st International Conference on Security and Cryptography
870

4.1.2 Random Multiplicative Mask in Each
Multiplication with a Root of Unity
This randomisation applies only on NTT formula with
High-Low splitting.
• Description of the Randomisation. In this ap-
proach, before the High-Low butterfly operation
of a recursion level we pick a random r, and we
replace in the multiplication ω
i
by ω
i
×ω
r
= ω
i+r
.
The resulting randomised butterfly operations are
shown below :
r
U
←− {0,. . ., n −1}
// HL splitting and butterfly operation
f
′
←
∑
n/2−1
i=0
( f
i
+ f
n/2+i
)X
i
f
′′
←
∑
n/2−1
i=0
( f
i
− f
n/2+i
)ω
i+r
X
i
Since all power of ω are all precomputed this does
not require any additional computation, the result-
ing coefficients of NT T (f
′′
) are masked by ω
r
.
This approach is somehow a variation of the mul-
tiplicative mask randomisation of (Ravi et al.,
2020): we apply it on High-Low splitting formula
and with a and b sharing the same mask.
• Quality of Randomisation. The analysis is exactly
the same as in the randomisation of the primitive
root of unity. This means that at each NTT level
n/2 values are masked, and at the end of the NTT
n −2 coefficients are masked at least once during
the computation.
This version of the randomisation with multiplica-
tive mask, is weaker than the one of Ravi et
al. (Ravi et al., 2020). Indeed in (Ravi et al.,
2020) all variables are masked during the whole
NTT computation. But, in counter part, the pro-
posed approach is more efficient since it does not
involved any additional cost.
• Level of Randomisation. The analysis of the ran-
domisation shows that: at recursive level 1 we
pick one random r among n integers, at level 2
we pick two random r among n integers, at level
3 we pick four random r among n integers and so
on until level t −2. This results in the following
level of randomisation:
∏
t−2
i=0
(n)
2
i
=n
n
2
−1
4.1.3 Random High-Low/Odd-Even Butterfly
Operations
We randomise the sequence of butterfly operations of
the NTT by randomly choosing the type of splitting
used (i.e. High/Low or Odd/Even) at each group of
each level.
• Description of the randomisation. In Section 2
we reviewed the two approaches for the recursive
computation of NTT: High-Low and Odd-Even
splitting. We also showed that the sequence of
operations (addition, subtraction, multiplication
and recursion) in these two approaches are differ-
ent. We propose to randomly choose High-Low
or Odd-Even splitting recursion for each group of
butterfly operations.
A sketch of the pseudo code of this approach is
shown below:
r
U
←− {0,1}
if r = 0 then
// Apply High-Low splitting butterfly and re-
cursion
...
else
// Apply Odd-Even splitting butterfly and re-
cursion
...
• Quality of Randomisation. Since the sequence of
operations is random, the intermediate values in
the NTT computation are also random and then
less predictable. But the sequence of operations
could leak out the type of splitting approach used
(i.e. the values of the random bits r): addi-
tion/subtraction followed by a multiplication cor-
responds to a High-Low splitting butterfly, while
multiplication followed by addition/subtraction
corresponds to an Odd-Even splitting butterfly.
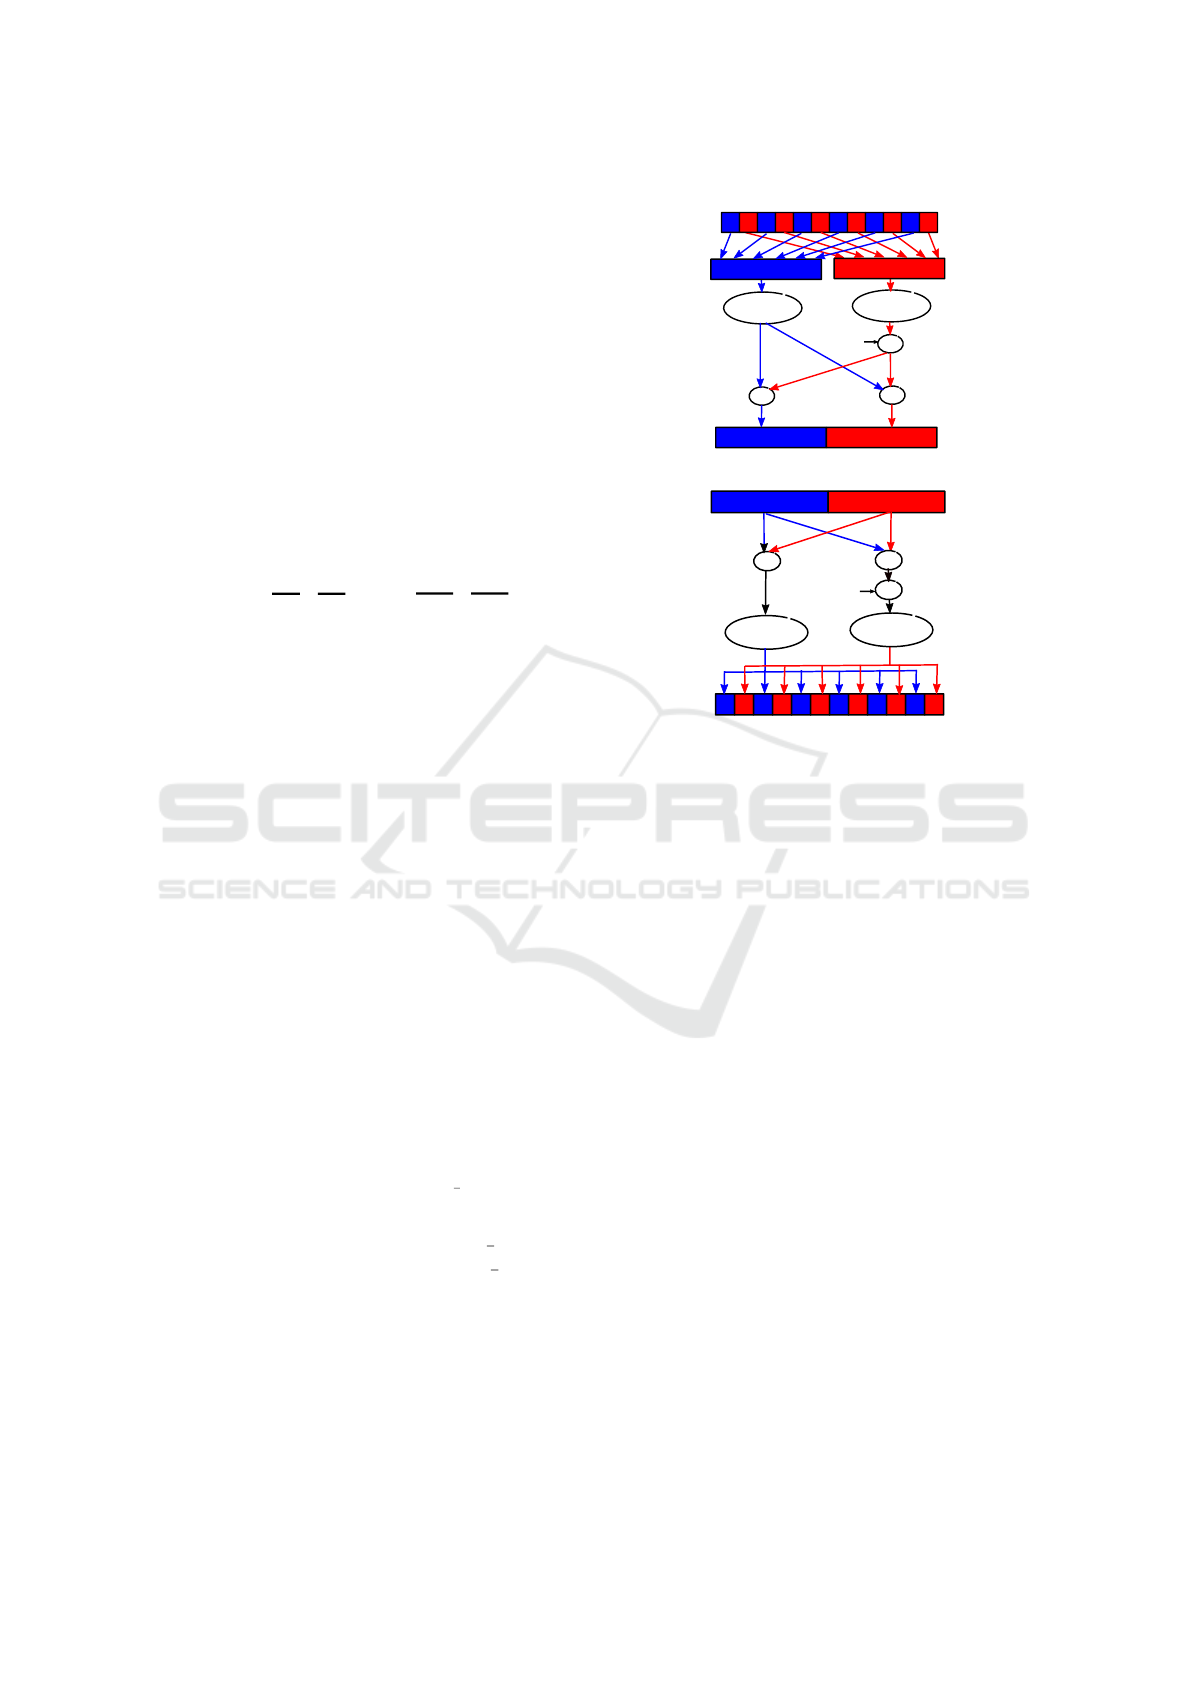
• Example. We set n = 16 and we pick the values of
r shown in Subfig 4a for each recursive level.
0
0
0
0
0
0
0
0
1
1
1
1
1
1
1
(a) Random bits
HL
HL
OE
OE
OE
HL
HL
HL
HL
HL
HL
OE
OE
OE
OE
f
f
^
level 0
level 1
level 2
level 3
(b) Butterfly operations
Figure 4: Leakage in HLOE randomisation.
The diagram in Subfig 4b shows the organisation
of the operation for the above random bits r. We
can see that the block with OE butterfly operations
in level 1 is leaked out, as is the block with HL
butterfly operations in the level 3.
In order to prevent the leakage due to the sequence
of operations, we can restrict the bit r to be half of
Virtually Free Randomisations of NTT in RLWE Cryptosystem to Counteract Side Channel Attack Based on Belief Propagation
871

the time 0 and half of the time 1 in each path from
root to leaves in the recursion tree. In Figure 5
we show an example on such restricted random-
ization.
0
0
1
0
1
1
1
1
1
1
0
1
1
0
1
(a) Balanced random
bits
HL
HL
OE
OE
HL
OE
HL
HL
OE
OE
OE
OE
OE
OE
f
f
^
level 0
level 1
level 2
level 3
OE
(b) Non-leaking butterfly oper-
ations
Figure 5: Non leaking HLOE randomisation.
• Level of Randomisation. If we can pick freely the
bit r for each group of butterfly operations, we
would get the following level of randomisation :
1 + 2 + 2
2
+ . .. + 2
t−2
=
n
2
−1
But, to prevent leakage, if we restrict the randomi-
sation in order to get half of the levels with High-
Low butterfly operations and the other half with
Odd-Even butterfly operations, then only for the
first t/2 level the bit r can be chosen freely. This
means that the level of randomisation is at least :
1 + 2 + 2
2
+ . .. + 2
t/2
∼
=
√
n
4.1.4 Randomise Modular Reduction
We propose to randomly select the algorithm for mul-
tiplication modulo q for each group of butterfly oper-
ations.
• Description of the Randomisation. There are sev-
eral ways to perform a multiplication of two el-
ements x and y modulo q, the two most popular
are the Montgomery multiplication and the Bar-
rett multiplication. Let us assume that q is an
ℓ-bit prime integer. In Barrett algorithm reduces
the product x ×y by clearing the ℓ most signif-
icant bits, while Montgomery algorithm reduces
the product x ×y by clearing the ℓ least significant
bif of x ×y, producing a factor 2
−ℓ
in the result.
then these two algorithm are shown in Table 1.
Table 1: Barrett and Montgomery modular multiplication.
Barrett modular mult Montgomery modular mult
Precomp. q
′
= ⌊2
2ℓ
/q⌋ Precomp. q
′
= q
−1
mod 2
ℓ
z ←x ×y
s ←⌊⌊z/2
ℓ−1
⌋q
′
/2
ℓ+1
⌋
r ← z −s ×q
z ←x ×y
s ←q
′
×z (mod 2
ℓ
)
r ← (z −s ×q)/2
ℓ
Then we modify the High-Low splitting approach
of NTT as follows: before each step of butter-
fly operation we flip a coin b and we apply Bar-
rett multiplication (BM) if b = 0 and Montgomery
multiplication if b = 1. A sketch of the pseudo-
code for randomised butterfly operations is shown
below :
b
U
←− {0,1}
if b = 0 then
// High-Low butterfly with BM and recursion
...
else
// High-Low butterfly with MM and recur-
sion
...
• Quality of the Randomisation. We notice the fol-
lowing:
– Only the values involved in a multiplication
with ω
i
are randomised. This means that n/2
value are randomised at each level of recursion
and at the end, n −2 values are randomised at
least once during the NTT.
– A Montgomery multiplication produces a mul-
tiplicative mask 2
−ℓ
. A final coefficient
ˆ
f
′
i
is
involved between 0 and t −2 multiplications in
the whole randomised NTT computation. This
means that
ˆ
f
′
i
has a random multiplicative mask
as follows
ˆ
f
′
i
=
ˆ
f
i
×(2
−ℓ
)
k
for some k ∈{0,... ,t −2}.
– Even if Barrett multiplication and Montgomery
multiplication are very similar in terms of the
sequence of operations (multiplications and
shiftings), there are some slight differences (the
type of shift done). These slight differences
could be visible in the power consumption leak-
age and this could leak out which algorithm was
used, revealing the randomisation used.
• Level of Randomisation. For n = 2
t
, at the first
level of recursion we flip one coin, at level 2 we
flip two coins, at third level we flip 4 coins and so
on. In the last level there is no multiplication, so
randomisation stop at level t −1. We then obtain
the following level of randomisation:
1 + 2 + 2
2
+ . .. + 2
t−2
=
n
2
−1.
SECRYPT 2024 - 21st International Conference on Security and Cryptography
872

5 SECURITY EVALUATION OF
THE PROPOSED
RANDOMISATIONS OF NTT
In this section we present simulation results of Belief
Propagation. We first show how the Belief Propaga-
tion behaves when no randomisation is applied in the
NTT. Afterwards for each proposed randomisation we
will show how the Belief Propagation is affected and
finally we will study some combination of randomi-
sation to see if it reinforces the security of the imple-
mentation.
Leakage of Multiplication. To simulate the power
consumption we used the Hamming distance between
the considered value v and the processed value v
p
without any noise. So the attacker has a good infor-
mation on the value processed in a multiplication. We
derive the probability that a value v is involved in the
multiplication v
p
×ω
i
mod q with a centered Gaus-
sian likelihood estimator with deviation σ = 0.25:
P(v) = e
−
HamDist(v,v
p
)
2
σ
.
Note that this assumption gives more power to the at-
tacker than the model used in (Primas et al., 2017).
Indeed, in (Primas et al., 2017) the leakage model the
hamming weight of the processed value which leaks
out less information that the hamming distance.
5.1 Simulation Results for Non-Mixed
Randomisations
Now we present simulation results of Belief Propaga-
tion on NTT for different randomisation approaches
and for n = 256 and q = 3329, which are the ones
used in Kyber (Bos et al., 2018).
We consider in this section randomisation of NTT
with only one approach among (RandRoot, MulMask,
RandRed and RandHLOE) and the Shuffling ran-
domisation of Ravi (Ravi et al., 2020). For compar-
ison purpose, we also provide the result for a non-
randomised NTT.
5.1.1 Correct Guess in the Whole NTT
Fig. 6 shows the number of values with highest prob-
ability which are correct among all variable nodes of
Belief Propagation graph. For n = 2
t
the total number
of variable nodes are (t + 1) ×n, so for n = 256 we
have 2356 variable nodes.
For the non-randomised NTT, the curve shows
that we need around t iterations to reach a maxi-
mum of 1800 variables with correctly guessed val-
ues (among 2356 variables). The other variables are
hidden by the remaining uniform probability sources,
and we believe that this cannot be changed by more
BP iterations. So we cannot recover more variables.
Figure 6: Number of correct coefficient on the whole NTT.
For the randomised NTTs, we can notice that the
number of correct guess is significantly higher for
randomisation which does not affect the sequence of
operations in NTT (i.e. RandRoot, RandMultMask,
RandRed). We can also notice that RandRed is the
least effective randomisation.
The HLOE randomisation, disorganises the oper-
ations done in NTT, so the graph used in Belief propa-
gation does not match the sequence of operations pro-
cessed for the NTT and this produces the low number
of correct guess. The same is true for the Shuffling
approach of (Ravi et al., 2020).
5.1.2 Correct Guess in the Last Level of NTT
Looking at the correct guess in the last level tells us
if the Belief Propagation is inefficient or not. Indeed,
if the number of correct guess is really small, then
almost no information leaks out and the secret cannot
be recovered. In Fig. 7 we show the number of correct
guess for non-randomised NTT and for all considered
randomisation during the execution of Belief Propa-
gation.
We first notice that, in the case of non-randomised
NTT, the number of correct guess increases during
the first iterations, to reach the maximal value of
254 = n −2. For the randomised NTT most of the
curves are flat or decrease. The only curve which
increases is the one for RandRed, which means that
belief propagation is able to combine distant informa-
tion to recover some unknown values. This means
that the leakage in RandRed approach remains impor-
tant.
But we can notice that all the considered randomi-
sations prevent the Belief Propagation to be success-
Virtually Free Randomisations of NTT in RLWE Cryptosystem to Counteract Side Channel Attack Based on Belief Propagation
873
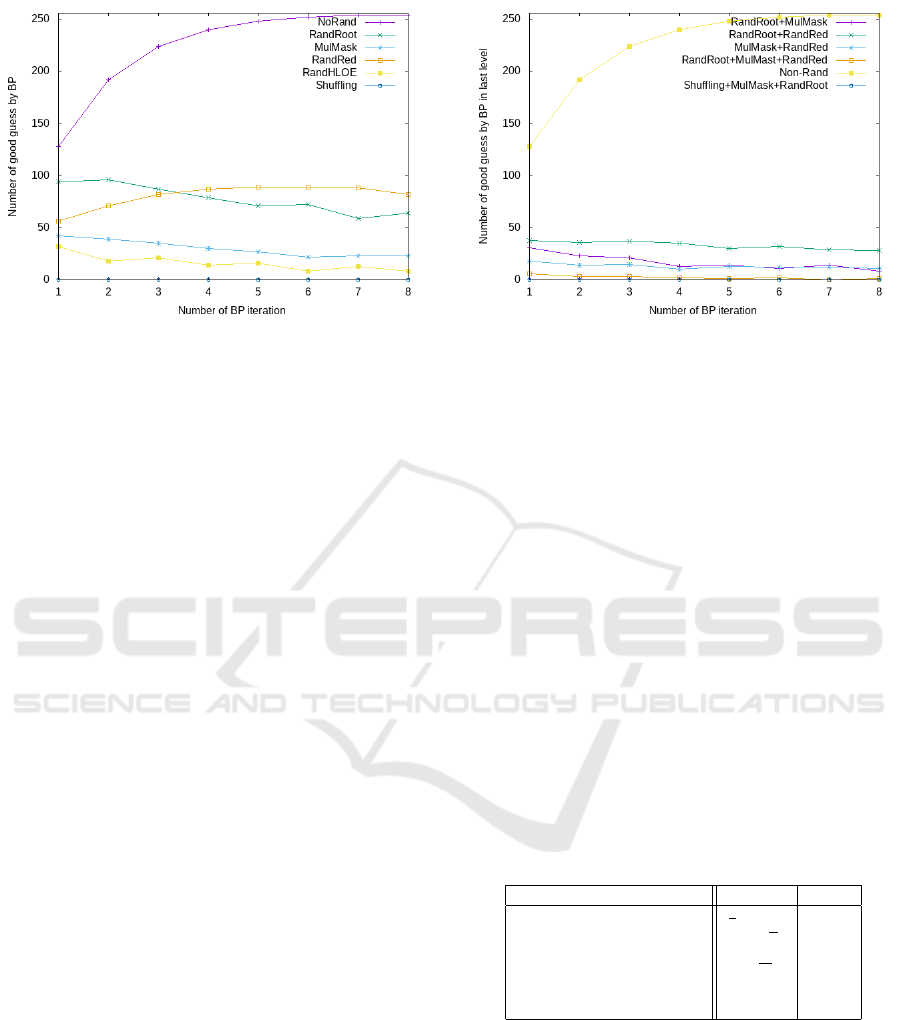
Figure 7: Correct guessed value in last NTT level.
ful: the number of correctly guess coefficients is too
small to recover the whole secret output.
5.2 Simulation Results for Mixed
Randomisation
Some randomisations can be combined: RandOrder,
RandRed, RandRoot and RandMulMask. Indeed they
are all applied to NTT with High-Low splitting strat-
egy and the randomisations can be applied indepen-
dently from each other.
The RandHLOE approach partly uses Odd-Even
splitting formula, which requires to have data with
the same multiplicative mask. This prevents the use
of RandHLOE combined with RandRed, RandRoot
and/or RandMulMask since they produces masked
data with possibly different masks.
The shuffling randomisation of (Ravi et al., 2020)
can be combined to all the other approaches. But
since shuffling already provide curve really close to
zero, we only provide the simulation result for Shuf-
fling+RandRoot+RandMulMask.
The numbers show that, as expected, the com-
bination of two or three randomisations lower the
number of correct guess. The combination Rand-
Root+MulMask+RandRed give a curve really close to
zero, this means that it does not leak any information.
The combination of Rand-
Root+RandMulMask+Shuffling seems to be the
most effective one. Indeed, even if the attacker is able
to know the root of unity used in each multiplication,
the use of the RandRoot prevent him to know the
node of graph of the NTT it should be associated
with: it could be anyone in the same group. And in
this case, the graph cannot be correctly constructed
and Belief Propagation would then fails.
Figure 8: Total number of correct guess per BP iteration for
combined randomisations.
6 CONCLUSION
In this paper we considered the security of Ring
LWE cryptosystems relatively to Primas et al.’s attack
based on Belief Propagation (Primas et al., 2017).
The attack in (Primas et al., 2017) focuses on the
Number Theoretic Transform and exploits scattered
leakage information to recover the output of NTT. We
proposed a set of virtually free randomisations which
reorganise/modify the sequence of operations of the
NTT and/or induce a random mask in the processed
values.
The level of randomisation of each approach is
shown in Table 2. These results show that the level
of randomisation for RandHLOE and RandRed is re-
ally low and could be attacked by exhaustive search of
the random bits used. The other randomisations have
a quite large level of randomisation.
Table 2: Level of randomisation.
Formula n = 256
Shuffling (Ravi et al., 2020) (
n
2
!)
log
2
(n)
2
5729
RandHLOE ∼
√
n 2
7
RandRoot ∼
2
n
n
2
247
RandMulMask ∼ n
n/2
2
1024
RandRed n/2 2
7
We applied Belief Propagation on all randomisa-
tions of NTT and also on some combination of these
randomisations. These simulation results told us that
Shuffling, RandHLOE are the most efficient to pre-
vent Belief Propagation, since the number of correctly
guessed values with BP remains low.
Finally, when considering combination of ran-
domisations, we noticed that RandHLOE cannot
be combined with RandRoot, RandMulMask and/or
RandRed. The best approach combines Shuffling,
SECRYPT 2024 - 21st International Conference on Security and Cryptography
874

RandRoot and RandMulMask which has a high level
of randomisation, and even if the roots of unity can
be guessed from leakage they cannot be used to ap-
ply the attack since it is not possible to construct the
Belief Propagation graph of NTT.
REFERENCES
Bos, J. W., Ducas, L., Kiltz, E., Lepoint, T., Lyubashevsky,
V., Schanck, J. M., Schwabe, P., Seiler, G., and Stehl
´
e,
D. (2018). CRYSTALS - kyber: A cca-secure module-
lattice-based KEM. In 2018 IEEE European Sympo-
sium on Security and Privacy (EuroS&P), pages 353–
367. IEEE.
Cooley, J. and Tukey, J. (1965). An algorithm for the ma-
chine calculation of complex Fourier series. Mathe-
matics of Computation, 19:297–301.
Lyubashevsky, V., Peikert, C., and Regev, O. (2010). On
Ideal Lattices and Learning with Errors over Rings.
In EUROCRYPT 2010, volume 6110 of LNCS, pages
1–23. Springer.
Pearl, J. (1982). Reverend bayes on inference engines: A
distributed hierarchical approach. Probabilistic and
Causal Inference.
Primas, R., Pessl, P., and Mangard, S. (2017). Single-Trace
Side-Channel Attacks on Masked Lattice-Based En-
cryption. In CHES 2017, volume 10529 of LNCS,
pages 513–533. Springer.
Ravi, P., Poussier, R., Bhasin, S., and Chattopadhyay,
A. (2020). On configurable SCA countermeasures
against single trace attacks for the NTT - A perfor-
mance evaluation study over kyber and dilithium on
the ARM cortex-m4. In SPACE 2020, volume 12586
of LNCS, pages 123–146. Springer.
Regev, O. (2009). On lattices, learning with errors, random
linear codes, and cryptography. J. ACM, 56(6):34:1–
34:40.
Shor, P. (1999). Polynomial-Time Algorithms for Prime
Factorization and Discrete Logarithms on a Quantum
Computer. SIAM Rev., 41(2):303–332.
Veyrat-Charvillon, N., G
´
erard, B., and Standaert, F.
(2014). Soft analytical side-channel attacks. In ASI-
ACRYPT 2014, volume 8873 of LNCS, pages 282–
296. Springer.
Virtually Free Randomisations of NTT in RLWE Cryptosystem to Counteract Side Channel Attack Based on Belief Propagation
875
