
Random Forest Classification of Cognitive Impairment Using Digital
Tree Drawing Test (dTDT) Data
Sebastian Unger
1
, Zafer Bayram
2
, Laura Anderle
2
and Thomas Ostermann
1
1
Department of Psychology and Psychotherapy, Witten/Herdecke University,
Alfred-Herrhausen-Str. 50, 58448 Witten, Germany
2
Department of Informatics and Communication, Westphalian University of Applied Science,
Neidenburger Str. 43, 45897 Gelsenkirchen, Germany
Keywords: Digital Tree Drawing Test, Cognitive Impairment, Mental Disorders, Classification, Random Forest.
Abstract: Early detection and diagnosis of dementia is a major challenge for medical research and practice. Hence, in
the last decade, digital drawing tests became popular, showing sometimes even better performance than their
paper-and-pencil versions. Combined with machine learning algorithms, these tests are used to differentiate
between healthy people and people with mild cognitive impairment (MCI) or early-stage Alzheimer's disease
(eAD), commonly using data from the Clock Drawing Test (CDT). In this investigation, a Random Forest
Classification (RF) algorithm is trained on digital Tree Drawing Test (dTDT) data, containing socio-medical
information and process data of 86 healthy people, 97 people with MCI, and 74 people with eAD. The results
indicate that the binary classification works well for homogeneous groups, as demonstrated by a sensitivity
of 0.85 and a specificity of 0.9 (AUC of 0.94). In contrast, the performance of both binary and multiclass
classification degrades for groups with heterogeneous characteristics, which is reflected in a sensitivity of
0.91 and 0.29 and a specificity of 0.44 and 0.36 (AUC of 0.74 and 0.65), respectively. Nevertheless, as the
early detection of cognitive impairment becomes increasingly important in healthcare, the results could be
useful for models that aim for automatic identification.
1 INTRODUCTION
Early detection and diagnosis of dementia, especially
in its early stages, is a major challenge in medical
research and practice (Yamasaki & Ikeda, 2024).
Traditional methods such as Shulman's Clock
Drawing Test (CDT) have proven useful for detecting
moderate to severe dementia but show limitations in
identifying mild cognitive impairment (MCI, Huang
et al., 2023).
In this context, digital drawing tests have become
more popular. By using a tablet and a pressure-
sensitive stylus, patients are asked to create drawings
on a tablet, which requires a complex interplay of
different cognitive abilities. Examples of such
drawing tests (see Figure 1 and Figure 2) include the
CDT (CDT, Yuan et al., 2021), the Spiral Drawing
Test (SDT, Fujiwara et al., 2023), and the digital Tree
Drawing Test (dTDT, Robens et al., 2019). The
benefits of those tests are that they create a less
stressful situation for the patient through creative
image design and freer presentation options, but also
use modern software for data collection, evaluation,
and statistical analyses of the complete drawing
process. This opens the potential to determine the
severity of dementia from a more patient-oriented
perspective and to enable an art-based but at the same
time reliable screening for patients with MCI and
early-stage Alzheimer's disease (eAD).
Figure 1: Examples of the Clock Drawing Test (left; Yoon
& Ahn, 2023) and the Spiral Drawing Test (right; Müller et
al., 2017).
Unger, S., Bayram, Z., Anderle, L. and Ostermann, T.
Random Forest Classification of Cognitive Impairment Using Digital Tree Drawing Test (dTDT) Data.
DOI: 10.5220/0012859100003756
In Proceedings of the 13th International Conference on Data Science, Technology and Applications (DATA 2024), pages 585-592
ISBN: 978-989-758-707-8; ISSN: 2184-285X
Copyright © 2024 by Paper published under CC license (CC BY-NC-ND 4.0)
585

Thus, digital drawing tests not only have become
a promising tool in different areas of health services,
but also show comparable or sometimes even superior
performance than their paper-and-pencil versions,
according to recent systematic reviews and meta-
analyses of screening studies on MCI (Chan et al.,
2021; Ding et al., 2022). At the same time, the
digitization of these tests enables the combination of
process data with machine learning algorithms.
Currently, the CDT data is commonly used for
classification tasks (Binaco et al., 2020; Jimenez-
Mesa et al., 2022). The same applies when dealing
with SDT data (Akyol, 2017; Fahim et al., 2021).
However, with regard to the dTDT data, only a few
approaches exist, which could be due to the
complexity of data. While drawing tests such as the
CDT or the SDT mainly focus on graphomotoric
aspects (i.e., drawing movement), processing aspects
(i.e., time of completion and speed), and spatial
reasoning (deviation from a given form), the dTDT
also includes texture features (e.g., the use and change
of colors or stroke width).
Results, which were obtained by using a logistic
regression model (Robens et al, 2019), show that the
research with dTDT data is worth continuing: Firstly,
patients, suffering on cognitive impairments, have a
tendency to draw smaller and simpler images, which
were not positioned centrally on the drawing surface.
Secondly, a lack of variety in the selection of colors
and line widths was observed, which could indicate a
limited creative decision-making ability. Thirdly, the
movements of the pencil were less fluid and less
coordinated, sometimes even fleeting with a tendency
towards increased movements in the air. And finally,
a reduced speed when drawing, a delayed start to the
drawing process, and longer pauses when not drawing
were observed.
This investigation aims to extend the analyses of
Robens et al. (2019) by using a Random Forest
Classification (RF) model for predicting cognitive
impairment. RF was chosen because it already proved
to be adequate for handling dTDT data when applied
in binary classification models (Li et al., 2022). In
contrast to these two previous studies, not only the
binary classification is investigated here, but also a
first step towards a multiclass classification. Such
multiclass model would be beneficial for the
classification of impairments in clinical practice, as
the prediction would not depend on the model
selected according to the given circumstances, i.e.,
the experience of the medical professional and the
symptoms of a patient.
2 MATERIAL AND METHODS
2.1 Dataset
The dataset initially contains 66 numeric features of
257 people who were asked to draw a tree, similar to
Koch's tree test (Koch, 1952). In contrast to Koch's
tree test, these people had to draw the tree digitally
and were not bound by the requirement to draw a fruit
tree (see Figure 2 for an example).
The process data recorded during the drawing
make up the majority of the initial features. Other
features include socio-medical information, i.e., age,
gender, and the score of the Mini-Mental Status
Examination (MMSE) questionnaire. The feature
describing the people's cognitive health condition
assessed by medical professionals is used as outcome.
With this, the people can be divided into three groups:
a healthy control group (HC, 86 people), a group with
MCI (97 people), and a group with eAD (74 people).
The MCI and eAD group can also be viewed as a
combined group: the cognitive impaired group, which
is the opposite of the healthy control group (nonHC,
171 people).
Figure 2: Example of a digital tree drawing taken from
(Robens & Ostermann, 2020).
The socio-medical information of the three
groups is given in Table 1, revealing some significant
differences. Looking at the gender balance, male
participants are dominant in the HC group, while
female participants are the majority of the other two
groups, ranging from 53.1 % in the MCI group to
70.3 % in the eAD group. There are also imbalances
between the groups with respect to age and
educational years. Patients in the nonHC group were
significantly older than those in the HC group.
Moreover, participants in the HC group had more
educational years (14.0 years) than those in the MCI
(12.9 years) and eAD group (11.1 years).
DATA 2024 - 13th International Conference on Data Science, Technology and Applications
586
To enhance the dataset and compensate for the
imbalances, further features, e.g., image colors or
texture characteristics, were extracted from the tree
images. These features were taken from the findings
of previous studies, investigating cognitive condition
(Ostermann et al., 2020; Robens et al., 2020). In
addition, features that are easy to calculate were
added, e.g., image size, ratio between image and
screen, or center of mass. At the end, there were a
total of 22 new features that, together with the others,
form the basis for possible predictors.
Table 1: Socio-medical information of the participants
subdivided by their cognitive health condition (MMSE:
Mini-Mental Status Examination; M: Mean; SD: Standard
deviation; *: significant differences between the groups).
HC MCI eAD
Number 86 97 74
Gender*
34 (39.5 %)
52 (60.5 %)
52 (53.6 %)
45 (46.4 %)
52 (70.3 %)
22 (29.7 %)
Female
Male
A
g
e*
64.9 ± 10.4
64
68.1 ± 12.0
70
73.6 ± 11.1
75
M ± SD
Median
Education*
14.0 ± 3.0
13
12.9 ± 2.8
12
11.1 ± 3.1
11
M ± SD
Median
MMSE*
29.2 ± 0.9
29
26.3 ± 2.1
26
22.1 ± 3.0
22
M ± SD
Median
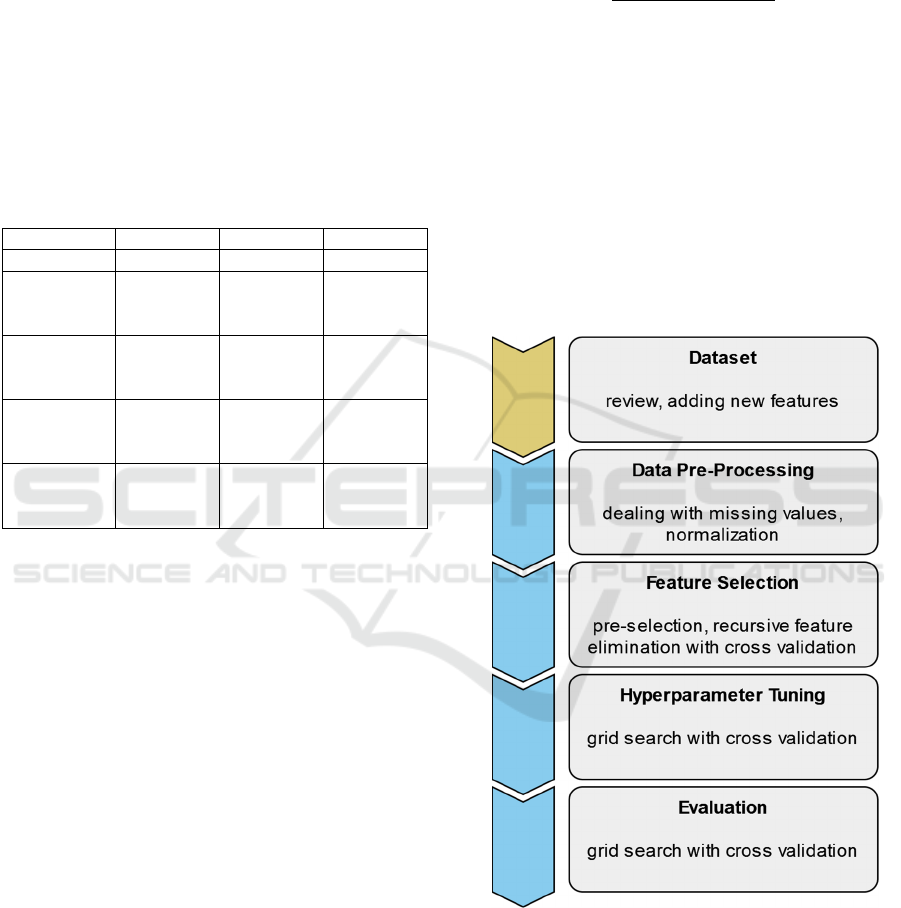
2.2 Process Flow
The process flow for developing the binary and
multiclass models consisted of four steps, whereby
the dataset with the initial features served as the basis
(Figure 3). First, the data set was prepared for training
the models. This was followed by the selection of the
relevant features. Once these were determined, the
models were optimized by tuning the
hyperparameters. Finally, the models were evaluated
with unseen test data.
Since feature selection (except pre-selection) and
model evaluation are intentionally randomized steps,
they were repeated 20 times. Only the split of the
dataset was controlled at the pre-processing step by
setting a seed, which shall lead to comparable results.
2.2.1 Data Pre-Processing
First, the dataset was checked for missing values. If
values were missing, the person and all according
data were removed from the dataset. After that, the
features were normalized so that the models could
process the dataset better. Normalization can be done
with various methods. This investigation uses a min-
max approach, which achieves comparatively good
results by rescaling the features into a new range of
values (Jayalakshmi & Santhakumaran, 2011). The
following formula expresses the used scaling:
𝑍
,
𝑋
,
min
𝑋
max
𝑋
min𝑋
(1
)
With this scaling, each value X
i,j
of a feature i
becomes a value Z
i,j
between 0 and 1. The functions
min and max denote the minimum and maximum
values of feature i.
After normalization, the dataset was divided into
two parts using a fixed seed. The first part was used
to train the models and the second part to test the
models. The ratio of training data and test data was
80:20. All the subsequent steps were performed with
this dataset split to ensure that the same data is always
used for training and that the data for evaluation has
never been seen before.
Figure 3: Process flow of model development, starting with
the dataset itself, through pre-selection to evaluation.
2.2.2 Feature Selection
In the first step of feature selection, the 66 initial
features were pre-selected to a total of 19 using a list
created by art therapists specialized in dementia
Random Forest Classification of Cognitive Impairment Using Digital Tree Drawing Test (dTDT) Data
587

(Robens et al., 2019). The 22 newly added features
remained unaffected by this reduction.
In the second step, a recursive feature elimination
approach with a 10-fold cross-validation (RFECV)
were used. The RF algorithm wrapped by the RFECV
were used to determine the features within the
training data. The approach identifies relevant
features by using a subset of all possible feature
combinations (2
n
- 1), starting with all features and
successively reducing the number of features. The
relevance was then indicated by ascending numbers,
whereby relevant features that have been selected
were marked.
In a third step, the features from the second step
were further viewed in accordance with their
contribution to the model’s accuracy, which was
indicated by the number of selected features in
addition to their ranking. Therefore, a feature was
eliminated if it only contributes with many other
features. This was to ensure that the most relevant
features (frequent occurrence plus high rank) were
identified as predictors for the classification task.
2.2.3 Hyperparameter Tuning
After the most relevant features were selected, the
hyperparameters of the RF models for the binary and
multiclass classification had to be tuned to further
improve the models’ accuracy. This was done using a
grid search approach, again, with 10 folds for cross-
validation (GSCV).
Seven hyperparameters (n_estimators,
max_depth, min_samples_split, min_samples_leaf,
max_features, bootstrap, and class_weight) were
tuned, starting with a wide range of values. The range
then was optimized step by step until no further
improvement in accuracy could be observed.
2.2.4 Evaluation
For the evaluation, the RF models were also trained
with the 10-fold GSCV. After training, the RF models
received the test data the first time to perform their
prediction.
Accuracy, precision, sensitivity, specificity, and
F1-score were used to assess the performance of the
models. Moreover, the diagnostic power of the
selected features was analyzed using the areas under
curve (AUC). The interpretation is as follows (Polo
& Miot, 2020):
worthless: 0.6 - 0.7;
poor: 0.7 - 0.8;
good: 0.8 - 0.9;
excellent: > 0.9.
3 RESULTS
3.1 Data Pre-Processing
When checking the dataset for missing values, only
one value and therefore one person was removed
from the dataset, leaving 256 people for the model
development. The subsequent split of the dataset into
training and test data resulted in 204 and 52 people,
respectively.
3.2 Feature Selection
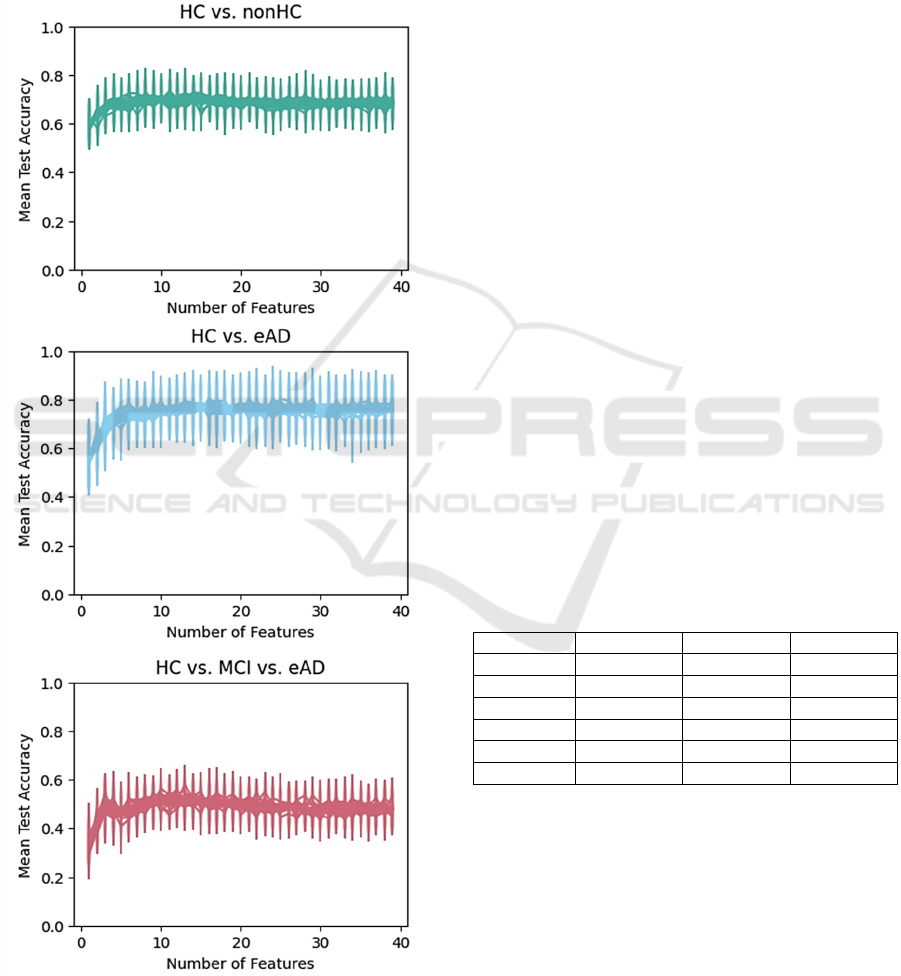
The visual output (Figure 4) of the RFECV indicates
that the optimal number of features for all three
models is probably in the lower decimal range. From
a value of around 15, all models appear to stagnate,
which could indicate overfitting. Therefore, between
10 and 15 individual features seems to be optimal for
each model.
When looking at the quantitative output of the
RFECV, similarities can be observed. 15.45 ± 8.48
features are used to classify the HC and nonHC
groups, 23.35 ± 7.71 for HC and eAD groups, and
14 ± 4.95 for HC, MCI, and eAD groups. Except for
the classification of HC and eAD, the optimal number
of features falls within the previously assumed range
due to the standard deviation.
Table 2: Features remaining for model evaluation (B1:
binary classification of HC and nonHC; B2: binary
classification of HC and eAD; M: multiclass classification
of HC, MCI, and eAD).
Feature B1 B2 M
Color Chan
g
es X X
Color Count X
Contrast X X
Duration (ms) X X
Image Width X X X
Not Paintin
g
(
%
)
X X X
Pa
g
e Relation X X
Paintin
g
(
ms
)
X
Pen Up Count X X X
Pen Up Pen Down Relation X X X
Pen Up Stroke Length X X
Pressure Velocit
y
RelationX X X
Stroke Chan
g
es X X
Strokes Per Minute X X X
Velocity Mean X X X
Volatile Motion Mean X X X
All features considered relevant are listed in Table 2.
There are 12 features for the two binary classification
models and 14 for the multiclass classification model.
Specific colours (e.g., red, green, or yellow) and the
DATA 2024 - 13th International Conference on Data Science, Technology and Applications
588
center of mass of the image (i.e., x and y coordinate
of the pixel) were excluded in the feature selection
process mainly because they were only partially used
to train the RF models and had less importance when
they appeared. Moreover, socio-medical information,
i.e., age, educational years, gender, and other mental
health related data such as MMSE or data from CDT,
were also excluded.
Figure 4: Results of the RFECV. For each model, the
diagrams show the correlation between the number of
features and their corresponding accuracy.
3.3 Hyperparameter Tuning
Tuning the hyperparameter resulted in a significant
improvement in accuracy for each model. It was best
with the multiclass model. Its accuracy during feature
elimination was 0.49 ± 0.04, with a peak of about
0.59 after tuning. The two binary classification
models showed a similarly good improvement. The
accuracy increased from 0.68 ± 0.02 to about 0.74 in
the classification of HC and nonHC and from
0.75 ± 0.04 to about 0.82 in the classification of HC
and eAD.
3.4 Evaluation
The binary model to classify HC and nonHC showed
the second best results. It had a mean accuracy of
74 % and was quite successful at detecting the non-
healthy people (sensitivity) but lacked in detecting the
healthy ones (specificity) as given in Table 3. Among
the most important features were “Velocity Mean”,
“Pen Up Count”, and “Strokes Per Minute”.
The distinction between HC and eAD group was
most successful. The model’s mean accuracy was
88 %. In detail, the model detected healthy people
similarly well as people with eAD, shown by a mean
specificity of 90 % and a mean sensitivity of 87 %,
respectively. Also here, “Velocity Mean” was one of
the most important features. In addition, “Color
Changes” and “Pressure Velocity Relation” had a
strong impact on the model.
Table 3: Metrics of the GSCV represented as mean and
standard deviation (B1: binary classification of HC and
nonHC; B2: binary classification of HC and eAD; M:
multiclass classification of HC, MCI, and eAD).
B1 B2 M
Accuracy 0.74 ± 0.02 0.88 ± 0.01 0.22 ± 0.01
Precision 0.74 ± 0.03 0.87 ± 0.01 0.4 ± 0.02
Sensitivit
y
0.91 ± 0.02 0.85 ± 0 0.29 ± 0.32
S
p
ecificit
y
0.44 ± 0.03 0.9 ± 0.02 0.36 ± 0.01
AUC 0.74 ± 0.01 0.94 ± 0 0.65 ± 0.01
F1-Score 0.68 ± 0.02 0.87 ± 0.01 0.29 ± 0.01
As presented in Table 3, the multiclass model was
the worst of the three, although “Velocity Mean” had
the most impact as in the two binary classifications.
In general, all features had a relatively equal impact
on the model, which was found by looking at their
importances. More importantly, the model showed
great difficulties in classifying the MCI group,
resulting in a mean accuracy of 22 %, which was even
below chance (33.3 %). This is similar in terms of
specificity and sensitivity.
Random Forest Classification of Cognitive Impairment Using Digital Tree Drawing Test (dTDT) Data
589
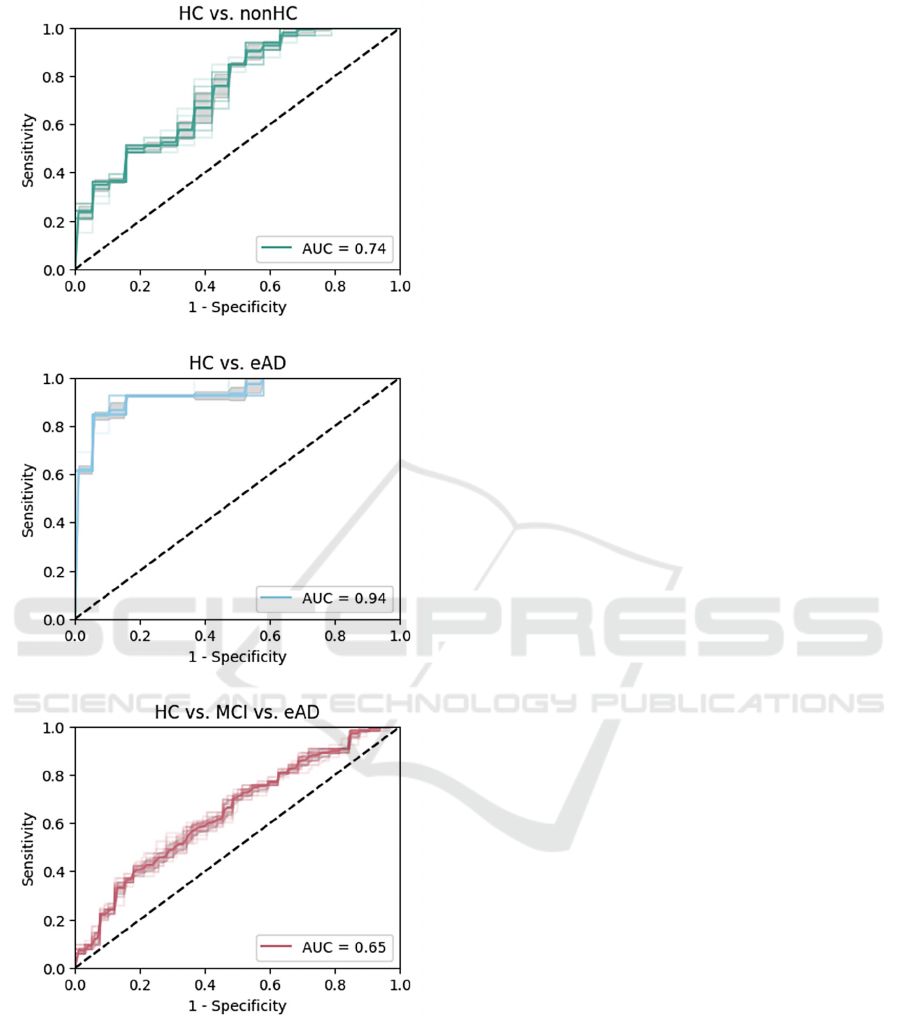
Figure 5: ROC curve for binary and multiclass
classification. For each model, the diagrams show the
correlation between the sensitivity (true positive rate) and
the corresponding 1 – specificity (false positive rate).
Receiver operating characteristic (ROC) curves in
Figure 5 display the models’ performance for the
binary and multiclass classification. With mean
AUCs of 0.74 and 0.94 for the binary models, the
results can be considered as in need of improvement
and almost perfect, respectively. The mean AUC of
0.65 for the multiclass model is unfortunately not
sufficient.
4 DISCUSSION
This investigation describes the use of three RF
classification models for a dataset of healthy and
cognitive impaired people that completed the dTDT.
The features of the dataset were first reduced in
accordance with the similar study of Robens et al.
(2019). The remaining 19 features (22 including age,
gender, and educational years) were then expanded
by features that could easily be calculated and
features based on other findings of cognitive
condition (Ostermann et al., 2020; Robens et al.,
2020).
The evaluation of the trained models reveals that
the distinction between the HC group and the group
with eAD works quite well. The result is comparable
to previous studies on dTDT data (Li et al., 2022;
Robens et al., 2019), indicating a functional and valid
model. In contrast to that, no similar result could be
achieved with the distinction between the HC group
and the nonHC group. The model’s performance is
significantly worse as in the mentioned two studies,
but comparable with the result of a study on digitized
CDT data (Jimenez-Mesa et al., 2022).
Although the available features and selection
process were almost identical to the study of Robens
et al. (2019), the limiting factor here might be that the
dataset is too heterogeneous and too imbalanced. On
the one hand, mean MMSE scores between HC and
MCI and between MCI and eAD overlap (Table 1).
On the other hand, all three groups had similarly long
educational years. Since MMSE is a marker for
cognitive condition (Dellasega & Morris, 1993) and
education has a protective effect on developing
cognitive impairment such as AD (Sando et al.,
2008), the process data could be disturbed by these
circumstances, making a clear distinction not
possible. According to Wenner et al. (2020),
manipulating the training data and adjusting the
classifier could improve the classification with an
imbalanced dataset, which might be considered in
future studies.
For the low performance of the multiclass model,
which was below chance, the same limitations and
solutions mentioned for the binary classification
could be applied here. Another improvement might
be utilizing a model that specifically is designed for
the classification of trees based on their size
(Setiawan et al., 2020). Nevertheless, there is still a
DATA 2024 - 13th International Conference on Data Science, Technology and Applications
590

need for further investigation, because even if it was
done with dCTD data, a prediction with a multiclass
classification can be better than by chance (Binaco et
al., 2020).
5 CONCLUSIONS
Early detection of cognitive impairment is an
increasingly important field in healthcare. Therefore,
the idea of combining machine learning algorithms
with digital drawing tasks to enable automatic
identification of cognitive impairments has been
explored for some time. With the here presented
results, which vary strongly depending on the
classification task, new insights could be provided for
handling dTDT data. Whereas the binary
classification of homogeneous and sufficiently
distinct groups works well, both binary and multiclass
classification seem to have their difficulties if the
characteristics that form a group are not distinct
enough.
ACKNOWLEDGEMENTS
This work was financially supported by a grant of the
Software AG Foundation, Darmstadt, Germany.
REFERENCES
Akyol, K. (2017). A study on the diagnosis of Parkinson’s
disease using digitized wacom graphics tablet dataset.
Int J Inf Technol Comput Sci, 9, 45-51.
Binaco, R., Calzaretto, N., Epifano, J., McGuire, S., Umer,
M., Emrani, S., Wasserman, V., Libon, D. J., & Polikar,
R. (2020). Machine learning analysis of digital clock
drawing test performance for differential classification
of mild cognitive impairment subtypes versus
Alzheimer’s disease. Journal of the International
Neuropsychological Society, 26(7), 690-700.
Chan, J. Y., Bat, B. K., Wong, A., Chan, T. K., Huo, Z.,
Yip, B. H., Kowk, T.C.Y., & Tsoi, K. K. (2021).
Evaluation of digital drawing tests and paper-and-
pencil drawing tests for the screening of mild cognitive
impairment and dementia: a systematic review and
meta-analysis of diagnostic studies. Neuropsychology
Review, 1-11.
Dellasega, C., & Morris, D. (1993). The MMSE to assess
the cognitive state of elders. Journal of Neuroscience
Nursing, 25(3), 147-152.
Ding, Z., Lee, T. L., & Chan, A. S. (2022). Digital cognitive
biomarker for mild cognitive impairments and
dementia: a systematic review. Journal of clinical
medicine, 11(14), 4191.
Fahim, M. I., Islam, S., Noor, S. T., Hossain, M. J., & Setu,
M. S. (2021). Machine learning model to analyze
telemonitoring dyphosia factors of Parkinson’s disease.
International Journal of Advanced Computer Science
and Applications, 12(8).
Fujiwara, K., Matsuhashi, K., & Mitobe, K. (2023).
Detection of Mild Cognitive Impairment Using a Spiral
Drawing Test. Journal of Advanced Computational
Intelligence and Intelligent Informatics, 27(5), 907-
914.
Huang, Y., Pan, F. F., Huang, L., & Guo, Q. (2023). The
value of clock drawing process Assessment in
Screening for mild cognitive impairment and
Alzheimer’s dementia. Assessment, 30(2), 364-374.
Jayalakshmi, T., & Santhakumaran, A. (2011). Statistical
normalization and back propagation for classification.
International Journal of Computer Theory and
Engineering, 3(1), 1793-8201.
Jimenez-Mesa, C., Arco, J. E., Valentí-Soler, M., Frades-
Payo, B., Zea-Sevilla, M. A., Ortiz, A., Ávila-
Villanueva, M., Castillo-Barnes, D., Ramírez, J., del
Ser-Quijano, T., Carnero-Pardo, C., & Górriz, J. M.
(2022). Automatic classification system for diagnosis
of cognitive impairment based on the clock-drawing
test. In International Work-Conference on the Interplay
Between Natural and Artificial Computation (pp. 34-
42). Cham: Springer International Publishing.
Li, J., Yang, J., Yang, J., Yang, H., Lan, M., & Gao, L.
(2022, November). Characterizing cognitive
impairment through drawing features extracted from
the Tree Drawing Test. In 2022 7th International
Conference on Intelligent Informatics and Biomedical
Science (ICIIBMS) (pp. 341-347). IEEE.
Koch, C. (1952). The Tree Test: The Tree-drawing Test as
an Aid in Psychodiagnosis. Berne: Hans Huber
Publishing
Müller, S., Preische, O., Heymann, P., Elbing, U., & Laske,
C. (2017). Increased diagnostic accuracy of digital vs.
conventional clock drawing test for discrimination of
patients in the early course of Alzheimer’s disease from
cognitively healthy individuals. Frontiers in aging
neuroscience, 9, 101.
Ostermann, T., Robens, S., Heymann, P., Unger, S., Müller,
S., Laske, C., & Elbing, U. (2020). Analysis of the Use
of Colour for Early Detection of Dementia. In
Proceedings of the 13th International Joint Conference
on Biomedical Engineering Systems and Technologies
(BIOSTEC 2020) – HEALTHINF (pp. 316-320).
Polo, T. C. F., & Miot, H. A. (2020). Use of ROC curves in
clinical and experimental studies. Jornal vascular
brasileiro, 19, e20200186.
Robens, S., Heymann, P., Gienger, R., Hett, A., Müller, S.,
Laske, C., Loy, R., Ostermann, T., Elbing, U. (2019).
The digital tree drawing test for screening of early
dementia: an explorative study comparing healthy
controls, patients with mild cognitive impairment, and
patients with early dementia of the Alzheimer type.
Journal of Alzheimer's Disease, 68(4), 1561-1574.
Random Forest Classification of Cognitive Impairment Using Digital Tree Drawing Test (dTDT) Data
591

Robens, S., & Ostermann, T. (2020). Der digitale
Baumzeichentest–Ein kunsttherapeutischer Ansatz für
das Demenz-Screening. Zeitschrift für
Komplementärmedizin, 12(05), 24-28.
Robens, S., Ostermann, T., Heymann, P., Müller, S., Laske,
C., & Elbing, U. (2020). Comparison of texture features
and color characteristics of digital drawings in
cognitive healthy subjects and patients with amnestic
mild cognitive impairment or early alzheimer’s
dementia. In Biomedical Engineering Systems and
Technologies: 12th International Joint Conference (pp.
412-428). Springer International Publishing.
Sando, S. B., Melquist, S., Cannon, A., Hutton, M.,
Sletvold, O., Saltvedt, I., White, L. R., Lydersen, S., &
Aasly, J. (2008). Risk‐reducing effect of education in
Alzheimer's disease. International Journal of Geriatric
Psychiatry: A journal of the psychiatry of late life and
allied sciences, 23(11), 1156-1162.
Setiawan, I., Yusnitasari, T., Nurhady, H., & Hizviani, N.
V. (2020). Implementation of convolutional neural
network method for classification of Baum Test. In
2020 fifth international conference on informatics and
computing (ICIC) (pp. 1-6). IEEE.
Wenner, M., Hibert, C., Meier, L., & Walter, F. (2020).
Near real-time automated classification of seismic
signals of slope failures with continuous random
forests. Natural Hazards and Earth System Sciences
Discussions, 2020, 1-23.
Yamasaki, T., & Ikeda, T. (2024). Advances in Research on
Brain Health and Dementia: Prevention and Early
Detection of Cognitive Decline and Dementia. Brain
Sciences, 14(4), 353.
Yoon, H., & Ahn, M. (2023). Quantification of Movement
Error from Spiral Drawing Test. Sensors, 23(6), 3043.
Yuan, J., Libon, D. J., Karjadi, C., Ang, A. F., Devine, S.,
Auerbach, S. H., Au, R., & Lin, H. (2021). Association
between the digital clock drawing test and
neuropsychological test performance: large
community-based prospective cohort (Framingham
heart study). Journal of Medical Internet Research,
23(6), e27407.
DATA 2024 - 13th International Conference on Data Science, Technology and Applications
592
