
A Model of the Control System of a Carbon Dioxide Gas Turbine in
Supercritical Condition
Marcin Zawadzki, Jarosław Milewski
a
and Arkadiusz Szczęśniak
Institute of Heat Engineering, Faculty of Power and Aeronautical Engineering, Warsaw University of Technology,
21/25 Nowowiejska Street, 00-665 Warsaw, Poland
Keywords: Gas Turbine, Closed Cycle, Power Control, Carbon Dioxide, Supercritical State, Model, GateCycle.
Abstract: The primary goal of the paper was to develop a model for a supercritical carbon dioxide gas turbine. The
model was built using the GateCycle program It is designed for potential implementation in emerging
Concentrating Solar Plants, with a focus on simple yet efficient construction in the recuperation model.
Analyses were conducted on three types of power control systems: bypass, inventory, and turbine inlet
temperature-based, using the Lee-Kesler real gas model for calculations. Key mathematical formulas used by
the program are cited, and results are thoroughly analyzed and presented in charts. In conclusion, a
combination of bypass and inventory control systems is recommended.
1 INTRODUCTION
The global energy industry is currently moving
toward renewable energy sources. The main obstacle
standing in its way is the heavy dependence of energy
production on non-anthropogenic factors. Various
strategies could be applied, such as the integration of
Renewable Energy Sources (RES) with electrolysers
for synthetic fuel generation (Milewski et al., 2024)
or combining RES with traditional technologies. An
interesting idea is the use of gas turbines operating in
closed circuits. These systems show good
controllability, which can help solve the outlined
problem. The closed-cycle Gas Turbine (GT) could
serve as a power conversion system for non-CO2
emission energy sources (Olumayegun, Wang and
Kelsall, 2016) such as nuclear reactors, concentrated
solar power, biomass, geothermal, and fuel cells
(Kim, Kim and Favrat, 2012).
Contrary to appearances, this is not a new,
innovative technology, as the first concepts for the
construction of closed-cycle gas turbine systems
appeared as early as the 1930s (Miller, 1984). The
most likely reason for the stagnation in the
development of this area was the rapid growth of
open-system gas turbine systems. Open-circuit
systems dominated the gas turbine market after the
a
https://orcid.org/0000-0003-1215-1802
use of blade cooling technology, which enabled
turbine inlet temperatures of 1,700°C, allowing them
to achieve significantly higher efficiency than closed-
circuit systems. Thanks to the development of high-
temperature-resistant materials and the emergence of
new potential applications, closed-cycle gas turbine
systems are once again becoming the focus of
research centers and are poised to enter the industrial
market. Due to their nature, the opportunity for
commercial implementation of closed-loop gas
turbine systems is in Concentrating Solar Plants
(CSP) in Solar Tower (ST) systems (Stein and Buck,
2017; Merchán et al., 2021) . This technology is
recognized as a renewable and carbon-neutral source
of energy (Wu et al., 2021) . For this reason, the main
parameters of the system have been selected so that it
can be implemented in newly built power plants of
this type. The world's largest Solar Tower
Concentrated Solar Plant has a net capacity of 377
MW (Boretti, Castelletto and Al-Zubaidy, 2019).
State-of-the-art technologies using molten salts allow
working medium temperatures of 550°C and energy
storage for several hours.
The optimization of the system with
recompression was performed by Sarkar et al.
(Sarkar and Bhattacharyya, 2009) . The authors
indicated that the maximum efficiency improvement
using reheating is determined to be 3.5% under
Zawadzki, M., Milewski, J. and Szcze¸
´
sniak, A.
A Model of the Control System of a Carbon Dioxide Gas Turbine in Supercritical Condition.
DOI: 10.5220/0012866200003758
Paper published under CC license (CC BY-NC-ND 4.0)
In Proceedings of the 14th International Conference on Simulation and Modeling Methodologies, Technologies and Applications (SIMULTECH 2024), pages 443-455
ISBN: 978-989-758-708-5; ISSN: 2184-2841
Proceedings Copyright © 2024 by SCITEPRESS – Science and Technology Publications, Lda.
443

optimum conditions. An in-depth analysis of the topic
was reported by Dostal et al. (Dostal, Driscoll and
Hejzar, 2004)
, who concluded that the recompression
cycle offers the best efficiency and retains its
simplicity. Intercooling, however, is less appealing
for this cycle type because it only provides a slight
boost in efficiency. Reheating holds more promise,
though it is suitable solely for indirect cycles.
Ma et al. (Ma et al., 2024)
developed a model of
a 5 MW S-CO2 recompression cycle oriented toward
operational control. The model includes validated
dynamic models of the following components:
printed circuit heat exchangers, compressors, and gas
turbines. The validated control strategies for the
system involve using a cooling water controller to
keep the compressor inlet temperature above CO2's
critical temperature (304.13 K). They also adjust the
circulating mass flow rate to change output power and
control the exhaust gas flow rate to maintain safe
turbine inlet temperatures. Performance comparisons
between PI (Proportional-Integral) controllers (tuned
via SIMC rule) and ADRC (Active Disturbance
Rejection Control) controllers (tuned via bandwidth
method) show that both effectively manage operating
conditions and suppress exhaust fluctuations.
However, ADRC controllers outperform by reducing
settling time by 55% in load-tracking scenarios.
Dario et al. (Alfani et al., 2021)
optimized various
sCO2 cycles for waste heat recovery. The simple
recuperative cycle with bypass was selected as the
optimal configuration. The authors revealed that the
implementation of an external CO2 storage tank,
which enables varying the CO2 inventory in the
system, beneficially influences the system's
efficiency during part-load operation. Specifically,
when dealing with low flue gas mass flows—at 30%
of the nominal rate—a 20% enhancement in power
generation is achievable compared to strategies where
the CO2 inventory remains unchanged.
The purpose of this paper is the theoretical
analysis of various methods of power control of a
fabricated gas turbine model with CO2 with
supercritical parameters as the working medium,
together with a review of current research on the
systems considered. Three basic control methods will
be compared with each other: bypass, by
displacement, and by temperature. Despite numerous
studies related to the subject under discussion, the
problem under consideration has not yet been
sufficiently addressed.
The paper presents a novel model of a
supercritical carbon dioxide gas turbine designed for
potential implementation in emerging Concentrating
Solar Plants. The key contributions of this paper
include the development of a comprehensive model
using the GateCycle program, focusing on simplicity
and efficiency in the recuperation model. The model
integrates existing power control methods, namely
bypass, inventory, and turbine inlet temperature-
based controls, and evaluates their effectiveness using
the Lee-Kesler real gas model for calculations. One
significant contribution is the recommendation of a
combined approach of bypass and inventory control
systems, which balances the need for quick
responsiveness and maintaining high efficiency. The
paper thoroughly analyzes these control systems,
providing detailed mathematical formulas and results
presented in various charts. Additionally, the model's
adaptability to high-pressure and high-temperature
conditions using the Lee-Kesler equations marks an
advancement in accurately simulating supercritical
carbon dioxide gas turbine systems. This work paves
the way for integrating such advanced models into
next-generation renewable energy power plants,
specifically those utilizing solar energy, thus
contributing to the global shift towards sustainable
energy solutions.
The application of closed-cycle gas turbine
systems, especially those utilizing supercritical
carbon dioxide as the working medium, presents a
promising solution for integration into Concentrating
Solar Plants (CSP). These systems are particularly
suited for Solar Tower (ST) configurations, where
high operational temperatures and efficiency are
paramount. By leveraging the unique properties of
supercritical CO
2
, these turbines can achieve higher
efficiencies and better performance in CSP
applications compared to traditional working fluids.
This makes them an ideal choice for enhancing the
viability and sustainability of solar energy power
generation. Consequently, the implementation of
these advanced gas turbine systems in CSP not only
supports the drive towards renewable energy but also
addresses the need for efficient and reliable power
conversion technologies in solar energy applications.
The advancements in control strategies and system
optimization outlined in this paper further underscore
the potential of these technologies to play a critical
role in the future of renewable energy infrastructure.
2 THEORETICAL
BACKGROUND
One of the advantages of gas turbines in closed
systems is the ability to regulate power over a large
range with almost no drop in efficiency. The power
SIMULTECH 2024 - 14th International Conference on Simulation and Modeling Methodologies, Technologies and Applications
444
of the system depends on the mass flow, the turbine
inlet temperature (TIT), the gas temperature before
the compressor, the compression ratio, and the
efficiency. Control possibilities include the use of a
storage tank, bypass, or temperature control.
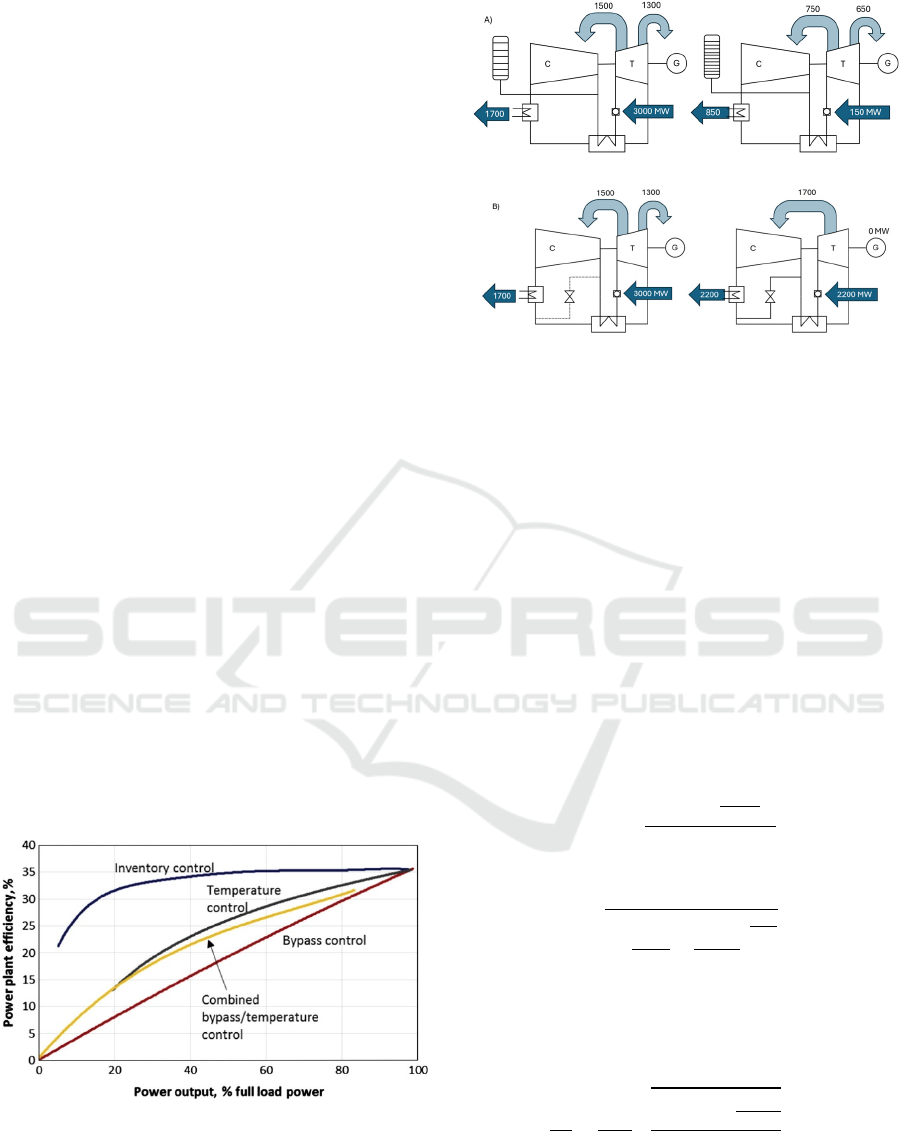
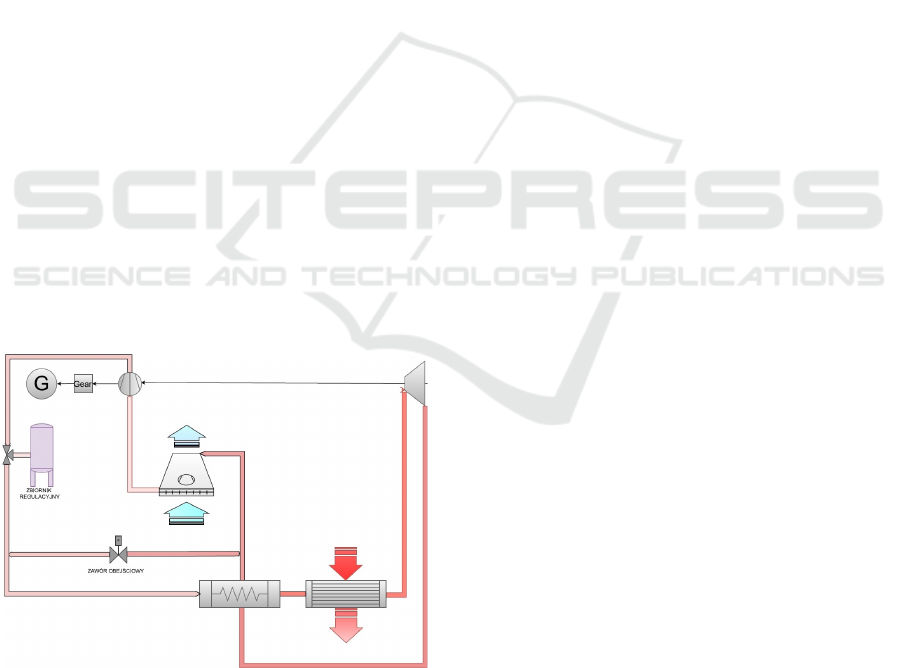
The most advantageous method is to change the
discharge by using a storage tank. This is called
discharge control or pressure control. When
decreasing from the current load, some of the gas is
diverted to the storage tank. This causes a decrease in
mass flow and pressure at the compressor inlet. As
power increases, gas is released from the tank into the
system. Within a large power range, this method
allows smooth control with a relatively small
decrease in efficiency—see Figure 1 , line "inventory
control." The downsides of this method are the
relatively slow response time and the need for large
storage tanks. For this reason, this method of
regulation should be abandoned in favor of the others
for larger power units. A schematic of the system with
applied mass flow control is shown in Figure 2 (a).
Another method is bypass control. It involves the
use of a bypass of the expander and the heat
exchanger with the upper heat source, reducing the
flow of gas through these components while leaving
the compressor unchanged. A schematic of the
system with bypass control is shown in Figure 2 (b).
The advantage of this solution is the ability to respond
almost immediately to rapid changes in power. The
major disadvantage, on the other hand, is the
significant drop in system efficiency during power
reduction.
The third method is upper source temperature
control. This is the slowest method presented but
provides higher efficiency at lower loads than bypass
control.
Figure 1: Effect of power regulation on efficiency
(Olumayegun, Wang and Kelsall, 2016).
Figure 2: Schematic of the power control system: (a)
method using a storage tank (b) bypass method.
2.1 Closed System of Gas Turbine
Figure 1 shows the dependence of system efficiency
as a function of load for the methods described. The
best solution is to use a combination of bypass
regulation, which would operate when
responsiveness is crucial, with regulation using a
regulating tank—slower, but allowing the system to
maintain a high level of efficiency.
When analyzing the operation of the system under
changed conditions, it is important to note the most
significant relationships describing it. When
controlling the system, the discharge pressure from
the compressor changes due to the forcing caused by
the turbine inlet. This forcing is determined by the
following relation:
𝐶𝑜𝑛𝑠𝑡𝑎𝑛𝑡=
𝑚
𝜅⋅
𝐴
⋅𝑃
(1)
Where:
𝜅=
𝑔⋅
𝛾
𝑅
⋅
2
𝛾1
(2)
The speed of the compressor also changes, which
can be determined by an algorithm using the flow
equation:
𝑛
𝑛
=
𝐶𝑆
𝐶𝑆
𝑇
⋅𝑍⋅
𝑀𝑊
𝑀𝑊
𝑇
⋅𝑍
(3)
Where the subscript D stands for design
parameters (design mode).
A Model of the Control System of a Carbon Dioxide Gas Turbine in Supercritical Condition
445

In situations where access to the compressor map
is impossible, its isentropic efficiency can be
calculated based on the equation:
η
=
η
⬚
1−SEC⋅
CS−CS
⬚
CS
⬚
⋅PF⋅
1−α⋅VEC
(4)
The above relationships are applicable to
GateCycle software and will be used to make the
model.
3 MODEL DEVELOPMENT
Research is based on the mathematical model of a
supercritical carbon dioxide gas turbine. The model
has been constructed in the GateCycle program,
which capabilities in reliability of simulations of are
confirmed by many papers such as e.g. (Malinowski,
Lewandowska and Giannetti, 2017; Ary Bachtiar and
Maryono, 2019; Hasananto, Darmadi and Yuliati,
2021). It provides accurate thermodynamic analysis,
integrates detailed component models, and allows for
precise performance predictions under various
operating conditions.
The model's parameters have been set so that it
could be implemented in emerging Concentrating
Solar Plants. The recuperation model has been
created for simplicity of construction while providing
high efficiency. Analyses have been performed on
three types of power control systems: bypass,
inventory, and turbine inlet temperature-based. Real
gas equations were used in the model. For
calculations in areas of very high pressures or
temperatures and around the critical point, these
equations may not provide sufficient quality results.
According to GE Energy, the Lee-Kesler equations
give the closest results for CO2 and air to VDI
Warmeatlas table data over a large range of pressures
and temperatures. For this reason, it was decided to
use this real gas model.
The disadvantage of the model is the inability to
simulate the molten salt compounds forming the
upper heat source. For this reason, it was described
as a water flow with the most relevant parameters the
same as the actual medium.
The main assumptions for the simulation have
been listed in Table 1.
Table 1: Main assumptions for model development.
Parameter Value
Temp. at inlet to compressor, °C 31
Pressure at inlet to compressor, MPa
7.4
Temp. at turbine inlet, °C 550
Pressure at turbine inlet, MPa 24
Mass flow rate of the medium, kg/s 500
Max. upper heat source temp,
°C
565
Ambient temp., °C 20
Real gas model
Lee-Kesler
model
A system with heat regeneration was chosen for
the simulations because of its relatively high
efficiency while keeping the system simple and
compact. The layout of the model implemented in
GateCycle is shown in Figure 3 and the main
operating parameters are shown in Table 2.
Table 2: Parameters of the examined cycle.
T p M H
K kPa Kg/s kJ/kg
1 347.82 24487.3 500 155.53
2 347.82 24487.3 500 155.53
3 569.95 24242.4 500 216.48
4 823.15 24000.0 500 535.28
5 686.25 7550.3 500 384.84
6 362.82 7474.7 500 9.11
7 362.82 7474.7 500 9.11
8 304.15 7400.0 500 187.35
9 293.15 101.3 500 4.25
10 351.82 100.31 500 63.81
11 838.14 4000.0 500 3592.77
12 669.94 3960.0 500 3208.89
The model consists of a compressor (C1 in Figure
4), which was simulated with the following settings
listed in Table 2.
Table 3: C1 compressor settings.
Parameter Value
Desired Isentropic Efficiency 0.82
Desired Outlet Pressure
24,487.297 kPa
Design Compressor RPM 3,000
Mechanical Efficiency 0.98
SIMULTECH 2024 - 14th International Conference on Simulation and Modeling Methodologies, Technologies and Applications
446

Figure 3: Scheme of the examined cycle.
The upper heat source was simulated by heat
exchanger HX1. The set parameters of the added
elements are given below:
• Design Method: Cold Side Outlet
Temperature
• Desired Cold Side Outlet Temperature:
823.15K
• Second Design Method: Pinch (Hot Out -
Cold In)
• Desired Pinch (Hot Out - Cold In): 100 K
• Demand Flow Method: Generate Hot Side
Demand Flow
• Cold Side Pressure Loss: 0.01
• Hot Side Pressure Loss: 0.01
• Limits:
• Minimum Overall Heat Transfer
Coefficient: 0.01
The EX1 turbine was attached to the system,
connected by a shaft to the compressor. The
parameters of the gas turbine were:
• Outlet Pressure: 7,550.25 kPa
• Desired Isentropic Efficiency: 0.9
The default setting is left: Calculate Flow Area
Using Inlet Pressure, Temperature, and Flow, which
will determine the area of the inlet channel, allowing
further off-design calculations. The definition of
isentropic efficiency is:
η
=
𝑊
𝑚ℎ
𝑚ℎ
𝑚ℎ
−
𝑚ℎ
(5)
where the subscripts denote: 0-inlet, 1-outlet, 2-
nozzle cooling, 4-rotor cooling, s-isentropic
conditions.
The lower source heat exchanger was simulated by
HX2 heat exchanger with the following settings:
• Design Method: Hot Side Outlet Temperature
• Desired Cold Side Outlet Temperature:
304.15 K
• Second Design Method: Pinch (Hot In - Cold
Out)
• Desired Pinch (Hot In - Cold Out): 11 K
• Demand Flow Method: Generate Cold Side
Demand Flow
• Hot Side Pressure Loss: 0.01
• Cold Side Pressure Loss: 0.01
• Number of HTX Passes: 40
• Limits:
• Minimum Overall Heat Transfer
Coefficient: 0.01
A bypass control system was attached to the model,
consisting of the DUCT1 flow valve, SP1 flow
distributor, and M1 mixer. Duct is an element that
allows modeling of pressure and temperature drops in
gas streams. A similar effect can be achieved with the
Flow Pressure-Temperature Modifier, which
additionally allows changing the flow rate.
SP1:
• Primary Port (S12) Control Method: Specify
Flow Fraction
• Primary Port Desired Fraction: 1
• Secondary Port (S13) Control Method:
Remainder Port
M1:
• Equalize Inlet Pressures Method: Equalize to
Pressure of Specified Port
A Model of the Control System of a Carbon Dioxide Gas Turbine in Supercritical Condition
447

• Controlled Inlet Port for Pressure: Primary
(S9)
DUCT1:
• Pressure Method Flag: Outlet Pressure
• Desired Exit Pressure: 7,474.74 kPa
As GateCycle does not allow the insertion of an
accumulation tank into the system, a Flow-Pressure-
Temperature Modifier was included to simulate it
behind the compressor. By forcing a specific flow
value, a change in tank filling is simulated.
During off-design operation, the speed of the
system changes under the influence of changes in the
parameters of the working medium, so a gearbox is
required to keep the generator synchronized with the
grid. It has been added to the model under the name
GEAR1. In the method used, power losses are
calculated using equations implemented in the
program. In the off-design mode, calculations of
gearbox efficiency are identical to those in the design
mode, so there is no need to change the settings of this
element for further calculations.
To carry out off-design simulations, new model
cases were created in which the following elements
were set for off-design calculations: EX1, HX1, HX2,
HX3, C1, GEN1. In addition, the following settings
were made.
HX2:
• Second Design Method: Hot Side Outlet
Temperature
• Desired Hot Side Outlet Temperature: 304.15
K
• Demand Flow Method: Generate Cold Side
Demand Flow
• Minimum Pinch Limit: 10 K
C1:
• Off Design Pressure Method: Flow Equation
with Flow, RPM (Revolutions Per Minute) or
CS and Pressure Input
• Desired Outlet Pressure: 24,487.972 kPa
• Off Design Flow/RPM Method: Accept
• Incoming Flow
• Minimum Compressor %CS: 40
• Off-Design Efficiency Method: Use Equation
to Calculate Isentropic Efficiency
HX1:
• Second Design Method: Cold Side Outlet
Temperature
• Desired Cold Side Outlet Temperature: 823.15
K
• Demand Flow Method: Generate Hot Side
Demand Flow
Off-design calculations were carried out to simulate
the three basic methods of power control: flow
change, bypass, and temperature change. Flow
change was induced using the FPT1 element by
changing the Desired Outlet Flow value in 5%
increments of the nominal flow. This method also
allowed the turbine to be topped off with a flow
higher than nominal. Bypass control was achieved by
changing the Primary Port Desired Fraction value at
the splitter, also in 5-percentage point steps. The
change in inlet temperature to the turbine was
achieved by changing the Desired Cold Side Outlet
Temperature in HX1, decreasing it, as in the previous
cases, also in 5-percentage point increments. The
results with analysis are presented in the following
sections.
4 RESULTS
After three series of calculations, the results from all
cases were collected and presented in graphs.
Figure 4
and Figure 5 how the change in system power as a
function of the change in flow through the turbine
(with bypass and discharge regulation, labelled
BYPASS and FLOW, respectively, on the graph) and
the change in inlet temperature to the turbine (with
temperature regulation labelled TEMP). As can be
seen, the methodology used for flow or temperature
changes allowed for a uniform distribution of post-
measurement points with a thickening in the direction
of decreasing power, which is a desirable
phenomenon.
Figure 4: Power as a function of factor output through the
turbine.
Flow through the turbine [%]
Power [MW]
SIMULTECH 2024 - 14th International Conference on Simulation and Modeling Methodologies, Technologies and Applications
448

Figure 5: System power as a function of inlet temperature
change per turbine.
The main factors in choosing a power control
system are efficiency, response time, and cost. The
stability of the system's operation under changed
conditions is also an important aspect. Analyzing the
graph of the efficiency of the system as a function of
its power (see Figure 6), it can be concluded that the
best in this respect is the flow rate control system.
Slightly lower values are achieved by the bypass
control system, and significantly lower by the
temperature control system.
After three series of calculations, the results from
all cases were collected and presented in graphs.
Figure 5 and Figure 6 show the change in system
power as a function of the change in flow through the
turbine (with bypass and discharge regulation,
labelled BYPASS and FLOW, respectively, on the
graph) and the change in inlet temperature to the
turbine (with temperature regulation labelled TEMP).
As can be seen, the methodology used for flow or
temperature changes allowed for a uniform
distribution of post-measurement points with a
thickening in the direction of decreasing power,
which is a desirable phenomenon.
Figure 6: System efficiency as a function of generator
power.
The main factors in choosing a power control
system are efficiency, response time, and cost. The
stability of the system's operation under changed
conditions is also an important aspect. Analyzing the
graph of the efficiency of the system as a function of
its power (see Figure 6), it can be concluded that the
best in this respect is the flow rate control system.
Slightly lower values are achieved by the bypass
control system, and significantly lower by the
temperature control system.
The graph from the theoretical part was made for
a system for which the working medium was not
specified in the source, but it was most likely air or a
perfect gas. For this reason, the efficiency curves
obtained in the simulation have a distinctly different
shape.
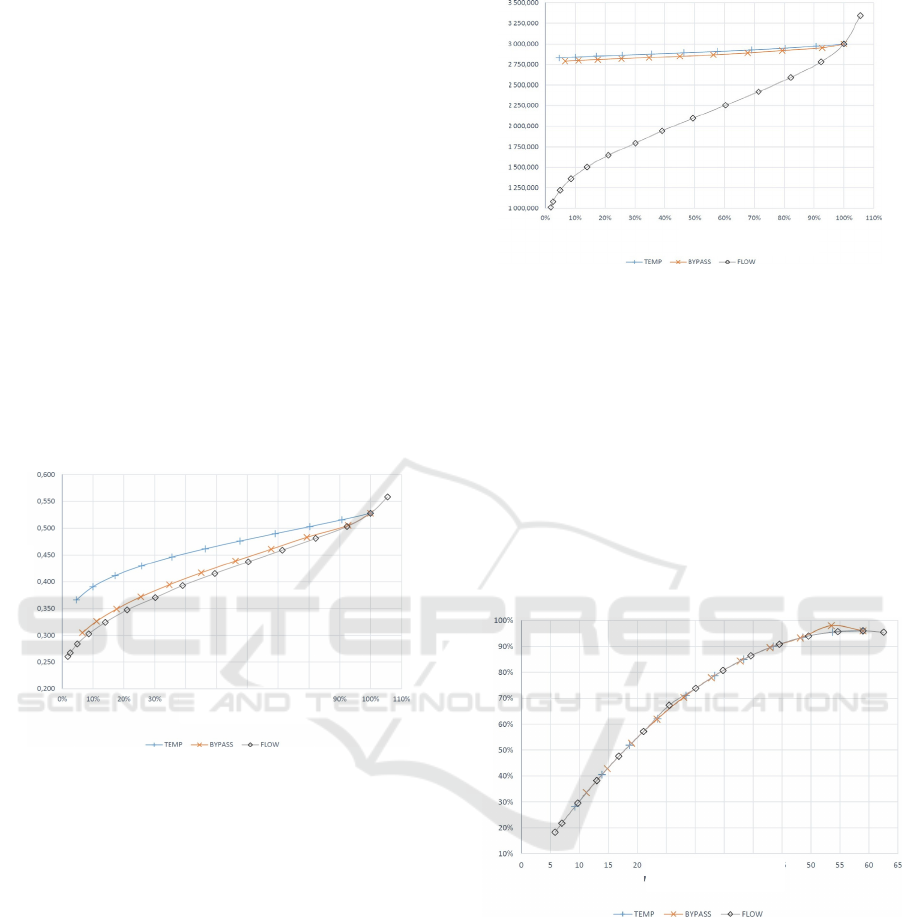
Figure 7: Power generated by the expander as a function of
system power.
To further explain this phenomenon, it is
worthwhile to analyze the operation of rotating
machines under the changed conditions. The expander
was analyzed first. Figure 7 shows a graph of the
power generated on the turbine as a function of the
power of the whole system. As can be seen, the
expander generates the highest power with
temperature control and the lowest with output
control, which is quite the opposite of what would
seem consistent with the efficiency graph (Figure 6).
Thus, the factor determining the efficiency of the
system is the power consumed by the compressor.
Turbine inlet temperature [%]
Power [MW]
Power [MW]
Efficiency
Power
Turbine power [MW]
A Model of the Control System of a Carbon Dioxide Gas Turbine in Supercritical Condition
449
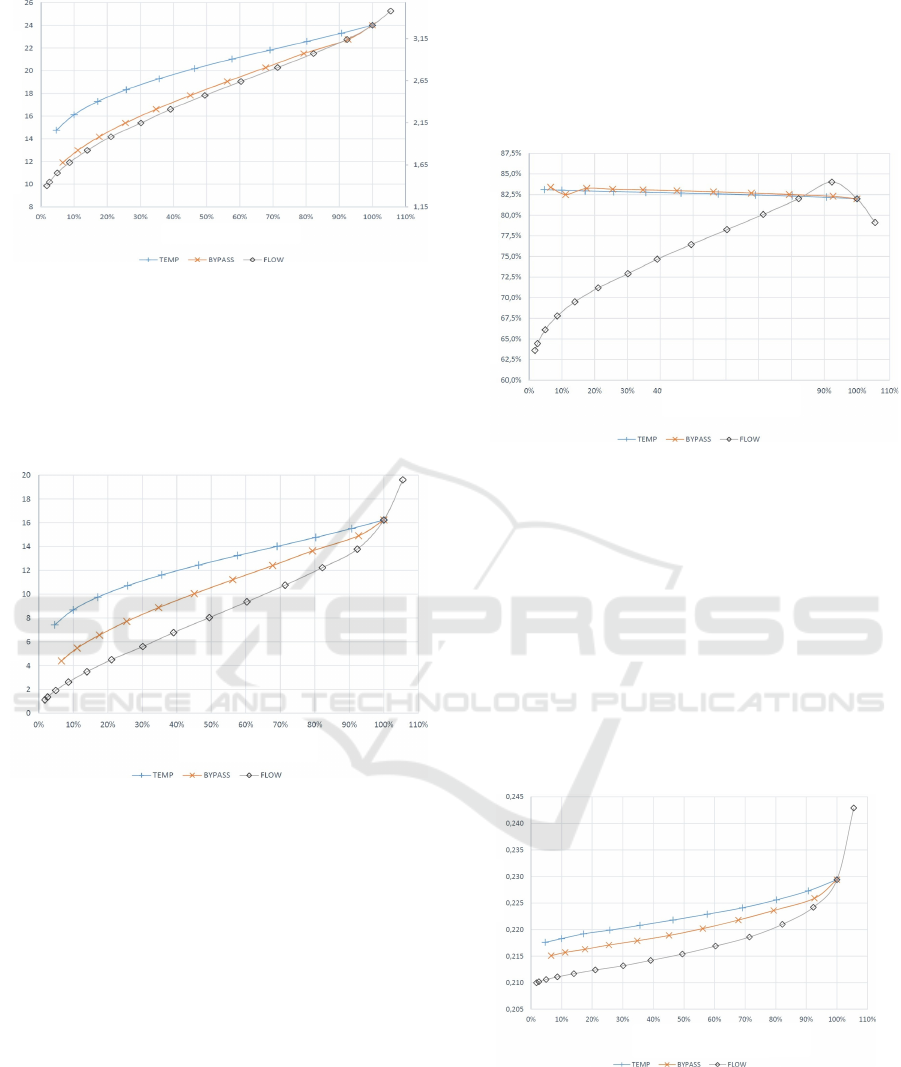
Figure 8: Power generated by the expander as a function of
system power.
Considering that the inlet pressure on the
compressor, which is the lowest pressure in the
system, almost does not change, Figure 8 plots the
values of the system compression on the auxiliary
axis (on the right side of the graph).
Figure 9: Compressor power as a function of system power.
A more in-depth analysis of individual results
reveals significant insights. For instance, Figure 8
shows the power generated by the expander as a
function of system power. The expander generates the
highest power with temperature control, despite this
method resulting in the lowest overall system
efficiency (Figure 6). This discrepancy indicates that
the power consumption by the compressor is a crucial
factor. Figure 9 supports this observation, illustrating
that the compressor consumes the least power under
discharge control, which correlates with the highest
system efficiency.
With all other parameters unchanged, an increase
in system compression implies an increase in the
power consumed by the compressor. Such a
relationship can be seen by comparing the TEMP and
BYPASS curves on the graph of compressor power
as a function of system power (see Figure 9). It can
also be seen that the least power is consumed by the
compressor when controlling the discharge. This is
due to the reduced flow rate. The graph in Figure 9
also shows that a 5 percentage point increase in flow
causes a greater increase in power than a decrease in
power with a corresponding decrease in flow.
Figure 10: Compressor isentropic efficiency as a function
of system power.
Additionally, Figure 10 depicts the isentropic
efficiency of the compressor as a function of system
power. It is evident that the efficiency is significantly
influenced by the discharge method, which minimizes
power consumption more effectively than other
methods. This is further corroborated by Figure 11
and Figure 12, showing the compressibility factor (Z-
factor) at the compressor inlet and outlet. The Z-
factor remains relatively stable at the inlet but
fluctuates at the outlet, especially under temperature
control, indicating complex interactions between the
working fluid's properties and system performance.
Figure 11: Compressor inlet refrigerant compressor
compressibility factor as a function of system power.
A decrease in the power consumed by the
compressor does not directly translate into an increase
in its isentropic efficiency, as can be seen in Figure
10. The graph of the compressor's isentropic
Power
Power
Power
Power
Power
Z IN
Turbine inlet pressure [MPa]
Compressor isentropic efficiency
Compressor power [MW]
SIMULTECH 2024 - 14th International Conference on Simulation and Modeling Methodologies, Technologies and Applications
450
efficiency as a function of system power clearly
shows that the decisive influence on this efficiency is
due to the change in working refrigerant discharge.
The slight increase in compressor efficiency
occurring with a decrease in system power is due to
the change in compression and average
compressibility of the working medium. The
GateCycle program does not allow you to read the
average value of this factor in a given component, but
it does allow you to read its value at the inlet and
outlet of the compressor. Based on Figure 11, which
shows the Z-factor (Compressibility Factor) at the
compressor inlet, it can be concluded that its value
hardly changes in this area. Thus, assuming, in
accordance with engineering knowledge, the absence
of local maxima and minima of this coefficient inside
the compressor, it can be concluded that an increase
in the value of the Z coefficient at the compressor
outlet implies an increase in the average value of this
coefficient throughout the component.
Figure 12: Compressibility factor of the working fluid at the
compressor outlet as a function of system power.
Based on Figure 12, it can be concluded that
higher values of the Z-factor occur with temperature
control. The main effect of the compressibility
coefficient on system operation is expressed
differently. As already stated, GateCycle determines
the off-design compressor speed. In the equation,
only the compressibility factor Z changes, which
helps explain the shape of the curves on the graph of
compressor speed as a function of system power (see
Figure 13).
Figure 13: Rotating machine speed as a function of system
power.
Figure 14 and Figure 15 highlight the importance of
maintaining synchronization with the grid via a
gearbox. The gearbox efficiency sharply declines
with decreasing system power, emphasizing the need
for efficient gearbox design and operation. Moreover,
Figure 18 through Figure 20 demonstrate significant
variability in heat exchanger performance under
different control strategies. Notably, the efficiency of
HX2 drops drastically under bypass control,
suggesting that operational strategies or design
modifications are necessary for optimizing heat
exchanger performance.
Figure 14: Gearbox efficiency as a function of power
delivered at the driving shaft.
As can be seen, especially in the case of output
control, the speed changes. To maintain
synchronization with the grid, a gearbox is necessary
in the system. Its efficiency significantly affects the
efficiency of the entire system, as it significantly
decreases with a decrease in the power of the system,
as shown in Figure 14. Interestingly, the power of the
system is the decisive factor affecting the efficiency
of the gearbox, and the change in speed does not play
a major role. In Figure 14, one point deviation from
Power
Power
Z OUT
RPM
Effectivity of gearbox
Power at gearbox [MW]
A Model of the Control System of a Carbon Dioxide Gas Turbine in Supercritical Condition
451
the plotted curves can be observed, which is probably
an iteration error.
Figure 15: System efficiency as a function of system power
at 100% gear efficiency.
It is also possible that the system would operate in
island mode and synchronization with the grid would
not be necessary. In such a case, after eliminating the
gearbox from the system, its efficiency as a function
of power would look like in Figure 15.
Figure 16: Turbine medium outlet temperature as a function
of system power.
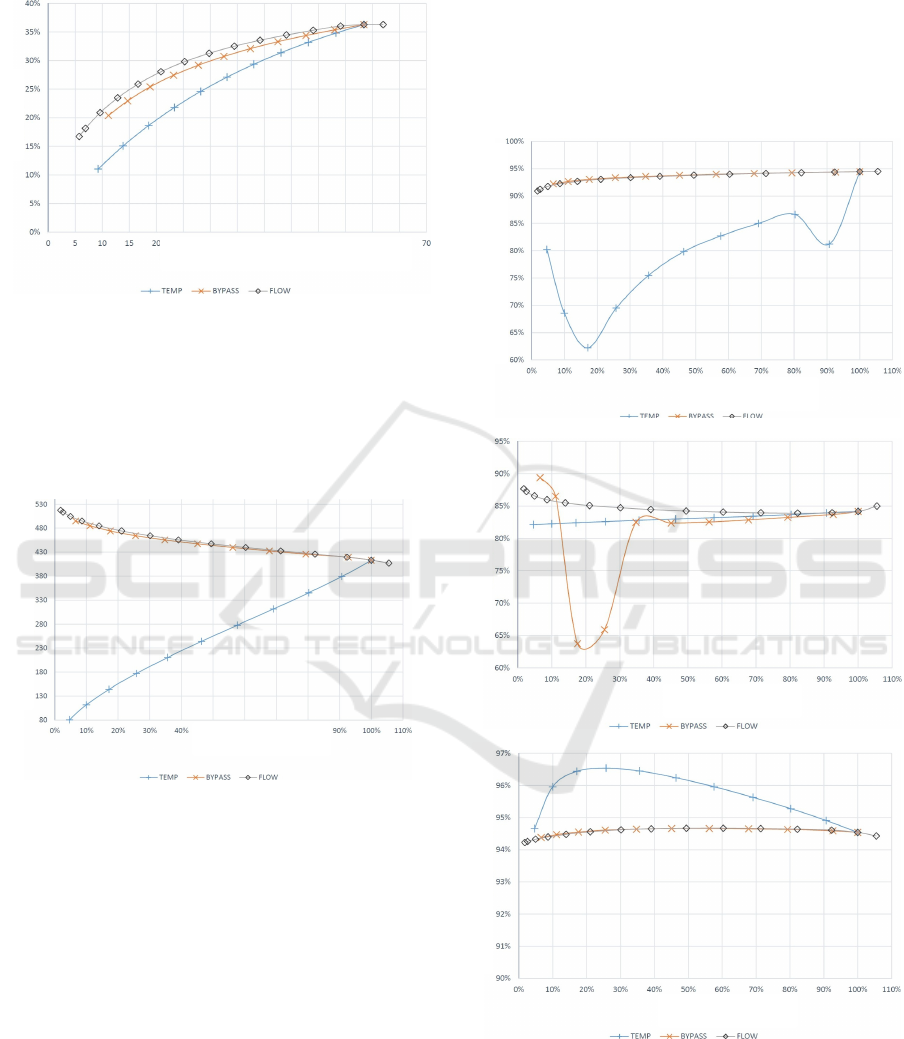
As stated earlier, the efficiency of the system is
not the only factor in choosing the optimal power
control system. The stability of operation is also very
important. Figure 17 shows a graph of turbine outlet
temperature as a function of system power. As can be
seen from it, with bypass control and factor output, as
the system power decreases, the outlet temperature
increases, while in the case of temperature control,
the opposite phenomenon occurs—temperature
decreases at three times the speed. Such temperature
changes cause changes in the efficiency of heat
exchangers, as can be seen in Figure 18, Figure 19,
Figure 20, which show graphs of the efficiency of
heat exchangers (HX1, HX2, and HX3, respectively)
as a function of system power. In the case of output
control, the changes are smooth. The same happens
with bypass control in exchangers HX1 and HX3 and
with temperature control in exchanger HX2.
Particularly noteworthy is the sharp drop in the
efficiency of the HX2 exchanger with bypass
regulation.
Figure 17: HX1, HX2 and HX3 heat exchanger efficiency
as a function of system power, respectively a), b) and c).
b)
Power
Power
Power
Power
HX1 effectivity
HX2 effectivity
HX3 effectivity
Power (no including gearbox) [MW]
a)
Turbine outlet temperature [C]
c
)
Efficiency
SIMULTECH 2024 - 14th International Conference on Simulation and Modeling Methodologies, Technologies and Applications
452
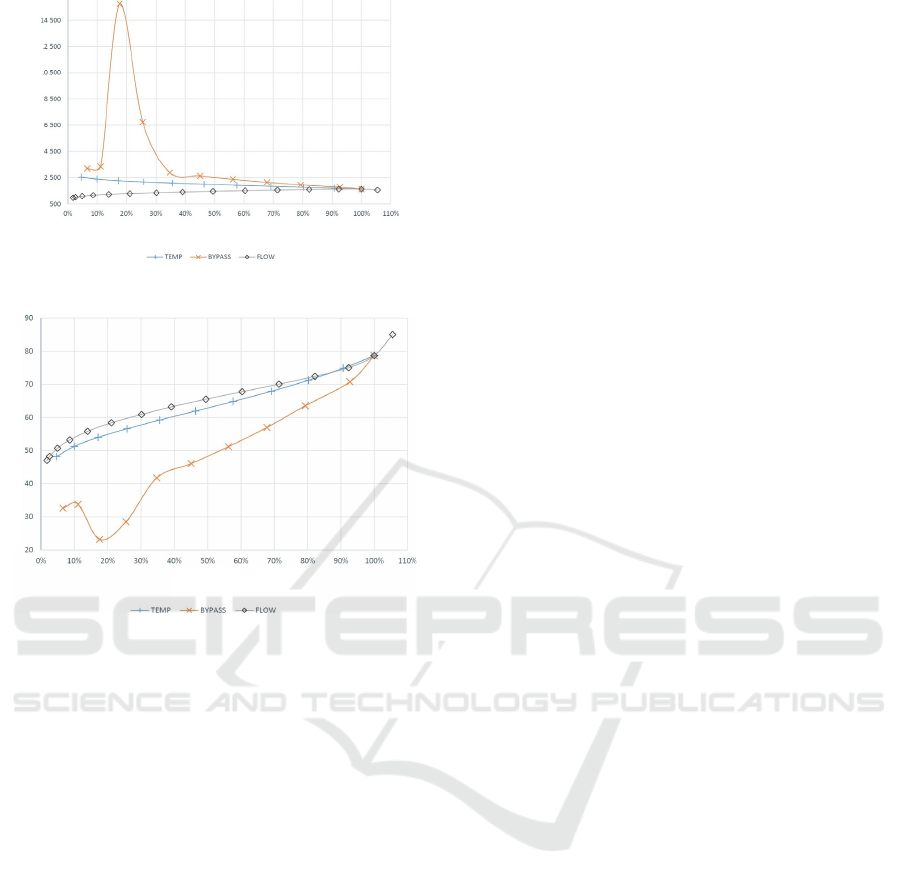
Figure 18: Cooling air flow as a function of system power.
Figure 19: Graph of cooling air outlet temperature as a
function of system power.
This large drop in efficiency entails either
increasing the cooling airflow or using an additional
cooling system, such as water.
Figure 18
shows a clear
jump in the 10-30% area. On the other hand, the
advantage of controlling the output is that the
required cooling airflow decreases with a drop in
system power. Additionally, Figure 19shows a graph
of the cooling air outlet temperature. It can be
deduced from it that the scavenging heat is difficult
to use due to the low temperature, not exceeding
80°C.
The intricate dynamics and performance of
control systems in a supercritical carbon dioxide gas
turbine circuit, as delineated in the results of this
study, provide a profound understanding of the
efficiency and operational stability under various
control strategies. The discussion herein elaborates on
the salient findings from the experimental data,
interprets their practical implications, and delineates
potential avenues for future investigations to enhance
system design and efficiency.
The experimental results vividly demonstrate that
flow rate control systems consistently maintain
higher efficiency compared to other control
mechanisms under variable operational conditions.
This observation is substantiated by the data
presented in Figure 6, where flow rate control systems
showed superior performance in terms of system
efficiency. In contrast, temperature control systems
exhibited a significant decline in efficiency,
suggesting their limited applicability in conditions
where maintaining efficiency is critical. These
findings challenge some of the conventional theories
that advocate the versatility of temperature control
systems across different operational parameters,
suggesting a need for a more nuanced understanding
of these systems in practical applications.
One of the more compelling insights from the
study is the relationship between compressor power
consumption and the overall efficiency of the system.
Detailed in Figure 10, the results indicate an inverse
relationship between flow rate reduction and power
consumption by the compressor. Interestingly, this
reduction in power does not correlate with an increase
in the isentropic efficiency of the compressor,
contrary to typical thermodynamic expectations. This
anomaly points to a complex interaction between the
flow rate and the thermodynamic properties of the
supercritical CO2, which may not be adequately
captured by existing theoretical models. This suggests
that current models may need to be revised or
expanded to incorporate these nuanced interactions
more accurately.
The study also highlighted the critical role of the
compressibility factor (Z-factor) in system
performance, particularly its minimal changes at the
compressor inlet and more pronounced fluctuations at
the outlet, as depicted in Figure 11 and Figure 12.
These findings emphasize the delicate balance
required in managing the working fluid's
thermodynamic properties to optimize system
performance. It also underscores the potential for
significant performance enhancements through
focused modifications in the handling and treatment
of the working fluid under different operating
conditions.
Another key area of focus is the efficiency of the
gearbox, which exhibits a substantial decline with
decreasing system power (Figure 14). This decline in
efficiency does not strongly correlate with changes in
the system's speed, indicating potential areas for
improvement in gearbox design or operation. This
could include exploring new materials, design
modifications, or even entirely new gearbox
technologies that could reduce mechanical losses and
enhance overall system efficiency.
The performance of heat exchangers under
different control strategies revealed significant
Power
Power
Air outlet temperature [C]
Cooling air flow [kg/s]
A Model of the Control System of a Carbon Dioxide Gas Turbine in Supercritical Condition
453
variability, as shown in Figure 17. Particularly
notable is the drastic drop in efficiency of HX2 under
bypass control, necessitating a reconsideration of
either the operational strategy or the design of the heat
exchanger itself. Optimizing heat exchanger
performance could involve detailed analysis of fluid
dynamics within the exchangers or even the
introduction of new materials or technologies that
could withstand the operational demands of different
control strategies more effectively.
Overall, these detailed analyses underscore the
intricate dynamics within the supercritical CO2 gas
turbine system and the necessity for carefully
selecting and optimizing power control strategies to
achieve the best performance outcomes.
5 DISCUSSION
Based on the findings of this study, several areas for
future research emerge. First, there is a clear need for
more refined theoretical models that incorporate the
real gas effects observed under extreme conditions
more accurately. This could involve computational
fluid dynamics (CFD) simulations or experimental
studies to better understand the interactions at play.
Additionally, the exploration of alternative materials
for compressors and heat exchangers could lead to
improvements in system efficiency and durability.
Finally, the integration of advanced predictive
maintenance technologies could significantly
enhance operational stability and extend the lifespan
of system components.
Figure 20: Schematic of the recommended layout.
The proposed hybrid approach in Figure 20 integrates
both discharge and bypass controls, allowing adaptive
management of power control. This dual system
compensates for the limitations of each method under
varying operational conditions, offering a balanced
solution that enhances system responsiveness while
maintaining high efficiency. The schematic in Figure
23 represents this hybrid system, which is poised to
address the trade-offs observed in single-method
control systems, offering an optimal path forward for
supercritical CO2 gas turbine applications in
Concentrating Solar Plants.
The insights from this study provide a robust
framework for understanding the operational
dynamics of supercritical CO2 gas turbines under
different control strategies. While the current control
mechanisms offer substantial benefits, there is
considerable scope for improvement in system design
and operational protocols. The research conducted
herein sets the stage for further innovations and
enhancements in this critical field of energy
technology.
6 CONCLUSIONS
This investigation developed a model of a
supercritical carbon dioxide gas turbine system,
focusing on power modulation within the system. The
model parameters were meticulously selected for
application in next-generation power facilities,
particularly those employing Concentrating Solar
Plants technology. The model was designed for
simplicity and high efficiency, incorporating a heat
regeneration system.
Three distinct power control strategies were
evaluated: bypass, flow rate, and turbine inlet
temperature control. Extensive calculations and
analyses determined that turbine inlet temperature
control yielded the least favorable outcomes, with
significantly lower efficiency and longer response
times.
The discharge control system demonstrated
marginally higher efficiencies but required
significant changes in machinery speed and the
addition of an accumulation tank, increasing cost and
complexity. The bypass control system offered the
fastest response times and ease of implementation but
required increased cooling airflow at lower power
outputs.
The optimal solution is a hybrid approach integrating
both discharge and bypass controls. This dual system
allows adaptive power management, with each
method compensating for the other's limitations under
varying conditions. This proposed solution is
diagrammatically represented in Figure 20.
SIMULTECH 2024 - 14th International Conference on Simulation and Modeling Methodologies, Technologies and Applications
454

ACKNOWLEDGEMENTS
The research results presented in the paper were
achieved within the project entitled “Waste heat
technology management for improvement of energy
efficiency on natural gas IC engines” (no.
POIR.01.01.01-00-0597/19-00), co-financed by the
Polish National Centre of Research and
Development.
REFERENCES
Alfani, D. et al. (2021) ‘sCO2 power plants for waste heat
recovery: design optimization and part-load operation
strategies’, Applied Thermal Engineering, 195, p.
117013. doi:
10.1016/J.APPLTHERMALENG.2021.117013.
Ary Bachtiar, K. P. and Maryono, A. (2019)
‘Thermodynamic analysis of extraction pressure
variation effect on high pressure turbine against the
performance of steam power plant Suralaya 410 MW
by gate cycle modeling’, in AIP Conference
Proceedings. American Institute of Physics Inc. doi:
10.1063/1.5095283.
Boretti, A., Castelletto, S. and Al-Zubaidy, S. (2019)
‘Concentrating solar power tower technology: Present
status and outlook’, Nonlinear Engineering, 8(1), pp.
10–31. doi: 10.1515/nleng-2017-0171.
Dostal, V., Driscoll, M. J. and Hejzar, P. (2004) ‘A
Supercritical Carbon Dioxide Cycle for Next
Generation Nuclear Reactors’, Advanced Nuclear
Power Technology Program.
Hasananto, N., Darmadi, D. B. and Yuliati, L. (2021)
‘Modelling of load variation effect on the steam power
plant heat rate and performance using Gatecycle’, IOP
Conference Series: Materials Science and Engineering,
1034(1), p. 012048. doi: 10.1088/1757-
899x/1034/1/012048.
Kim, Y. M., Kim, C. G. and Favrat, D. (2012) ‘Transcritical
or supercritical {CO2} cycles using both low- and high-
temperature heat sources’, Energy, 43(1), pp. 402–415.
doi: http://dx.doi.org/10.1016/j.energy.2012.03.076.
Ma, B. et al. (2024) ‘Dynamic Modeling and Control of
Supercritical Carbon Dioxide Power Cycle for Gas
Turbine Waste Heat Recovery’, Energies, 17(6), p.
1343. doi: 10.3390/en17061343.
Malinowski, L., Lewandowska, M. and Giannetti, F. (2017)
‘Analysis of the secondary circuit of the DEMO fusion
power plant using GateCycle’, Fusion Engineering and
Design, 124, pp. 1237–1240. doi:
10.1016/j.fusengdes.2017.03.026.
Merchán, R. P. et al. (2021) ‘High temperature central
tower plants for concentrated solar power: 2021
overview’. doi: 10.1016/j.rser.2021.111828.
Milewski, J. et al. (2024) ‘Pilot-scale SOE-MCFC hybrid
system for Co2/H2 mixture production – First
experiences in the “Tennessee” project’, International
Journal of Hydrogen Energy, 52, pp. 1369–1380. doi:
10.1016/j.ijhydene.2023.10.054.
Miller, A. (1984) Gas Turbines and Gas Turbines
Combined Cycles [Turbiny gazowe i układy parowo-
gazowe] (in Polish). Edited by A. Miller.
Wydawnictwa Politechniki Warszawskiej.
Olumayegun, O., Wang, M. and Kelsall, G. (2016) ‘Closed-
cycle gas turbine for power generation: A state-of-the-
art review’, Fuel. Elsevier Ltd, pp. 694–717. doi:
10.1016/j.fuel.2016.04.074.
Sarkar, J. and Bhattacharyya, S. (2009) ‘Optimization of
recompression S-CO2 power cycle with reheating’,
Energy Conversion and Management, 50(8), pp. 1939–
1945. doi:
http://dx.doi.org/10.1016/j.enconman.2009.04.015.
Stein, W. H. and Buck, R. (2017) ‘Advanced power cycles
for concentrated solar power’, Solar Energy, 152, pp.
91–105. doi: 10.1016/j.solener.2017.04.054.
Wu, X. et al. (2021) ‘Is solar power renewable and carbon-
neutral: Evidence from a pilot solar tower plant in
China under a systems view’, Renewable and
Sustainable Energy Reviews, 138, p. 110655. doi:
10.1016/j.rser.2020.110655.
A Model of the Control System of a Carbon Dioxide Gas Turbine in Supercritical Condition
455
