
Development of a Concept Map Evaluation Support System
for Social Studies Learning
Keitaro Tokutake
1 a
, Dai Sakuma
2 b
and Masao Murota
3 c
1
School of Environment and Society, Tokyo Institute of Technology, Japan, 2-12-1, Ookayama, Meguro-ku, Tokyo, Japan
2
Faculty of Teacher Education, Shumei University, 1-1 Daigaku-cho, Yachiyo-shi, Chiba, Japan
3
Institute for Liberal Arts , Tokyo Institute of Technology, Japan, 2-12-1, Ookayama, Meguro-ku, Tokyo, Japan
Keywords: Educational Measurement, Educational Evaluation, Instructional Material Structural Analysis, Social Studies
Education.
Abstract: In social studies learning, it is crucial for students to develop a "structural awareness" that systematically
organizes the connections between social phenomena. One approach to achieving this is concept mapping,
and Tokutake et al. (2019) developed the S-R Score Table as a method for teachers to evaluate students'
concept maps. However, the procedure for utilizing this method is complex, and interpreting the results
requires specialized knowledge and insight. Therefore, in this study, we developed an evaluation support
system that automates the creation of the S-R Score Table and displays the comparison results of the concept
maps created by teachers and students in a comprehensive view. This system is designed to make it easier for
teachers to evaluate the overall trends in students' structural awareness. The application of this system in
actual classroom settings suggested that it could enhance teachers' ability to evaluate the structural awareness
trends of the entire class.
1 INTRODUCTION
In social studies learning, it is crucial for students to
grasp the meaning, significance, characteristics, and
interrelationships of social phenomena. Brahami and
Nada (2019) found that the process of extracting
expert knowledge and mapping relationships
improves creativity and innovation efficiency. Based
on this, we believe that for students to form a
structural awareness of social matters, it is first
necessary for them to be able to grasp the "structural
awareness" formed by the teacher, who uses a
"structuring perspective" as an expert.
Methods to visualize students' structural
awareness include the concept mapping method
developed by Novak et al. (1984) and the hierarchical
directed graphs by Sato (1987), both of which
students can draw. In this study, Sato's hierarchical
directed graphs are considered one method of
drawing concept maps.
a
https://orcid.org/0009-0002-1099-5518
b
https://orcid.org/0009-0007-3638-8229
c
https://orcid.org/0009-0000-9727-3096
Research evaluating students' concept maps
includes scoring comparisons between learners' and
experts' concept maps (Aliya et al.,2021) and link
comparisons (Kato et al., 1988, Jaruwat,2016). These
studies compared individual learners' concept maps
with those of experts, making it difficult to grasp the
recognition trends of all learners. Therefore,
Tokutake et al. (2019) developed the S-R Score Table
to evaluate the structural awareness of individual
students and the entire student body by comparing the
connections in structural graphs drawn by teachers
and students. In the S-R Score Table, each connection
in the teacher's structural diagram is categorized
based on the perspectives and ways of thinking
required for the connection, giving meaning to the
connections. This helps teachers evaluate individual
students' structural perspectives and structural
awareness based on the presence or absence of these
connections in students' concept maps.
Next, by displaying the connection information of
students' concept maps in a list, the S-R Score Table
214
Tokutake, K., Sakuma, D. and Murota, M.
Development of a Concept Map Evaluation Support System for Social Studies Learning.
DOI: 10.5220/0012926700003838
Paper published under CC license (CC BY-NC-ND 4.0)
In Proceedings of the 16th International Joint Conference on Knowledge Discovery, Knowledge Engineering and Knowledge Management (IC3K 2024) - Volume 3: KMIS, pages 214-221
ISBN: 978-989-758-716-0; ISSN: 2184-3228
Proceedings Copyright © 2024 by SCITEPRESS – Science and Technology Publications, Lda.
supports teachers in evaluating the structural
perspectives and recognition trends of the entire
student body. Also, in the S-R Score Table, attention
coefficients are indicated as a metric to identify
students with unique recognition patterns and links
where the entire student body may have unique
recognition patterns.
However, these methods are difficult to use
directly in schools because of the complexity of the
procedures for analysis and the specialized
knowledge and insight required to read the indicators.
In order to solve these problems, it is necessary to
consider ways to facilitate their interpretation and
reading.
Therefore, the purpose of this study is to develop
an evaluation support system using the S-R Score
Table to make it easier for teachers to understand the
structural recognition trends of individual students
and the entire student body.
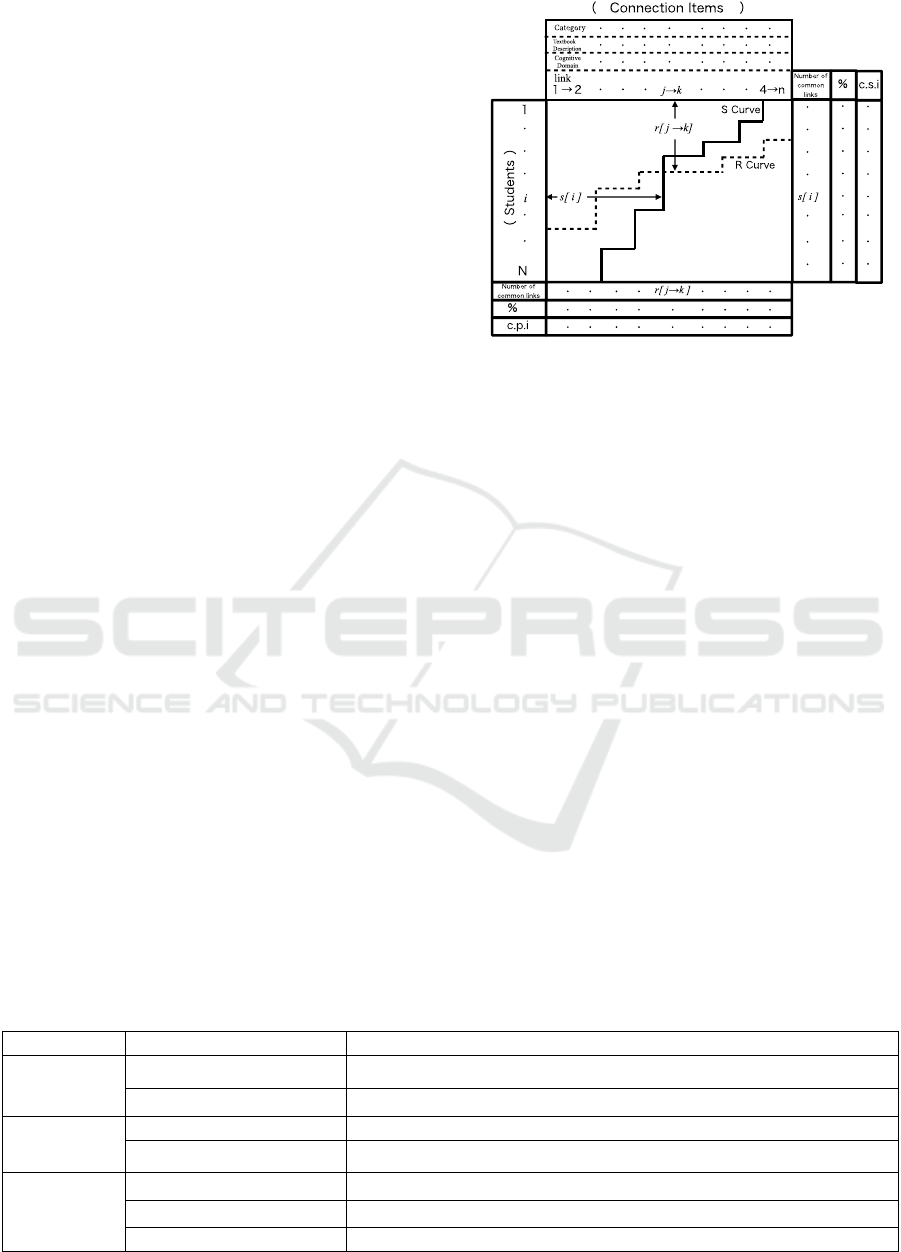
2 OVERVIEWS OF THE S-R
SCORE TABLE
The S-R Score Table, which lists the connection
information from the concept maps of the entire
student body, is developed with reference to the S-P
table by Sato (1998), a method for graphically
interpreting students' learning achievement. An
overview of the S-R Score table is shown in Figure 1.
To create the S-R Score Table, each node in the
teacher's concept map is assigned a sequential
number. If the teacher connects node 1 to node 2, the
link is labeled "1→2". Next, to explicitly show the
structural perspectives required to draw the
connections between nodes, the connections are
categorized using the items in Table 1. These three
item combinations define the structural perspectives
in the S-R Score Table.
For instance, if the teacher connects nodes 1 and
2, which relate to "politics" and "culture"
Figure 1: Basic structure of the S-R Score Table.
respectively, and this relationship is neither explicitly
nor abstractly described in the textbook, requiring
students to analyze and infer the causal relationship
between the events, the connection between nodes 1
and 2 is categorized as "different fields, no
description, analysis". The connections in the
teacher's concept map, classified according to the
items and elements in Table 1, are placed in the
connection items of Figure 1.
When comparing the teacher's and students'
concept maps, common links are marked as "1" and
unique teacher links, which are not drawn by students,
are marked as "0" in the table. Students are then
ranked in descending order based on the number of
common links, and each link item is similarly ranked.
Based on the number of common links for each
student, an S (Student) curve (solid line in Figure 1)
is drawn. In Figure 1, i represents the total number
of common links for student i.
Next, for each link between nodes, an R
(Recognition) curve (dotted line in Figure 1) is drawn
according to the number of students who made the
common link. In Figure 1, r[j
→
k] represents the total
number of students who recognized the relationship
and made the common link between nodes j and k.
Table 1: Classification items of links.
Item
Element
Content
Category
Same Category
Links drawn between events in the same category.
Different Category
Links drawn between events in different category.
Relationship
Description
Described
Links explicitly explained in the textbook.
Undescribed
Links not explicitly explained in the textbook.
Cognitive
Domain
Knowledge
Links inferred from relationships explicitly stated in the textbook.
Interpretation
Links inferred from abstract descriptions or observations.
Analysis
Links inferred from causal relationships arising from events.
Development of a Concept Map Evaluation Support System for Social Studies Learning
215
In the S-R Score Table, the overall structural
awareness of students is evaluated using the S curve
and R curve. The S curve, drawn in descending order
according to the total number of common links for
each student, indicates that if the curve leans to the
right side of the table, a higher number of common
links are present, suggesting a well-formed structural
awareness of social phenomena. Conversely, by
examining the R curve and identifying links with high
and low numbers of common links, teachers can
discern which social phenomena were easily
recognized by many students and which were
challenging in terms of forming structural awareness.
3 METHOD OF SUPPORT FOR
TEACHERS' EVALUATION
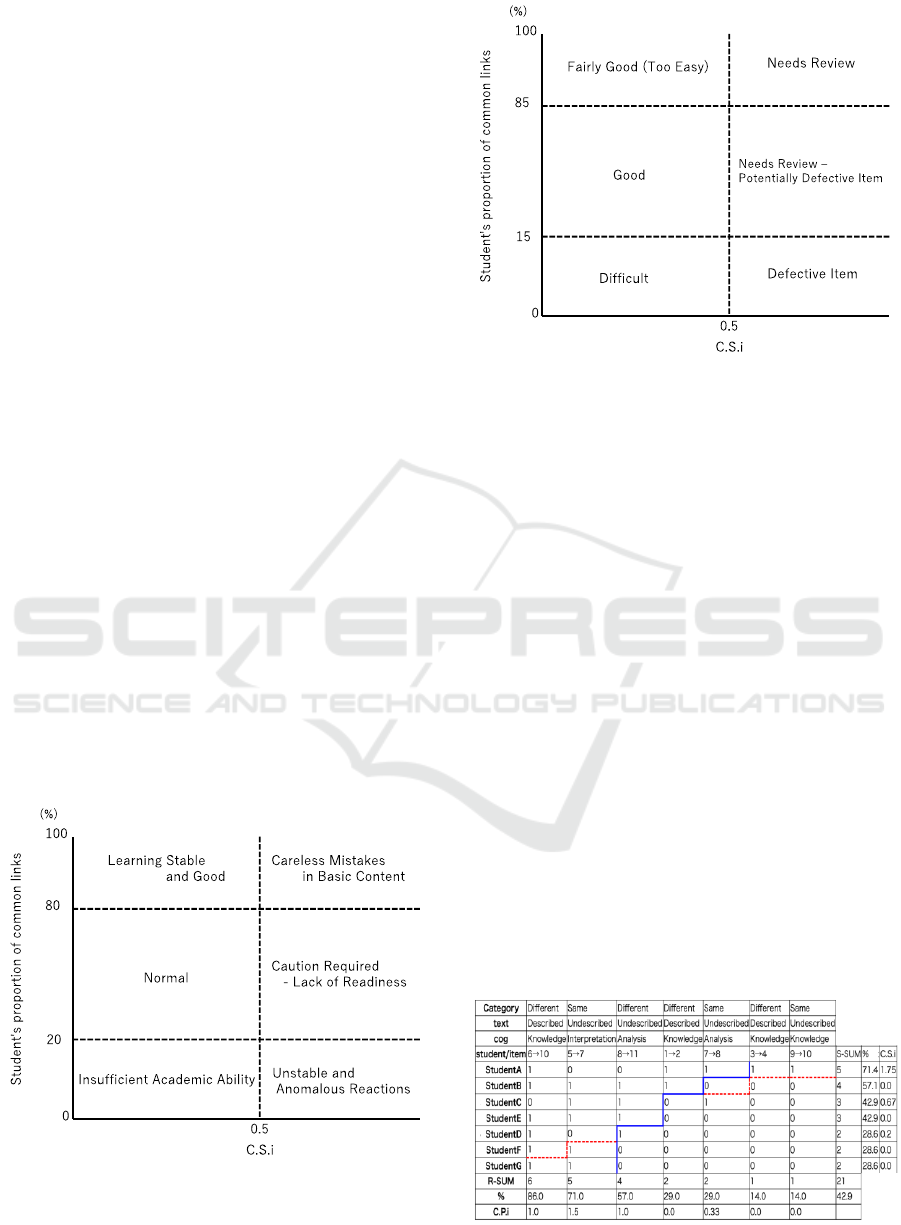
In the S-R Score Table, an attention coefficient is
calculated to identify individual students and link
items with unusual recognition patterns compared to
the overall trend. These are denoted as C.S.i for
individual students and C.P.i for link items. The
calculation of the attention coefficient follows the
method proposed by Sato (1998) for the S-P table. By
examining the attention coefficient, interpretations
can be made as shown in Figures 2 and 3.
As seen in Figure 2, C.S.i values exceeding 0.5
indicate unusual recognition patterns, while students
with a correct response rate below 30% may be
interpreted as having insufficient learning or unique
response patterns. Similarly, Figure 3 shows that
C.P.i values exceeding 0.5 indicate unusual
recognition for specific link items.
Figure 2: Interpretation of C.S.i in S-P Score Table.
Figure 3: Interpretation of C.P.i in S-P Score Table.
Based on these findings, we established the
following two requirements to support evaluation
activities using the S-R Score Table:
1. By plotting the C.S.i values of each student in
a scatter plot, teachers can understand the
overall structural recognition trends of the
students.
2. By plotting the C.P.i values of each link item
in a scatter plot, teachers can understand the
relationships between phenomena that
students found difficult to understand.
Based on the above requirements, we developed
the evaluation support system.
4 SYSTEM FOR CONCEPT MAP
EVALUATION SUPPORT
The connection information of the students' concept
maps is written into a CSV file in a predefined format
and uploaded to the system, which then generates the
S-R Score Table. Figure 4 shows the screen
displaying the S-R Score Table generated by the
system, where the S curve is shown in blue and the R
curve is shown in red.
Figure 4:S-R Score Table created by system.
KMIS 2024 - 16th International Conference on Knowledge Management and Information Systems
216
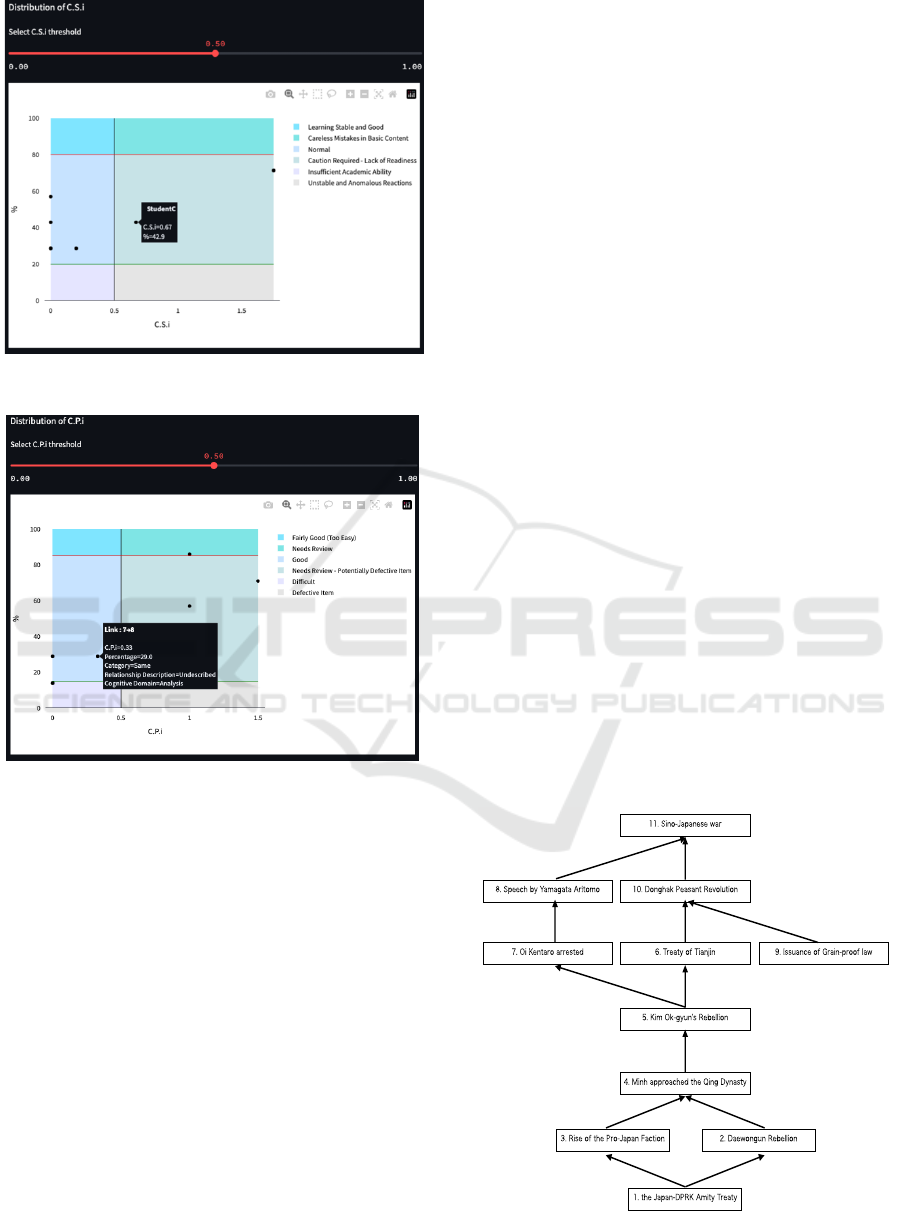
Figure 5: Scatter diagram of C.S.i created by system.
Figure 6: Scatter diagram of C.P.i created by system.
The interface displays not only the S-R Score
Table but also scatter plots of C.S.i (Figure 5) and
C.P.i (Figure 6).
A slider labeled "Select C.S.i threshold" is
provided on the C.S.i scatter plot, allowing the
threshold value for the attention coefficient to be
adjusted. This feature supports teachers in
reinterpreting the threshold value based on the scatter
plot, making it easier to interpret students' structural
awareness even if there are students with attention
coefficients slightly below the standard threshold
value, such as 0.45. Hovering over a point in the
scatter plot displays the student's name, C.S.i, and the
percentage of common links. By examining the
scatter plot of students' C.S.i values, teachers can
easily determine whether there are more students in a
stable group with well-formed structural awareness or
in a deficient group with insufficient learning. For
students with a percentage of common links below
30% and an attention coefficient exceeding the
threshold value, it can be interpreted that they may
have made inappropriate connections or formed
unique historical perspectives.
The same functionality is implemented for C.P.i.
By examining the scatter plot of C.P.i values for the
concept map links, teachers can visually interpret the
proportion of links that were easy for students to
understand and those that were difficult. Additionally,
for links where 15% to 85% of the students have made
the common links and the C.P.i value exceeds the
threshold, it can be interpreted that the content of the
nodes or links created by the teacher might not have
been appropriate.
5 EXPERIMENTAL TRIAL
5.1 Experimental Setting
The developed system was applied to evaluate
concept maps drawn by 21 second-year high school
students enrolled in a history class. These students
participated in lessons on drawing concept maps over
a six-month period, ensuring they understood the
method and were deemed suitable subjects for this
study.
To avoid the influence of the teacher's instruction
on the content of the students' concept maps, no direct
instruction on the study material was provided.
Instead, students were instructed to read the textbook
and create their concept maps based on their
understanding. Figure 7 shows the concept map
created by the teacher.
Figure 7: Concept map drawn by teacher.
Development of a Concept Map Evaluation Support System for Social Studies Learning
217

Students were given the nodes from the teacher's
concept map and instructed to independently arrange
the nodes and draw the links.
5.2 Analysis and Result
5.2.1 Understanding Structural Perspectives
and Trends in Structural Awareness
Based on the link information from the students'
concept maps, the S-R Score Table generated by the
developed system is shown in Figure 8.
Regarding Figure 8, focusing on the R curve, it
can be observed that the number of common links
decreases beyond "6→10." When examining the links
from "2 → 4" to "6 → 10" in terms of structural
perspectives, these links are classified as "textbook
described, knowledge," regardless of whether they
belong to the same field or different fields.
Additionally, focusing on the S curve, it can be seen
that the S curve to the right of "6→10" includes about
half of the students, indicating that the percentage of
common links exceeds 50%.
From these observations, it can be evaluated that
approximately half of the students in the history
course tend to develop structural awareness by
utilizing structural perspectives to interpret the
relationships between social phenomena described in
the textbook, regardless of whether they are in the
same or different fields. However, for the links
classified as "described, knowledge" such as "1→2,"
"3→4," and "9→10," the percentage of common links
falls below 30%. Therefore, it is necessary to further
investigate the reasons for the decrease in the
percentage of common links while reviewing the
textbook and the structural diagrams drawn by the
students.
On the other hand, for the links beyond "8→11"
where the number of common links decreases, it can
be seen that many of these links are classified under
"analysis" or "interpretation" when focusing on the
structural perspectives.
From these observations, it can be evaluated that
students in the history course tend to find it difficult
to develop structural awareness using structural
perspectives for relationships between social
Figure 8: S-P Score table created by the system
KMIS 2024 - 16th International Conference on Knowledge Management and Information Systems
218
phenomena that require interpreting abstract
descriptions in the textbook or inferring causal
relationships arising from the phenomena.
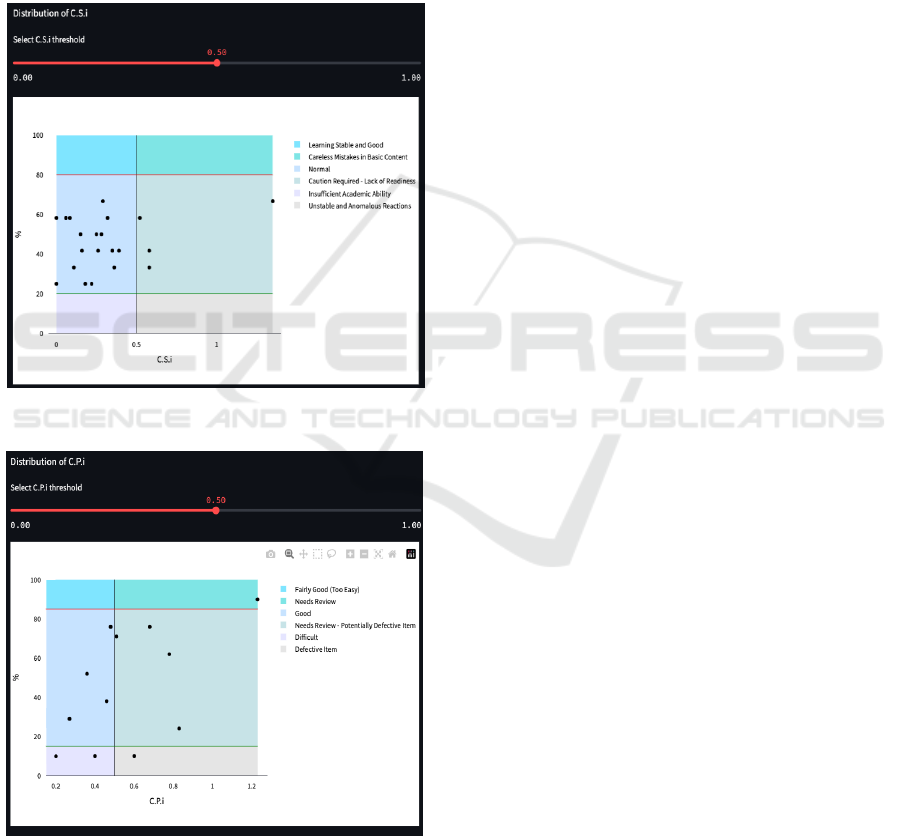
5.2.2 Understanding Trends Using Scatter
Plots of Attention Coefficients
The focus is on the students' C.S.i and the links' C.P.i.
Based on the concept maps obtained from the
experiment in this study, scatter plots of C.S.i and
C.P.i created by the system are shown in Figures 9
and 10, respectively.
Figure 9: Scatter diagram of C.S.i in Experimental trial.
Figure 10: Scatter diagram of C.P.i in Experimental trial.
In Figure 9, it can be seen that 17 out of 21
students belong to the normal group. Therefore, it can
be evaluated that the students in this class may have
insufficient formation of structural awareness.
Additionally, it is observed that four students have
attention coefficients exceeding 0.5. These students
are "studentA," "studentC," "studentL," and
"studentP." According to the S-R Score Table,
studentA and studentC have a common link
percentage of about 60%. This suggests that while
these two students have formed some degree of
structural awareness, their structural awareness may
be insufficient in certain areas.
On the other hand, studentL and studentP have a
common link percentage of about 40% or lower. This
suggests that these two students may be forming a
unique historical understanding different from that of
the teacher. In this study, the structural awareness
held by the teacher is used as the correct model, but it
cannot be said that the students' unique historical
understanding is necessarily incorrect. Therefore,
when evaluating these two students in a real
classroom setting, it is necessary to review their
concept maps to understand their structural awareness.
Regarding C.P.i, focusing on Figure 10, it can be
seen that two links are classified as "Difficult." These
links are "7→8 (Same fields, Undescribed, Analysis)"
and "3→4 (Different fields, Described, Knowledge)."
The link 7→8 is considered difficult for students to
grasp the relationship between the phenomena as it is
not described in the textbook, reflecting the teacher's
professional perspective. On the other hand, the link
3→ 4, although described in the textbook, has the
content on different pages, making it difficult for
students to grasp the relationship.
For the link "9→10 (Different fields, Described,
Knowledge)" classified as "Defective item" although
the relationship is described in the textbook, it is on
different pages similar to "3 → 4." Moreover, the
content of node 6, which also influenced node 10, is
described in detail, suggesting that the influence of
node 9 on node 10 is minimal and thus not suitable to
be included in the map.
On the other hand, the link "2→4 (Different field,
Described, Knowledge)" classified as "Too Easy"
with an attention coefficient exceeding 0.5 is
explicitly described in the textbook, making it easy
for students to recognize the relationship between the
phenomena. However, the C.P.i is high because some
students, despite the high common link percentage,
missed this description and did not draw the link.
In the S-R table, C.S.i is calculated for each
student and C.P.i is calculated for each link, but it is
difficult to discern the tendencies of students and
links from this data alone. However, by viewing the
scatter plots of C.P.i and C.S.i implemented in this
Development of a Concept Map Evaluation Support System for Social Studies Learning
219

system, it has become easier for teachers to grasp
these tendencies.
If teachers can grasp the overall tendencies of
students and links, they can adjust the difficulty level
of the lessons and design better instructional content.
Additionally, using the scatter plots in this system
makes it easier to identify students and links that
deviate from these tendencies. If teachers can identify
students who deviate from the norm, they can analyze
those students' individual learning situations in more
detail and consider optimal instructional strategies.
Similarly, if teachers can identify links that deviate
from the norm, they can determine which parts
require more explicit teaching, thus aiding in the
design of their lessons.
6 DISCUSSION
6.1 Practical and Managerial
Implications of Plotting Results
In this study, we developed a system to assist teachers
in evaluating students' structural awareness by
comparing concept maps created by both teachers and
students, and visualizing the differences. The S-R
Score table proposed by Tokutake et al. (2019) is
highly effective as a method for comparing concept
maps between teachers and students. However, when
teachers use this tool for lesson planning, it is
necessary to focus not on the results of individual
students, but on the overall trends among all students.
Therefore, the system developed in this study,
which plots the results of each student and allows
them to be viewed at a glance, is considered to be
highly effective in helping teachers understand the
overall trends in students' structural awareness and in
considering the level and content of the lessons.
Additionally, plotting the correctness information
and the attention coefficient (C.P.i) for each link is
considered to be highly effective in helping teachers
review the accuracy of their knowledge structure as
experts and in understanding the relationships between
phenomena that are difficult for students to grasp.
From these points, we believe that the system
developed in this study sufficiently supports teachers
in evaluating students' structural awareness.
6.2 Generalization of Methods and
Feasibility in the Field
In this study, the developed system has been used in
the context of history education and its effectiveness
has been discussed. The use of concept maps to form
structural awareness is also practiced in geography,
politics and economics, which are different areas of
social studies, and in science classes. In order to apply
the S-R table and the system developed in this study
to these subjects, we believe that it is necessary to
change the classification items of the link. For
example, in history education, historical events in the
political field are sometimes related to historical
events related to culture. To be able to capture the
relationship between these events is very important in
forming a structural awareness. For this reason, the
classification of the “Same Category” and the
“Different Category” are used to categorize the
connections. However, in geography classes, not only
causality and influence among events, but also
inclusive relationships among events are sometimes
considered important. Therefore, it may be necessary
to reflect items such as “preconditions” and
“inclusions” as elements of “Category”.
In the system developed in this study, the S-R
Score table reflects the elements written by the
teacher in the csv file. Therefore, the system is
expected to be able to handle such changes
adequately. In addition, the creation of the S-R Score
table is automatic, so there is no need for teachers to
follow complicated procedures.
Therefore, we believe that the system developed
in this study is applicable to other fields and can be
easily introduced to schools.
7 CONCLUSIONS
The purpose of this study is to develop an evaluation
support system using the S-R Score Table to make it
easier for teachers to understand the structural
recognition trends of individual students and the
entire student body.
As a result, using the S curve and R curve, it was
possible to understand the students' perspectives on
structurally capturing the relationships between
social phenomena and the trends in their structural
awareness.
The scatter plot of the attention coefficient C.S.i,
which indicates the heterogeneity of students'
structural awareness, revealed the proportion of
students with unique recognition. Additionally, by
examining the percentage of common links with the
teacher's concept map, it became possible to make
detailed interpretations of the students' recognition.
The scatter plot of the attention coefficient C.P.i,
which indicates the heterogeneity of recognition for
each link in the concept map, allowed for a visual
KMIS 2024 - 16th International Conference on Knowledge Management and Information Systems
220

understanding of the relationships between social
phenomena that students likely have insufficient
understanding of. Furthermore, it enabled the
identification of nodes in the teacher's concept map
that may be considered unnecessary for organizing
the relationships between phenomena. From this, it
was suggested that the function of the concept map
evaluation support system developed in this study has
the potential to assist teachers in easily understanding
the structural recognition trends of individual
students and the entire class.
Future task include the following:
1) The interpretation of C.S.i and C.P.i used in
this study is based on the content of the S-P
table, which measures students' attainment of
test questions. Future tasks include
improving the interpretation of C.P.i and
C.S.i to be unique to concept map.
2) The developed system was introduced in a
school setting and its effectiveness was
verified, it was only done in one case. Hence,
it is necessary to have multiple teachers use
the system and evaluate its usefulness.
3) S-R Score Table evaluates students'
structural awareness by comparing it with the
concept map created by the teacher. However,
in social studies learning, students'
independently formed understandings cannot
always be deemed incorrect. Therefore, a
separate method needs to be considered to
evaluate the validity of such unique structural
awareness formed by students.
ACKNOWLEDGEMENTS
This work was partly supported by JSPS KAKENHI
Grant Number 24H02486. This work utilized
OpenAI's ChatGPT for initial drafting, which was
thoroughly reviewed, edited, and supplemented by
the authors. We therefore assume full responsibility
for the final content of this publication.
REFERENCES
Aliya Nugumanova, Yerzhan Baiburin, (2021). Evaluation
metrics for automatically constructed concept maps. In
Proceedings of the 21st International Conference on
Control, Automation and Systems (ICCAS), 365-370.
https://doi.org/10.23919/ICCAS52745.2021.9649911
Brahami Menaouer, and Nada. Matta, (2019). The
Relationship between the Knowledge Mapping and
Open Innovation Process: The Case of Education
System, Artificial Intelligence for Engineering Design,
Analysis and Manufacturing (AIEDAM), 33, 1− 13.
DOI: https://doi.org/10.1017/S0890060419000325.
Jaruwat Pailai, Warunya Wunnasri, Yusuke Hayashi,
Tsukasa Hirashima. (2016). Automatic Concept Map
Assessment in Formative Assessment Approach. The
76th Advanced Learning Science and Engineering
Workshop. The Japanese Society for Artificial
intelligence. https://doi.org/10.11517/jsaialst.76.0_09
Kato, H., Kurata, M., Sato, T., & Ozawa, S. (1988).
Measurement and analysis of structural understanding
state using hierarchical directed graphs drawn by
learners. Gakushusha ga egaita gakushu naiyo no
kaisoteki yukō gurafu ni yoru kōzō teki rikai jōtai no
sokutei to bunseki (in Japanese). IEICE Transactions
on Fundamentals of Electronics, Communications and
Computer Sciences, A J-71(10): 1955-1965.
Keitaro Tokutake, Hiromichi Mori, Masao Murota. (2019).
Consideration of a Method to Grasp the Trend of How
to Understand the Causal Relationship in Historical
Learning. Japan Journal of Educational Technology.
43(Suppl.),133-136. https://doi.org/10.15077/jjet.S43
083
Novak, J. D., & Gowin, D. B. (1984). Learning how to
learn. New York: Cambridge University Press.
Takahiro Sato. (1987). [ISM structural learning
method]ISM kozo gakushu ho(in Japanese). Tokyo:
Meiji Tosho.
Takahiro Sato. (1998). [Explanation of the S-P Score Table
Analysis Method] S-P Hyo Bunsekiho no Kaisetsu(in
Japanese). Hiroshima. Chuo Kyoiku Kenkyujo.
Development of a Concept Map Evaluation Support System for Social Studies Learning
221
