
Enhanced Real-Time Monitoring and Visualization System for Efficient
Data Analysis: A Case Study on Public Distribution System Data in
Assam, India
Narottam Bhattacharjee
1 a
, Abhijit Gogoi
2 b
and Sanghamitra Nath
1 c
1
Department of Computer Science and Engineering, Tezpur University, Napaam, Assam, India
2
Department of Computer Science and Engineering, Dibrugarh University, Assam, India
Keywords:
RDBMS, Big Data, Real-Time, Visualization, Elasticsearch, Kibana, Flask, PostgreSQL.
Abstract:
Modern software produces large amounts of log files or data. The exponential growth of data in modern soft-
ware poses significant challenges for organizations in efficiently managing and extracting insights from this
vast amount of information. This paper presents a user-friendly monitoring system that integrates Elastic-
search’s search engine with Kibana’s visualization tools, aimed at simplifying real-time data management. By
streamlining processes for retrieval, monitoring, searching, analysis, and visualization, the system addresses
the challenges associated with handling large volumes of data. Through testing with data from Assam’s Public
Distribution System (PDS), the research demonstrates the system’s efficacy in creating an efficient solution
for monitoring and analyzing PDS data. The strategic alignment of this system underscores its potential to
significantly enhance the effectiveness of data management in critical domains such as public distribution.
This study contributes to advancing the understanding and implementation of streamlined data management
solutions in complex operational environments.
1 INTRODUCTION
Managing the rapid increase in log files from mod-
ern applications poses difficulties in real-time data ac-
cess and search, with high usage leading to potential
system failures. Handling substantial real-time data
is challenging for Relational Database Management
System (RDBMS). Addressing these issues requires
complex infrastructures, relying on specialized mon-
itoring systems like DevOps and big data manage-
ment tools. However, continuous human monitoring
of these systems proves to be a challenging task. In
their study, Konig et al.(K
¨
onig and Steffens, 2018) ex-
plored how integrating machine learning techniques
can significantly enhance monitoring systems. De-
spite the complexity involved in building such sys-
tems, they opted for Elasticsearch as the foundational
big data technology for their proposed DevOps frame-
work.
Elasticsearch (Shukla and Kumar, 2019) serves
as an open-source distributed analytics engine, capa-
a
https://orcid.org/0009-0004-7167-9804
b
https://orcid.org/0009-0000-4849-8264
c
https://orcid.org/0000-0001-7516-5510
ble of handling a wide range of data types, including
text, numerical, geospatial, unstructured, and struc-
tured data. Some examples of big data are transporta-
tion, government, media, entertainment, and advertis-
ing and marketing data. Ration Card Data
1
in Public
Distribution System (PDS) is one of them.
In June 1997, India’s government introduced the
Targeted Public Distribution System (TPDS) with a
primary emphasis on supporting the economically
disadvantaged. Under the TPDS, countries are re-
quired to develop and implement a comprehensive ev-
idence based system for grain delivery through the
identification of the poor and transparent and ac-
countable distribution system through the Fair Price
Shop (FPS). The Targeted Public Distribution Sys-
tem (TPDS) operates collaboratively with both the
central and state governments sharing responsibilities.
The state is tasked with identifying families below the
poverty line, issuing ration cards, overseeing and reg-
ulating the operation of the FPS, and managing inter-
actions with the state government.
Since December 2015, Assam has implemented
1
The ration card data set. (2022) [Online]. Available:
https://pds.assam.gov.in/ , 2022
Bhattacharjee, N., Gogoi, A. and Nath, S.
Enhanced Real-Time Monitoring and Visualization System for Efficient Data Analysis: A Case Study on Public Distribution System Data in Assam, India.
DOI: 10.5220/0013304500004646
Paper published under CC license (CC BY-NC-ND 4.0)
In Proceedings of the 1st International Conference on Cognitive & Cloud Computing (IC3Com 2024), pages 5-12
ISBN: 978-989-758-739-9
Proceedings Copyright © 2025 by SCITEPRESS – Science and Technology Publications, Lda.
5

the National Food Security Act (NFSA’13), offering
highly subsidized food grains to 2.52 crore individu-
als in accordance with Article 13 of the NFSA. Effi-
cient monitoring and quick searching of ration card-
related information have become essential, necessitat-
ing the adoption of new technology for real-time data
retrieval. Elasticsearch, coupled with Kibana
2
as its
monitoring and visualization tool, emerges as a suit-
able solution, enabling faster and optimized perfor-
mance compared to traditional RDBMS systems.
The study aims to evaluate and analyze the real-
time performance of Elasticsearch compared to an
RDBMS system. The development of a web-based
application facilitates the easy retrieval of PDS-
related ration cards through Elasticsearch indexing.
Additionally, a dynamic dashboard incorporating Key
Performance Indicator (KPI)-based data visualization
using Kibana has been created. The proposed sys-
tem’s objectives include systematically recording and
maintaining ration cardholder details for Assam on
a unified website. Furthermore, the system aims to
expedite the generation of detailed reports for ration
cardholders whenever required.
2 RELATED WORK
Big data analysis serves various objectives, includ-
ing the classification of conversation topics to iden-
tify trending discussions. Given that the main aim of
this research is to devise a text search and big data
analysis system within the DevOps framework, it is
crucial to establish a clear definition. Wahaballa et
al.(Wahaballa et al., 2015) described this approach
as a software development methodology designed to
enhance communication, collaboration, and integra-
tion between development and operations teams, aim-
ing to address critical challenges such as the fear of
change and the risks associated with development.
Historically, the separation between teams dedi-
cated to swift feature delivery and those responsible
for ensuring system stability has led to discord and
decreased productivity. DevOps emerged to address
conflicts, offering swift and continuous assessment
through the facilitation and integration of collabora-
tion among development, operations, and teams re-
sponsible for quality assurance. But building, log-
ging, and monitoring tools are essential to automating
the DevOps process. Akshaya et al.(Akshaya et al.,
2015) introduces several monitoring tools commonly
2
Getting Started with the elastic stack
technology (2022) [Online]. Available
: https://www.elastic.co/guide/en/elastic-
stack/7.17/installing-elastic-stack.html
employed in DevOps practices. Some of them are
briefly described as follows.
• Splunk serves as a tool for analyzing and storing
big data, providing support for numerous related
applications and plugins.
• Loggly offers logging and log data management
through its cloud-based software-as-a-service
(SaaS) solutions. Unlike other similar tools fo-
cused on identifying system issues, Loggly em-
phasizes pinpointing the source of the problem.
• Graphite proves to be a scalable solution for stor-
ing data, generating graphs from time-lapse data,
and real-time monitoring of performance parame-
ters.
• Sumo Logic stands out as a cloud-based SaaS
security platform designed to process logs and
derive real-time insights, proving valuable for
promptly analyzing and addressing challenges
within the infrastructure.
• Cacti is designed as an application capable of stor-
ing system data and presenting real-time graphics
derived from it.
• Logstash, a component of the Elastic Stack, excels
in processing extensive volumes of log files and
extracting valuable insights from them.
• Kibana, an integral component within the Elas-
tic ecosystem, provides interactive visualization
of data on dashboards that users can customize ac-
cording to their needs.
Bangnasco et al.(Bagnasco et al., 2015) in their
work, describes ELK stack, comprised of Elastic-
search, Logstash, and Kibana, as a monitoring system
utilized for Infrastructure as a Service (IaaS) and sci-
entific applications in the cloud, leveraging the Elas-
ticsearch ecosystem. The monitoring system is used
to display data from a cloud-based system and store
it in a SQL database, then feed it to an Elasticsearch
node via the Logstash plugin. Each application pos-
sesses its unique Kibana dashboard for monitoring
and visualization. Nevertheless, the success of the
elastic stack-based solution prompted the team to con-
template the elimination of the SQL middleware layer
from the system. Zamfir et al.(Zamfir et al., 2019) in
their paper described the development of an Elastic-
search monitoring system that uses machine learning
techniques to effectively identify and stop errors at
scale. Takase et al. (Takase et al., 2017) in their work,
present a solution based on the strategy used by the
CERN cloud group. This solution comprises devel-
oping an Elasticsearch plugin to control data access
based on user identity, allowing individual users to
see personalized Kibana dashboards for monitoring
IC3Com 2024 - International Conference on Cognitive & Cloud Computing
6

cloud usage. Hamilton et al.(Hamilton et al., 2018)
in their paper, elaborate on a SCADA (Supervisory
Control and Data Acquisition) statistics monitoring
system developed at CERN, employing the Elastic
Stack. Shah et al.(Shah et al., 2022) in their paper,
present a solution based on Elasticsearch, which in-
cludes a customized search engine, distributed struc-
ture, pre-defined indexing, and a standardized frame-
work designed for broad text mining. Modern in-
dustrial gear generates large amounts of log data, but
manually examining it takes a long time. Nezhmetdi-
nov et al.(Nezhmetdinov et al., 2023) provide an in-
formation system that uses the ELK software stack
to automate log file analysis for industrial equipment.
Calderon et al. (Calderon et al., 2023) in their study,
demonstrate the implementation and performance as-
sessment of an Internet of Things (IoT) platform
that integrates Apache Kafka with Elastic Stack tools
(Elasticsearch, Kibana, and Beats). The Elasticsearch
cluster for data storage and search, the Edge Nodes
for communication with IoT devices and networks,
the Data Streaming module with Apache Kafka, the
Cloud Server for device interaction and data storage
in Elasticsearch, and the Visualization module with
Kibana comprise the architecture of the IoT platform.
Karmalkar et al.(Karmalkar et al., 2021) in their work
developed a web application that serves as a data an-
alytics based search engine for Twitter data based on
Elastic search. Tscharf et al.(Walter-Tscharf, 2022)
in their work describe a system design for indexing,
clustering, and searching scientific text using Elastic-
search and Kibana. Bhosale et al.(Bhopale and Ti-
wari, 2024) in their paper mentioned the Elasticsearch
engine as an efficient document matching and re-
trieval mechanism for their transformation-based in-
formation retrieval system. Famous companies like
Facebook, Uber, Udemy and Netflix have used Elas-
tic Stack as a monitoring tool. CERN also uses Elastic
Stack as a control solution for more than 210 control
applications.
This study explores challenges associated with
handling and analyzing vast real-time data, highlight-
ing the expertise required in specific database and vi-
sualization tools. We introduce a simple monitoring
system that integrates Elasticsearch and Kibana fea-
tures. Our method demonstrates superior text search
performance compared to current approaches. The re-
maining sections of this document are organised as
follows: Section 3 provides a brief review of Elastic-
search and Kibana concepts. In Section 4, we intro-
duce our new proposed architecture methodology for
real time text searching and monitoring, along with a
brief explanation of the experimental setup . Finally,
Section 5 discusses the conclusions drawn from our
findings.
3 STATE OF THE ART
This section highlights the present status of Elastic
Stack technology utilized in this study.
3.1 ELASTICSEARCH
Elasticsearch, an openly accessible distributed and
open-source search tool, furnishes an analytical en-
gine that facilitates text, numeric, geospatial, struc-
tured, and unstructured search capabilities. Elas-
ticsearch, formerly known as Elastic Research N.V.
and now referred to as Elastic, is constructed on the
foundation of Apache Lucene. Its popularity stems
from the simplicity of its REST APIs, distributed na-
ture, speed, and scalability. Elastic search(Kathare
et al., 2020) is the central component of the Elastic
Stack. Other notable examples of websites and appli-
cations leveraging Elasticsearch include Wikipedia,
which utilizes it for text search and recommendations,
Stack Overflow for location-based queries and sim-
ilar searches, and GitHub for code searches, show-
casing the versatility of Elasticsearch across different
domains.
The system architecture is built on the following
concepts:
• Documents - In a basic Elasticsearch repository,
a document comprises fields of a specified type,
each having a unique identifier, and it needs to be
included in an index.
• Index - Documents’ logical storage location. It
uses the inverse index model. It is distributed
across numerous points and subdivided into one
or more spheres.
• Node - a single Elasticsearch instance that is ac-
tive.
• Cluster - cooperative grouping of interconnected
nodes.
• Shards - Splitting one index into multiple sub-
shards allows for parallelization, which boosts ef-
ficiency. It is possible to store the shards on vari-
ous servers.
• Replicas - replicas of the broken pieces. Replicas
are used to boost throughput, obtain data redun-
dancy, and achieve high availability.
3.2 KIBANA
The Elastic search community created Kibana, a vi-
sualization tool, in 2013. With its intuitive and user-
Enhanced Real-Time Monitoring and Visualization System for Efficient Data Analysis: A Case Study on Public Distribution System Data in
Assam, India
7
friendly interface, it offers real-time capabilities for
analysis, summarization, charting, and debugging.
Sharing of log snapshots is also permitted. With
Kibana (Srivastava, 2019), we can manage several
dashboards with an easy-to-use browser-based inter-
face and save the dashboard.
4 PROPOSED ARCHITECTURE
This section outlines the methodology and dataset
employed in the experimental setup.
4.1 METHODOLOGY
The system design architecture employed in this re-
search is depicted in Fig. 1. There are two servers
server1 and server2. The specifications of both
servers are exactly the same. Server 1 installs Elastic-
search with a PostgreSQL input, while Server 2 uses
the PostgreSQL input directly. The client can access
the servers through the localhost network connection.
Figure 1: System Design Architecture
A server is configured as a node. There is “Elas-
tic Node-1” for server 1 and “PostgreSQL database”
for server 2. Elastic Node is configured in a cluster
named “elasticsearch”. Each node will have indices
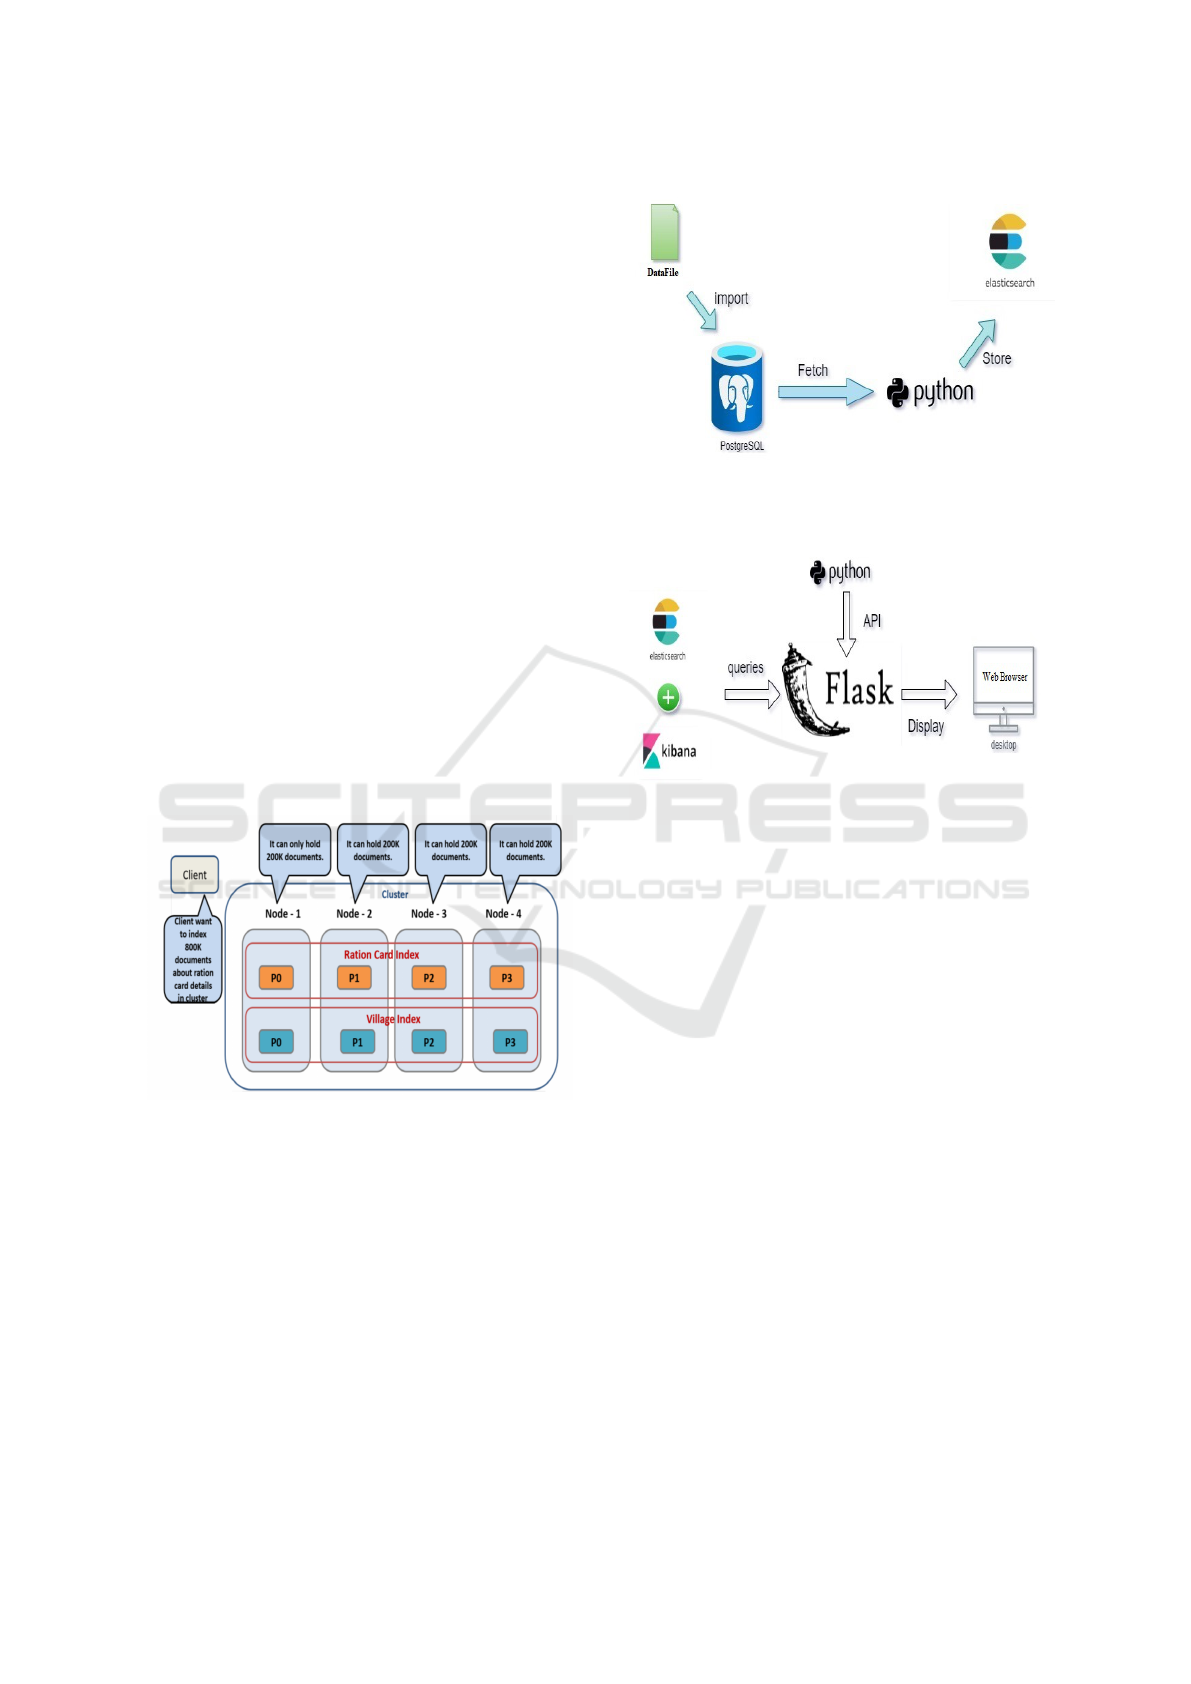
inside them for storing data. The software system ar-
chitecture is shown in Fig. 2(a).
The collected data is ration card data that is taken
from the PDS Assam website and is stored into Post-
greSQL database. This data is stored into Elastic-
search index using python code and Kibana is used
to visualize Elasticsearch data using graphs, tables or
charts and analyze this data easily from a browser.
The system data flow design is illustrated in Fig. 2(b).
(a) System Design Architecture
(b) Software Data Flow Design.
Figure 2: Software Architecture and Design.
4.2 DATASET
A dataset comprising 58,437 ration card holders has
been chosen for import into Elasticsearch from Post-
greSQL using Python code. The dataset includes
various fields such as FPS (Fair Price Shop), ration
card number, holder name, member serial number,
member name, member detector, age, relationship,
mother’s name, father’s name, gender, and district.
This dataset is the result of aggregating individual
FPS dealer details from different districts.
To validate the accuracy of the data import, multi-
ple search queries were executed on the Elasticsearch
node using a comprehensive Query Domain Specific
Language (DSL). All these queries returned accurate
and expected responses. Fig. 3 is an illustration show-
casing a sample of the dataset.
4.3 EXPERIMENTAL SETUP
To become acquainted with the Elastic Stack technol-
ogy and examine its potential, a simple experimental
IC3Com 2024 - International Conference on Cognitive & Cloud Computing
8

Figure 3: Raw Data.
Elasticsearch with Kibana infrastructure was built up.
To begin, Elasticsearch version 7.17.1 was in-
stalled on a local PC with the following specifications:
2 cores CPU, 4 threads, 4 GB RAM, 500 GB hard
disk, 256 GB SSD, and Microsoft Windows 10 Pro-
fessional. Installation instructions from the official
manual
3
resulted in a simple and rapid setup. Sub-
sequently, the Elasticsearch node was initiated in the
background using its default settings automatically. A
sample request was submitted to elastic search to as-
sess the node’s health, and the results showed proper
execution. In a similar manner, the Elastic node op-
erating in the system was located and setup using
Kibana version 7.17.1.
5 RESULTS AND DISCUSSION
Once Kibana is launched, the Kibana server identifies
the Elasticsearch node and establishes a connection to
it. Utilizing the web interface, it presents a summary
of the system’s infrastructure, as illustrated in Fig. 4.
For visualization purposes, pie charts, graphs, and
tables were generated using Kibana, utilizing the
stored data to explore the range of functionalities pro-
vided by the Kibana tool. For instance, Fig. 5(a) dis-
plays two charts and total number of records available
in elastic search. First chart represent all the FPS deal-
ers with number of ration card holder enrolled under
them with the percentage of occurrences and second
chart displays the gender ratio between male, female
and trans-gender. Fig. 5(b) shows a searchable data-
table representing all the fields present in the given
data in an efficient organized manner. Kibana data-
table supports three types of searching mechanism as:
Lucene Search (Full Text Normal Searching), KQL
3
Getting Started with Elastic Stack Technol-
ogy (2022) [Online]. Following the instruc-
tions at https://www.elastic.co/guide/en/elastic-
stack/7.17/installing-elastic-stack.html
Figure 4: Elasticsearch Cluster.
(Kibana Query Language) Search and Filter Search. It
has been noted that Kibana provides a wide range of
visualization options, with graphs refreshing rapidly
upon any parameter change.
(a) Kibana Charts.
(b) Kibana Searchable data table.
Figure 5: Data display using Kibana.
Using Flask, and Kibana’s short URLs we have
created a monitoring dashboard or a website as shown
in Fig. 6(a) for easy monitoring and quick searching
of big data (PDS Data). The dashboard has been de-
signed with a special page for API handler that sup-
ports more than 15 various APIs as shown it Fig. 6(b)
Enhanced Real-Time Monitoring and Visualization System for Efficient Data Analysis: A Case Study on Public Distribution System Data in
Assam, India
9
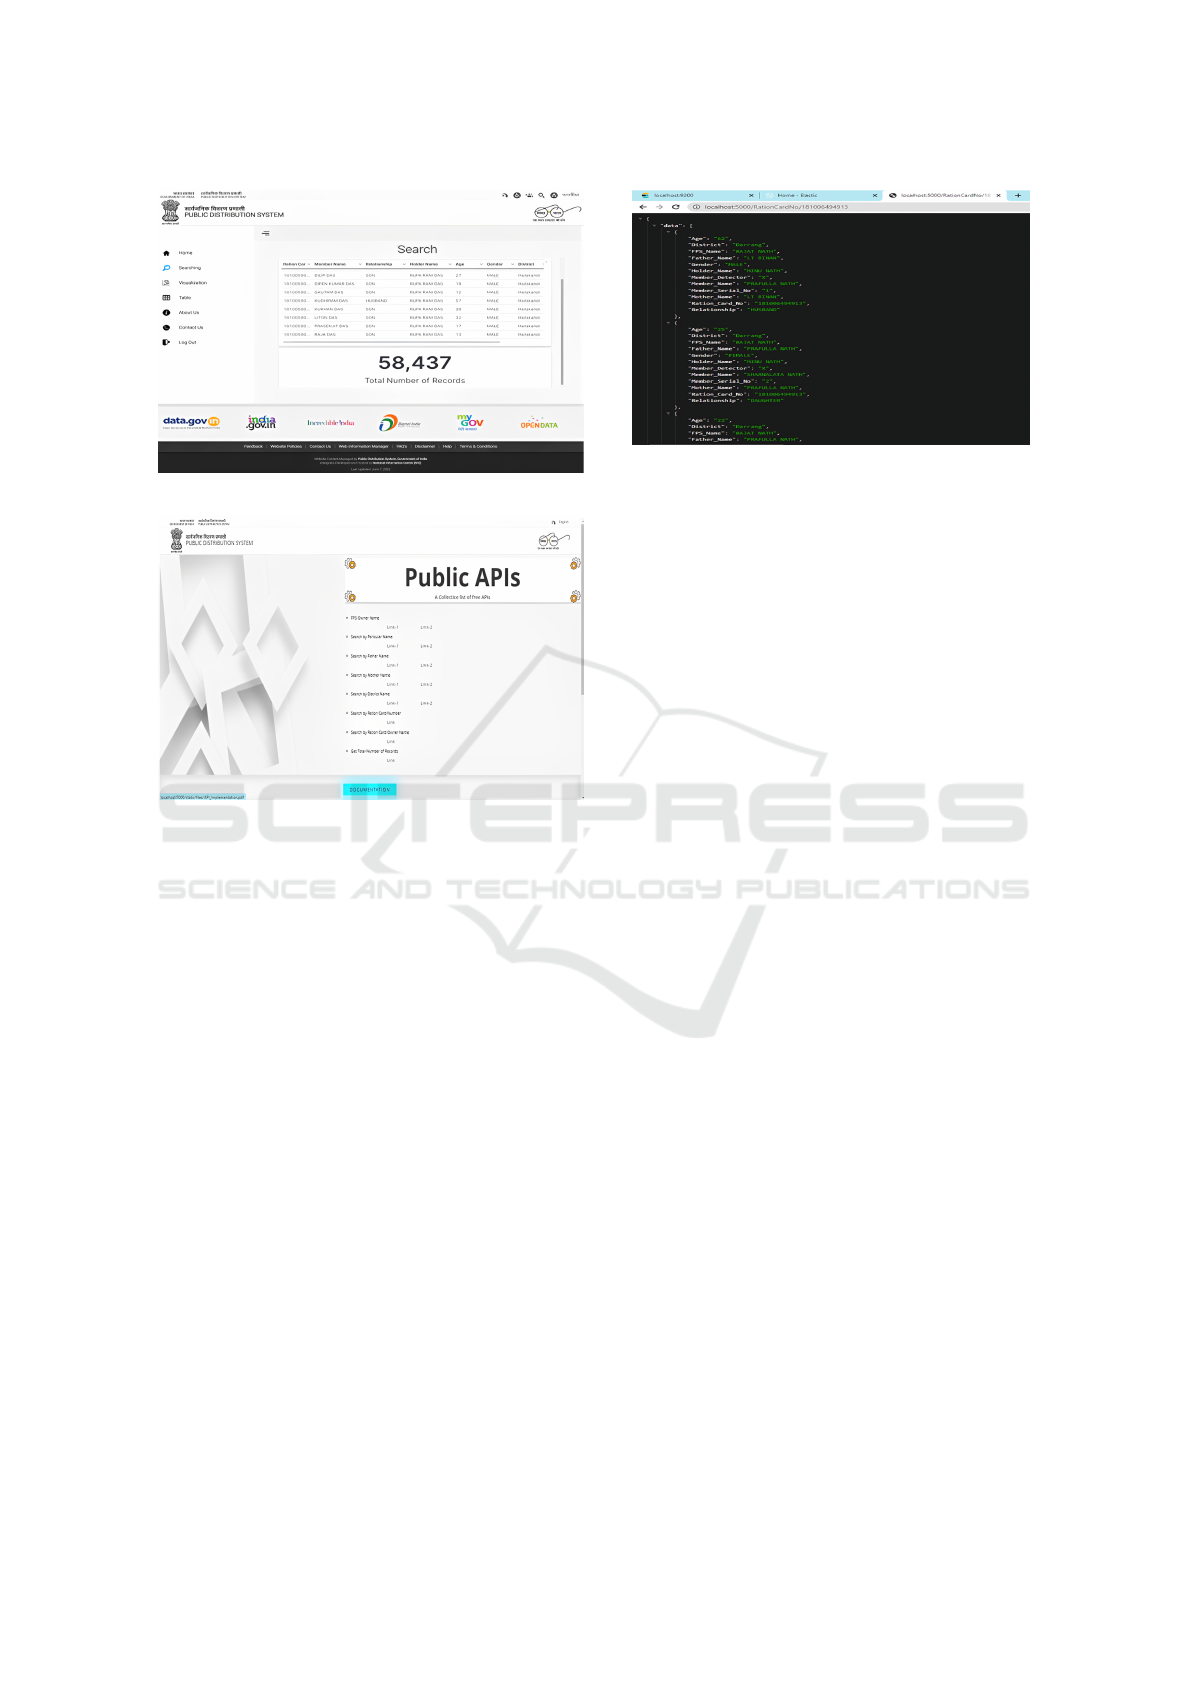
(a) Dashboard for PDS Data.
(b) Public APIs handler page.
Figure 6: Website Overview.
and Table 1. It can be utilized for additional research
endeavors and integrated with any system, as depicted
in Fig. 6(b). It can also be used for easy retrieval of
ration card-related information in real-time.
The developed web application software fulfills the
following specific requirements:
i) The system displays the basic details of each
Card Holder details including name, Card Num-
ber, Family Member Name, Age, District, and
FPS dealer name.
ii) The system allows faster access, and searching of
PDS data in real-time, allowing downloading of
results in CSV file format as shown in Fig. 7.
iii) The system allows the generation of dynamic
Dashboards containing KPI-based data visualiza-
tion using Kibana in real-time and allows down-
loading of results in CSV file format.
iv) The system allows district-wise monitoring of the
PDS records via interactive charts and graphs.
Based on the data presented in Table 2, it is ev-
ident that the proposed method outperforms Post-
greSQL in terms of data rendering time across dif-
Figure 7: Result of a single API request.
ferent numbers of records. For instance, when han-
dling 58,437 records, the proposed method demon-
strates a rendering time of 2-4 minutes compared
to PostgreSQL’s 5-7 minutes. Moreover, for larger
datasets containing 269,548 records, the proposed
method shows significant improvement with a render-
ing time of 5-7 minutes compared to PostgreSQL’s
greater than 10 minutes. These results highlight the
effectiveness of the proposed approach in achieving
faster data rendering, making it a promising solution
for real-time data analysis and management tasks. In
conclusion, we’ve incorporated an ELK panel into the
system to assist in dataset analysis. This feature al-
lows for the creation of aggregations and basic visu-
alizations for each data field. This addition enhances
the system’s ability to thoroughly explore and inter-
pret data, contributing to better insights and decision-
making.
6 CONCLUSION
The research culminated in developing a robust PDS
data analysis monitoring system for the National In-
formatics Centre, Government of Assam. Utilizing
Elasticsearch and Kibana, integrated with Flask and
PostgreSQL, the objective was to establish a DevOps
monitoring framework capable of handling extensive
volumes of big data and real-time events. The ini-
tial phase involved immersing into the technological
landscape to explore possibilities and establish Elas-
ticsearch as the cornerstone technology, chosen for
its scalability, speed, and simplicity tailored to the
provided dataset. This strategic choice aligned with
the overarching goal of creating an effective solution
for PDS data analysis and monitoring system. Future
work could focus on exploring opportunities to inte-
grate emerging technologies such as blockchain for
enhanced data security and transparency could further
bolster the robustness of the monitoring system.
IC3Com 2024 - International Conference on Cognitive & Cloud Computing
10

Table 1: API Endpoints and Descriptions
API Endpoints Description
http://localhost:5000/#home Used to display the dashboard
of the proposed system.
http://localhost:5000/API Used to display the entire avail-
able API to the proposed sys-
tem.
http://localhost:5000/fpsName/<fpsName> Used to fetch 10 records of the
ration cards holders that come
under the particular FPS dealer.
http://localhost:5000/fpsName/<fpsName>/<records> Used to fetch required amount
of the ration cards holder
records that come under the
particular FPS dealer.
http://localhost:5000/memberName/<memberName> Used to fetch 10 records of the
ration cards holders that come
under the given member name.
http://localhost:5000/memberName/<memberName>/<records> Used to fetch required amount
of the ration cards holder
records that come under the
given member name.
http://localhost:5000/fatherName/<fatherName> Used to fetch 10 records of the
ration cards holders that come
under the given father name.
http://localhost:5000/fatherName/<fatherName>/<records> Used to fetch required amount
of the ration cards holder
records that come under the
given father name.
http://localhost:5000/motherName/<motherName> Used to fetch 10 records of the
ration cards holders that come
under the given mother name.
http://localhost:5000/motherName/<motherName>/<records> Used to fetch required amount
of the ration cards holder
records that come under the
given mother name.
http://localhost:5000/districtName/<districtName> Used to fetch 10 records of the
ration cards holders that come
under the given district.
http://localhost:5000/districtName/<districtName>/<records> Used to fetch required amount
of the ration cards holder
records that come under the
given district.
http://localhost:5000/RationCardNo/<rationCardNumber> Used to fetch at max 20 records
of the ration cards holders that
come under the given ration
card number.
http://localhost:5000/familyHead/<rationCardOwnerName> Used to fetch at max 20 records
of the ration cards holders that
come under the given ration
card owner name.
Enhanced Real-Time Monitoring and Visualization System for Efficient Data Analysis: A Case Study on Public Distribution System Data in
Assam, India
11

Table 2: Time required for data rendering (in min)
Number of
Records
PostgreSQL Proposed
Method
58437 5-7 min 2-4 min
269548 >10 min 5-7 min
ACKNOWLEDGMENT
This research is done for National Informatics Cen-
tre, Assam State Unit. The authors are grateful to
Pranab Chakravarty, Scientist E (Technical Director)
of NIC, Department of Computer Science and Infor-
mation Technology Cotton University, and Depart-
ment of Computer Science and Engineering, Tezpur
University for giving us the opportunity to carry out
this work.
REFERENCES
Akshaya, H., Vidya, J., and Veena, K. (2015). A ba-
sic introduction to devops tools. International Jour-
nal of Computer Science & Information Technologies,
6(3):05–06.
Bagnasco, S., Berzano, D., Guarise, A., Lusso, S., Masera,
M., and Vallero, S. (2015). Monitoring of iaas and
scientific applications on the cloud using the elastic-
search ecosystem. In Journal of physics: Conference
series, volume 608, page 012016. IOP Publishing.
Bhopale, A. P. and Tiwari, A. (2024). Transformer based
contextual text representation framework for intelli-
gent information retrieval. Expert Systems with Ap-
plications, 238:121629.
Calderon, G., del Campo, G., Saavedra, E., and Santamar
´
ıa,
A. (2023). Monitoring framework for the performance
evaluation of an iot platform with elasticsearch and
apache kafka. Information Systems Frontiers, pages
1–17.
Hamilton, J., Gonzalez Berges, M., Tournier, J.-C., and
Schofield, B. (2018). Jacow: Scada statistics moni-
toring using the elastic stack (elasticsearch, logstash,
kibana).
Karmalkar, V. et al. (2021). Twego trending: Data ana-
lytics based search engine using elasticsearch. Turk-
ish Journal of Computer and Mathematics Education
(TURCOMAT), 12(1S):246–251.
Kathare, N., Reddy, O. V., and Prabhu, V. (2020). A com-
prehensive study of elasticsearch. International Jour-
nal of Science and Research (IJSR).
K
¨
onig, L. and Steffens, A. (2018). Towards a quality model
for devops. Continuous Software Engineering & Full-
scale Software Engineering, 37:37–42.
Nezhmetdinov, R., Kotyrova, S., Nezhmetdinova, R., and
Kovalev, I. (2023). Automating log analysis for in-
dustrial equipment maintenance using elastic stack. In
E3S Web of Conferences, volume 389, page 01064.
EDP Sciences.
Shah, N., Willick, D., and Mago, V. (2022). A framework
for social media data analytics using elasticsearch and
kibana. Wireless networks, pages 1–9.
Shukla, P. and Kumar, S. (2019). Learning Elastic Stack
7.0: Distributed Search, Analytics, and Visualization
Using Elasticsearch, Logstash, Beats, and Kibana.
Packt Publishing Ltd.
Srivastava, A. (2019). Kibana 7 quick start guide: visualize
your elasticsearch data with ease. Packt Publishing
Ltd.
Takase, W., Nakamura, T., Watase, Y., and Sasaki, T.
(2017). A solution for secure use of kibana and elas-
ticsearch in multi-user environment. arXiv preprint
arXiv:1706.10040.
Wahaballa, A., Wahballa, O., Abdellatief, M., Xiong, H.,
and Qin, Z. (2015). Toward unified devops model.
In 2015 6th IEEE international conference on soft-
ware engineering and service science (ICSESS), pages
211–214. IEEE.
Walter-Tscharf, F. F. W. V. (2022). Indexing, clustering, and
search engine for documents utilizing elasticsearch
and kibana. In Mobile Computing and Sustainable In-
formatics: Proceedings of ICMCSI 2022, pages 897–
910. Springer.
Zamfir, V.-A., Carabas, M., Carabas, C., and Tapus, N.
(2019). Systems monitoring and big data analysis us-
ing the elasticsearch system. In 2019 22nd Interna-
tional Conference on Control Systems and Computer
Science (CSCS), pages 188–193. IEEE.
IC3Com 2024 - International Conference on Cognitive & Cloud Computing
12
