
Comparative Analysis of Regression Models for Stock Price
Prediction: LSTM, ARIMA, SVM
Himani Deshpande, Vikas Talreja, Muskan Tolani, Harshvardhan Rijhwani and Rohit Sharma
Artificial Intelligence and Data Science, Thadomal Sahani Engineering College, Mumbai, Maharashtra, India
Keywords: Stock Price, Comparative Analysis, Long Short-Term Memory (LSTM), Autoregressive Integrated Moving
Average (ARIMA), Support Vector Machines (SVM), Regression.
Abstract: The research deals with a critical and challenging issue in the dynamic financial field. It critically evaluates
and predicts stock prices using three popular regression models: Long Short-Term Memory (LSTM),
Autoregressive Integrated Moving Average (ARIMA), and Support Vector Machine (SVM). Using a rich
dataset that spans market volatility over long-term trends, short-term fluctuations, and an unprecedented
period when COVID-19 struck, the research tries to determine which model gives the most accurate forecast
for stock prices. The data was meant to cover the economic giants such as HDFC, ONGC, Tata, and Adani to
give relevance and comprehensiveness to the study. This study gives an insight into time-based stock price
analysis. The findings are very helpful to the financial expert in that they provide critical insights helpful in
choosing the appropriate model based on the needs of the person carrying out analysis and thus aid in forecast
accuracy. Experimental analysis suggests that, among the selected methods, the ARIMA model has given the
highest prediction accuracy, which is approximately 95.26%. MSE and RMSE for the model come out to be
1.355 and 1.164 for Adani Ports, respectively, hence proving the model's performance to be very good even
on long-run datasets. Further, ARIMA performance on a short-run dataset, for HDFC, and on ONGC for a
novel COVID-19 set cements further that strength. Such practical evidence places ARIMA on the most
reliable procedure while walking through the ambiguity of financial market forecasting, providing financial
analysts with a very effective tool for strategic decision-making. Thus concludes that ARIMA helps to add
value to the predictive models and promotes strategic decisions in stock markets through forecasting.
1 INTRODUCTION
Stock price prediction has been the top priority in
financial research that needs paramount attention to
ensure that they remain economically relevant in their
investing and risk management. As it is critical for the
investor, traders and their respective strategies, there
are continuous efforts to develop and test high
predictive models in stock price.
In recent years, the advancements in technology
and the availability of financial data have sparked a
surge in exploring different modelling approaches for
stock price prediction. Machine learning algorithms
have attracted considerable interest for their ability to
identify complex patterns from previous data and
predict accurate results. Machine Learning algorithms
has been proved to be efficient in forecasting stock
prices in terms of precision and accuracy.
This study aims to perform an in-depth analysis of
selected Machine learning algorithms for predicting
stock price. Further, it aims to compare and analyze
the effectiveness of the selected methodologies. Thus,
helping to get better insights into the compatibility of
different machine-learning methodologies in the
financial domain. Along with the study of machine
learning methods, the time period also have a
significant role in stock market analysis, keeping the
same in mind, this study has focused on different time
frames while conducting experiments with special
focus on COVID-19 period data.
2 LITERATURE REVIEW
Cost estimation in financial markets has given rise to
very active and rigorous academic research that
applies from traditional statistical models to the most
advanced machine learning algorithms and hybrid
approaches. Early studies used, to a larger extent,
regression models in finding how stock prices are
Deshpande, H., Talreja, V., Tolani, M., Rijhwani, H. and Sharma, R.
Comparative Analysis of Regression Models for Stock Price Prediction: LSTM, ARIMA, SVM.
DOI: 10.5220/0013307600004646
In Proceedings of the 1st International Conference on Cognitive & Cloud Computing (IC3Com 2024), pages 215-221
ISBN: 978-989-758-739-9
Copyright © 2025 by Paper published under CC license (CC BY-NC-ND 4.0)
215

related to essential factors like the macro-economic
indicators, financial ratios, and technical indicators
[2,9]. Given the complexity and instability facing
financial markets, there was a need to explore new,
more structured, and systematic models.
In the last decade, an application boom could be
observed when the use of machine learning
algorithms was concerned to analyze financial data or
to identify hidden patterns [4,7]. Amongst these, deep
learning models have been used, for example, Long
Short-Term Memory (LSTM) networks, and are
competent in capturing both the spatial and temporal
expectations that add to the accuracy of the prediction
[5, 10]. Various other studies have been conducted on
the effectiveness of the LSTM network in predicting
stock prices [1, 3]. The researchers have combined
historical price data with lots of indicators to give
insights to investors and traders. Several studies show
that the performance of LSTM models is more
advantageous to conventional other models, such as
autoregressive integrated moving average ARIMA
[3, 6]. Stock price prediction can also be performed
using ARIMA models, which are less accurate than
LSTM models due to their autoregressive and moving
average characteristics [6]. Another predictive
method that has gained popularity in predicting stock
prices is the Support Vector Machine (SVM), based
on the principle of maximizing profits by classifying
data points into two different categories [4]. Besides,
the SVM models for detecting complex patterns and
relationships in financial time series effectively boost
predictive power and robustness [7].
3 METHODOLOGY
This research evaluates the performance of popular
machine learning methods towards stock price
predictions in different scenarios. For analyzing the
capabilities of each method, four distinct datasets are
used namely Adani Ports, ONGC, Tata Motors, and
HDFC [15]. COVID-19 was a time of major changes
which had a major impact on financial markets as
well, keeping the same in mind selected methods are
evaluated on their predictive power on stock datasets
during the COVID-19 period. This study has also
analyzed Short term and long-term datasets to assess
the performance of the selected model.
3.1 Dataset
This research, aims to provide detailed insights into
the selected four datasets from the year 2000 to 2021,
which included vital financial data concerning four
promising organizations in the Indian business world
namely Adani Ports, ONGC, Tata Motors and HDFC.
Table 1. Statistics of selected four datasets
HDFC ONGC
Adani
Ports
Tata
Motors
count 5306 5306 3322 5306
mean 1283.664 491.138 344.20 409.45
std 709.25 385.197 193.04 272.47
Table 1, shows the statistics of the datasets, the
'count' value indicates the total number of data points
available for each stock. In Table 1, 'mean' value
represents the average closing price of the stocks over
the period studied. HDFC has the highest average
closing price at 1283.664, followed by ONGC at
491.138.
3.2 Dataset Pre-Processing
Data preprocessing has to be standardized, lest the
numerical values of different ranges compromise the
result. The range of the closing price value of the four
stocks differs greatly; hence, scaling is one of the
techniques used. This scaling method refers to "min-
max Scaling" technique, which is applied to make
data transformation as expressed using equation (1).
The original data, which in this case is the original
closing price 𝑋, still are retained in their normal form
during this technique. This makes the original
distribution of data adaptable for computational
analysis.
Scaled Value = X
scaled
= X-X
min
/ X
max
-X
min
(1)
By applying the scaling method, we made sure that
the closing prices for each stock were weighted
comparatively with the scaling method, hence making
relative analysis and drawing valid inferences
concerning the trend and pattern of the selected
companies.
3.3 Regression Methods
Long Short-Term Memory (LSTM), autoregressive
integrated moving average (ARIMA), and support
vector machine (SVM) are the other three regression
techniques used for the prediction of stock prices.
• Long Short-Term Memory (LSTM):
IC3Com 2024 - International Conference on Cognitive & Cloud Computing
216
Long-short-term memory (LSTM) is a kind of
recurrent neural network (RNN). It is giving
auspicious results with time-series data since it
possesses the capability of holding long-term
dependencies.
• Autoregressive Integrated Moving Average
(ARIMA):
ARIMA is, therefore, a compelling and widely used
statistical model in time series for modeling and
forecasting. It includes Autoregressive (AR) and
Moving Average (MA) models combined with
Integration (I) to attain stationarity of the data.
• Support Vector Machine (SVM):
Even though SVM is highly recognized for
classification, it can also be extended to regression
tasks through the Support Vector Regression (SVR)
model.
4 RESULT AND ANALYSIS
This section presents the investigation of the
performance of some of the predictive models against
the data of stocks of leading companies in India. The
result analysis gets its root from the assessment's
quantitative aspect, which presents a clear picture
concerning the market trend and performance
forecast. The insights gained here form a critical basis
for understanding the comprehensive trend analysis
that follows when graphical interpretations are used
to further explore and validate the findings
4.1 TREND ANALYSIS
The study considers the movement in stock prices of
4 Companies: Adani Ports, ONGC, Tata Motors, and
HDFC. The range of charts below has been computed
from the High, Low, Open, and Close prices of the
dataset, showing trends in stock prices across
different trading sessions. These graphical
illustrations are a reflection of the routine activities of
trading, while at the same time, they also provide
some insight into market tendency and investor
psychology. These statistical measures could be
helpful to us in evaluating the extent of fluctuations
in the financial markets: Standard Deviation and
Average True Range (ATR). Such metrics
contributed to comparing volatility and frequency of
the price changes, hence enhancing our evaluation
and understanding of the dangers and uncertainties in
the stock market.
We further identify essential market events and their
influence on the chosen stock while focusing on
particular times, like the COVID-19 pandemic in
2020. The turbulence brought about by the pandemic
in the market presented a unique opportunity to
observe how stocks react to sudden external shocks.
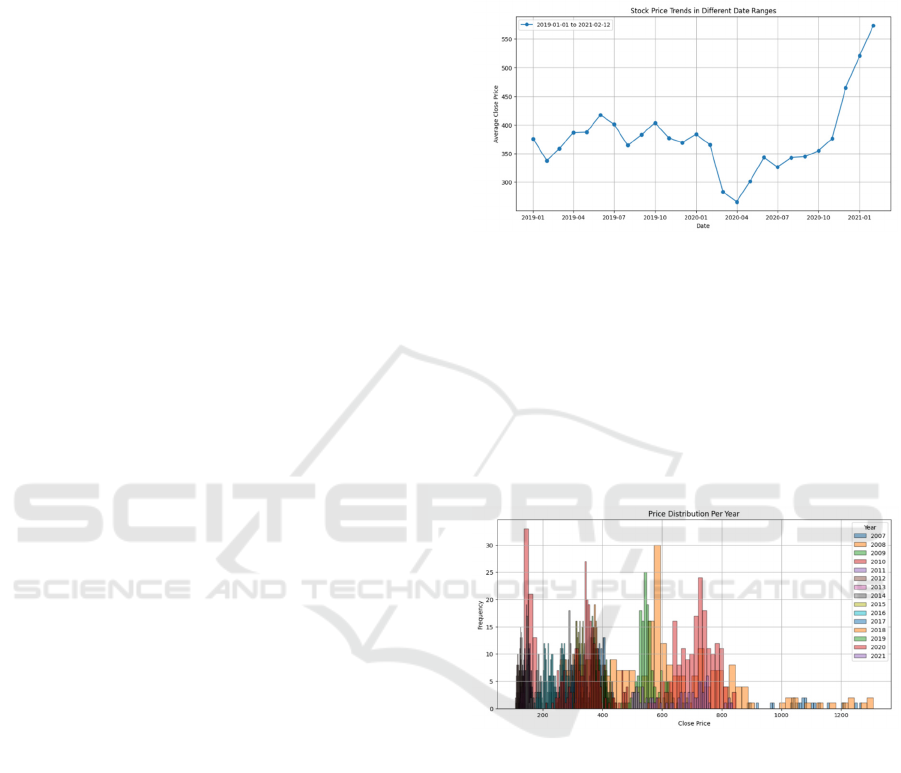
Fig. 1. Stock Price Trends in Different Date Ranges of
Adani Ports dataset.
Fig 1 represents the trend of stock prices concerning
different dates ranging from January 2019 to
February 2021. This generally means the average
increase of stock prices with remarkable fluctuation.
We, therefore, observe that the prices of the stocks
have risen sharply, especially from around October
2020, hence pointing out that it was a time frame of
really remarkable growth.
Fig. 2. Price Distribution per year on Adani Ports
dataset.
Fig 2 represents a histogram of the frequency
distribution of closing stock prices from 2007 to
2021, delineated by different colors for each year.
The X-axis details the closing price, while the Y-axis
represents the frequency of these prices occurring.
Notably, the year represented by the light purple
bars—indicating 2021—shows the highest frequency
of higher price ranges, suggesting an uptick in closing
prices during this year.
Comparative Analysis of Regression Models for Stock Price Prediction: LSTM, ARIMA, SVM
217
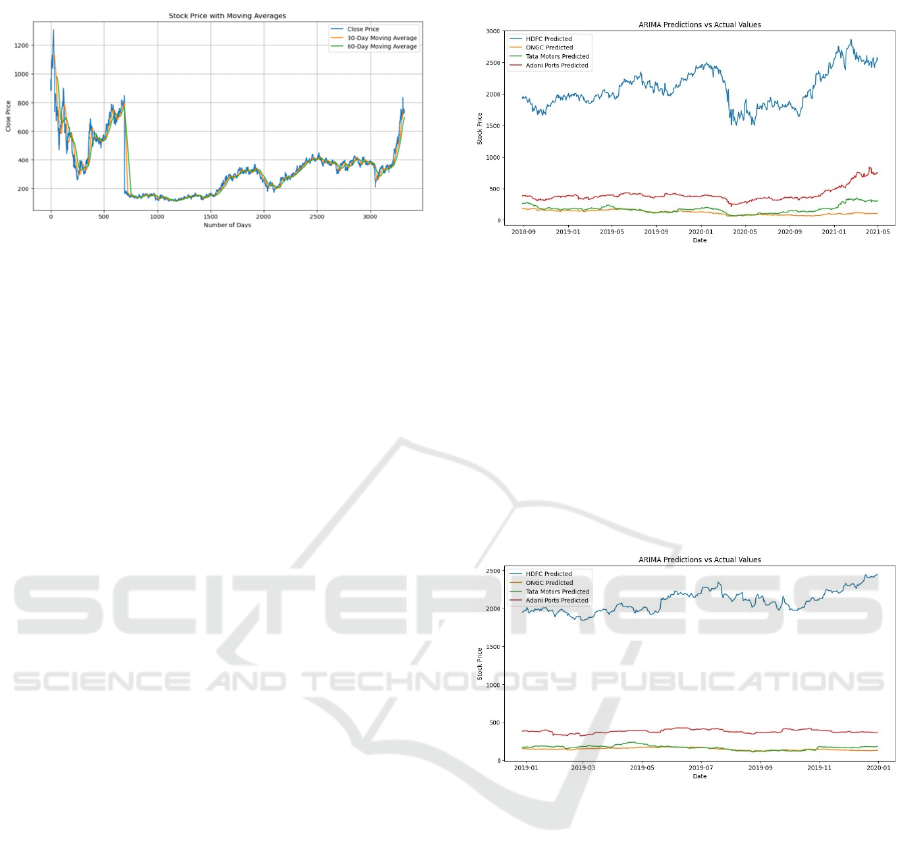
Fig. 3. Stock Price with moving averages on Adani Ports
dataset.
Fig 3 presents a time series analysis of closing stock
prices with the inclusion of 30-day and 60-day
moving averages, plotted against the elapsed number
of days on the X-axis. This chart demonstrates the
stock's price instability, with the moving averages
serving to mitigate the impact of short-term price
variances and to underscore sustained trends. The
convergence of the moving averages prior to a sharp
upward movement in the closing prices suggests a
period of market stability, succeeded by a
considerable increase, possibly indicative of a notable
market development influencing stock valuations.
4.2 TIME PERIOD ANALYSIS
This study’s investigation parses the fluctuations in
stock prices into three temporal categories—long-
term, short-term, and the COVID-19 period—each
offering distinct perspectives on the market behavior
of the stocks under review, which include Adani
Ports, ONGC, Tata Motors, and HDFC.
• Long-Term Period Analysis (2000 to 2021;
ADANIPORTS: 2007 to 2021): The long-
term analysis delves into the overarching
trends and the general progression of stock
prices over two decades. For
ADANIPORTS, the analysis commences
from 2007, aligning with its availability in
the marketplace.
Fig 4. ARIMA predictions on Long Term Period Analysis
•
Short-Term Period Analysis (2015 to 2021):
The short-term analysis concentrates on a
more granular 6-year window, highlighting
investor responses to economic policies,
sectoral shifts, and global financial trends.
The graph below helps us to closely track the
agility of market responses and capture
investor sentiment with a narrower focus.
Fig 5. ARIMA predictions on Short Term Period Analysis
•
COVID-19 Period Analysis (January to
December 2020): The COVID-19 period
analysis homes in on the dramatic effects of
the pandemic on stock prices. The graph
below, illustrates the market’s resilience or
sensitivity to the extraordinary social and
economic disruptions experienced globally
during the year 2020.
IC3Com 2024 - International Conference on Cognitive & Cloud Computing
218
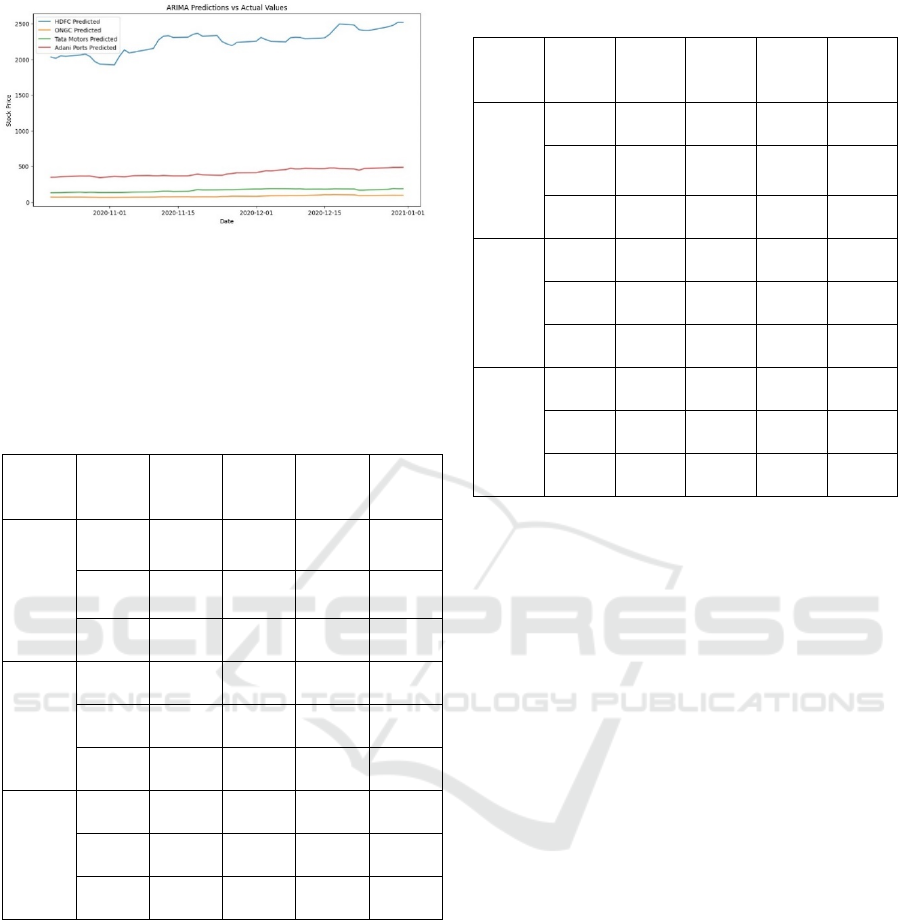
Fig 6. ARIMA predictions on Covid Period Analysis.
4.3 Regression Analysis
This section of the paper analyses the efficiency of
the three regression methods selected for study
namely LAST, SVM and ARIMA.
Table 2. Results on Long term datasets:
Table 2, provides a comparative summary of the
performance metrics for LSTM, SVM, and ARIMA
models across four companies for long-term stock
price prediction. For HDFC and Tata Motors, the
ARIMA model outperforms others with the highest
accuracy, whereas for ONGC and Adani Ports, SVM
and ARIMA show superior accuracy, respectively.
Table 3. Results on Short term datasets
Table 3, compares the short-term forecasting
accuracy of LSTM, SVM, and ARIMA models across
HDFC, ONGC, Adani Ports, and Tata Motors, using
MSE, RMSE, and Accuracy as metrics. ARIMA
model stands out with exceptionally high accuracy for
all companies, particularly excelling with ONGC
with 96.99% accuracy. SVM model, while
significantly better than LSTM, trails behind
ARIMA, with its accuracy hovering around 48%. The
LSTM model shows the least accuracy and high
errors, suggesting it may not be the optimal choice for
short-term stock price predictions in this data set.
For COVID-19 period dataset, Table 4 reflects the
comparative effectiveness of the SVM and ARIMA
models for stock price forecasting. The SVM model
shows lower accuracy across all companies, with
percentages ranging approximately from 37% to
49%. In contrast, the ARIMA model demonstrates
superior performance, with accuracy rates above 90%
for all companies, indicating its robust predictive
capability under the volatile conditions brought on by
the pandemic. This suggests that the ARIMA model
is particularly adept at handling the market instability
experienced during the COVID-19 crisis.
Parameters HDFC ONGC Adani Ports Tata Motors
LSTM
MSE 41139.1 21492.03 16529.35 69491.12
RMSE 202.82 146.60 128.56 263.61
Accuracy 10.1 8.63 9.11 6.30
SVM
MSE 0.494 0.5 0.53 0.523
RMSE 0.703 0.7 0.72 0.723
Accuracy 50.56 50 46.91 47.64
ARIMA
MSE 0.1739 0.301 0.044 0.458
RMSE 0.417 0.549 0.2101 0.677
Accuracy 98.47 99.53 99.04 99.72
Parameters HDFC ONGC
Adani
Ports
Tata
Motors
LSTM
MSE
438162.38 22183.7 14785.9 25967.75
RMSE
661.93 148.94 121.59 161.14
Accuracy 8.25 13.01 15.55 12.2
SVM
MSE 0.51 0.53 0.51 0.52
RMSE 0.71 0.73 0.71 0.72
Accuracy 48.58 46.15 48.58 47.77
ARIMA
MSE 0.030 0.162 1.355 0.2122
RMSE 0.175 0.402 1.164 0.460
Accuracy 95.37 96.99 95.77 89.84
Comparative Analysis of Regression Models for Stock Price Prediction: LSTM, ARIMA, SVM
219

5 COMPARATIVE ANALYSIS
The comparative research carried out in the contexts
and assessment of the analytical findings about those
of other related studies. We devise ways to find out
similarities, differences, and new insights that
contribute value to the collective understanding of the
subject through a review and analysis of several other
previously written research papers for the same
subject. Such an analysis permits a further
specification of what is unique within our study and
points of convergence and divergence between our
study and previous literature. This broadens our
understanding of the matter under research and offers
essential implications for further study and directions
for practical applications.
Table 5 summarizes the key aspects of these
comparative studies, elucidating the contributions
and limitations of each.
Table 5. Comparative Analysis of Research papers.
Study Dataset Models
Compared
Metrics Key Finding
1.Gao et
al.
SP500,
Nikkei225,
CSI300
MLP,
LSTM,
CNN, UA
RMSE, R,
MAPE
UA consistently
outperformed MLP,
LSTM, and CNN in
terms of RMSE
(25.4851-209.9719)
and MAPE (0.0067-
0.0091) across all
datasets.
3. Zhang
(2003)
Sunspot,
Lynx,
Exchange
rate
ARI
MA,
ANN,
Hybrid
MSE (×10³),
MAD
Hybrid model
showed the lowest
MSE and MAD for
Lynx and Sunspot
datasets. For the
exchange rate dataset,
Hybrid model also
had the lowest MSE
(2.67259-4.35907
×10⁻⁵) and MAD
(0.004146-
0.0051212). ARIMA
showed high
performance, but
Hybrid consistently
outperformed both
ARIMA and ANN.
14. Hong
& Jeon
(2018)
CSI-300
index (major
stocks)
LSTM,
LSTM-C,
DA-
RNN,
MI-
LSTM,
LSTM-
CN, MI-
LSTM-N
Min. MSE
(×10⁻³),
Avg. MSE
(×10⁻³)
MI-LSTM showed
the lowest average
MSE (0.996-1.012)
among the models
considered for stock
price prediction.
Our Study
For Long
term
dataset
(2024)
HDFC,
ONGC,
Adani Ports,
Tata Motors
LSTM,
ARIMA,
SVM
MSE,
RMSE,
Accuracy
ARIMA consistently
demonstrated the
highest accuracy
(98.47-99.72) and the
lowest RMSE
(0.2101-0.677).
LSTM showed higher
RMSE (128.56-
263.61) compared to
ARIMA but still
performed well in
stock price
prediction. SVM
showed intermediate
performance with
RMSE (0.7-0.723)
and accuracy (46.91-
50.56).
6 CONCLUSION
This study provides an in-depth analysis of the stock
prediction domain, focusing on analyzing the datasets
of four major Indian companies: HDFC, ONGC,
Adani Ports, and Tata Motors across three periods:
short-term, long-term, and the COVID-19 period.
Selected datasets over these three time periods were
experimented using LSTM, SVM, and ARIMA
Parameters HDFC ONGC Adani Ports Tata Motors
LSTM
MSE
53.73 0.15 74.61 1.66
RMSE
7.33 0.39 8.64 1.29
Accuracy 0.29% 0.37% 0.65% 1.54%
SVM
MSE 0.62 0.50 0.52 0.52
RMSE 0.79 0.71 0.72 0.72
Accuracy 37.25 49.01 47.05 47.05
ARIMA
MSE 1947.09 5.29 79.79 20.71
RMSE 44.125 2.30 8.93 3.10
Accuracy 92.35 96.44 96.77 94.92
IC3Com 2024 - International Conference on Cognitive & Cloud Computing
220

regression methods for prediction analysis. A
comparative analysis finds ARIMA as the most
efficient machine learning model, achieving over
90% accuracy on most datasets and exhibiting low
MSE and RMSE values. This level of performance
was sustained across long-term and short-term
datasets, and specifically during the COVID-19
period datasets, establishing ARIMA as the superior
model for handling the complexities inherent in
financial data and providing reliable forecasts. In
more specific cases, ARIMA does very well on the
Adani Ports dataset in the long-term series HDFC
data in the short-term series, and the ONGC dataset
in the COVID-19 period. On the other hand, the SVM
model is mediocre because the prediction accuracy
lies around 50%, where the predictions are more
volatile than with ARIMA. Although this is markedly
lower than that of the ARIMA model, the consistency
of SVM across different datasets implies its probable
reliability as a model to predict stock prices, mainly
due to its lower MSE and RMSE values compared
with LSTM.
The results reveal that ARIMA outperforms the
other models, achieving high accuracy. However, the
choice of model should align with the dataset's
characteristics and the specific demands of the
forecasting task. This investigation emphasizes the
importance of selecting a model that is carefully
tailored to the unique requirements of the forecasting
endeavor to enhance precision in predicting stock
market trends.
REFERENCES
Gao, P., Zhang, R., & Yang, X.:The Application of Stock
Index Price Prediction with Neural Network.
Mathematical and Computational Applications,
25(3),53(2020).
Tsai, C. F., Chen, M. Y., & Chiu, A. S. (2011). Stock price
prediction using hybrid models based on artificial
neural networks and multivariate adaptive regression
splines. Expert Systems with Applications, 38(3), 2177-
2186.
Zhang, G. P. (2003). Time series forecasting using a hybrid
ARIMA and neural network model. Neurocomputing,
50, 159-175
Chen, C. C., & Wei, C. H. (2017). Stock price forecasting
using ARIMA, ANN and SVM techniques. Journal of
Computer Science and Technology, 17(1), 41-49.
Li, C., Zheng, H., & Cheng, L. (2020). Stock price
prediction using LSTM, RNN and CNN-sliding
window model. Journal of Physics: Conference Series,
1467(1), 012052. https://doi.org/10.1088/1742-
6596/1467/1/012052
Bhattacharyya, S., & De, S. (2011). Forecasting stock price
index using hybrid ARIMA and feedforward neural
network. Computational Economics, 37(4), 439-457.
Zhang, G. P. (2003). Time series forecasting using a hybrid
ARIMA and support vector machines model.
Neurocomputing, 50, 159-175.
Zhang, G. P., & Patuwo, B. E. (1998). Forecasting with
artificial neural networks: The state of the art.
International Journal of Forecasting, 14(1), 35-62.
Ghiassi, M., Saidane, H., & Zimbra, D. K. (2005). Hybrid
genetic algorithms for ARMA time series forecasting.
Engineering Applications of Artificial Intelligence,
18(5), 547-554.
Hong, T., & Jeon, H. (2018). Stock price prediction using
attention-based multi-input LSTM. Expert Systems
with Applications, 114, 532-543.
Nitesh Pareek. (n.d.). Nifty 50 Stock Prices Case Study
[Data set].
Kaggle. Retrieved from https://www.kaggle.com/
code/niteshpareek98/nifty-50-stock-prices-case-study
Comparative Analysis of Regression Models for Stock Price Prediction: LSTM, ARIMA, SVM
221
