
Towards Sustainable Cloud Computing: A Comparative Evaluation
of Carbon Footprint Calculator Tools
Eshita Sohani
1a
and Malav Agrawal
2b
1
School of Computer Science, University of Birmingham, Birmingham, U.K.
2
School of Informatics, University of Edinburgh, Edinburgh, U.K.
Keywords: Sustainability, Cloud Computing, Green Computing, Carbon Emissions, Carbon Footprint Calculator Tools.
Abstract: As modern businesses grow; cloud computing has become an indispensable tool thanks to its scalability and
convenience. However, it is essential to recognize the severe impact it has on the environment. Our study
delves into the various carbon footprint calculator tools provided by major players in the cloud industry. By
comparing and contrasting these tools, we shed light on their limitations and strengths, including crucial
aspects like data precision and geographical variations. These tools, however, provide valuable information
but fail to include critical features like real-time tracking of carbon emissions and personalized alerts to
indicate threshold crossings. We also stress the need to monitor other aspects, including often neglected water
utilization and the carbon footprint of these tools themselves. Our analysis suggests combining machine
learning to optimize carbon offsetting measures and calculate carbon footprints dynamically. Furthermore,
cloud providers could integrate real-time monitoring and custom alerts to enhance the user experience. This
study not only analyses the tracking of carbon emissions but also encourages users to actively address their
environmental impact. This critical area of sustainability demands that organizations assess and reduce their
carbon footprint in the Cloud. This can be achieved by adopting eco-conscious cloud computing practices.
This paper offers a comprehensive guide on the subject, including a roadmap for further research. Its
conclusion affirms the importance of addressing cloud computing's environmental impact.
1 INTRODUCTION
Contemporary technology infrastructure is built on
cloud computing in today's digital age [1]. Amidst the
digital world's constantly shifting landscape, the
scalability, efficiency, and adaptability of cloud
computing drive business innovation and process
optimization. However, the often-neglected
environmental impact of cloud services warrants
deeper consideration, especially with the world's
growing dependence on cloud solutions [2]. Aiming
to minimize their environmental impact and increase
their sustainability efforts, organizations globally are
prioritizing the reduction of their carbon footprint in
the face of mounting imperatives to combat climate
change [3]. The environmental impact of cloud
computing compared to traditional on-premises
computing solutions is significant. For instance,
a
https://orchid.org/0000-0002-7062-1107
b
https://orchid.org/0009-0007-8163-3107
Microsoft's cloud is 93% more energy-efficient and
98% more carbon-efficient than on-premises data
centers. Similarly, Google managed a 550% increase
in cloud data centers from 2010 to 2018, with only a
6% increase in energy consumption.
The IT sector's energy consumption and carbon
emissions, encompassing cloud services and data
centers, have been intensely scrutinized [4][5]. As
such, cloud providers have commendably optimized
their operations to address these concerns. A crucial
question arises amidst these efforts to promote
sustainability. How can organizations accurately
measure and reduce the carbon emissions associated
with cloud usage? This is where carbon footprint
calculator tools come into play.
These tools, available from major cloud
providers, are designed to provide data-driven
insights into the carbon footprint of cloud services.
By offering this information, they empower eco-
conscious decision-making and support efforts to
reduce carbon footprint. The realm of carbon
footprint calculators is far from standardized. Every
90
Sohani, E. and Agrawal, M.
Towards Sustainable Cloud Computing: A Comparative Evaluation of Carbon Footprint Calculator Tools.
DOI: 10.5220/0013312100004646
Paper published under CC license (CC BY-NC-ND 4.0)
In Proceedings of the 1st International Conference on Cognitive & Cloud Computing (IC3Com 2024), pages 90-98
ISBN: 978-989-758-739-9
Proceedings Copyright © 2025 by SCITEPRESS – Science and Technology Publications, Lda.

significant cloud provider has their rendition of these
instruments. They diverge in their accessibility to
data, frequency of updates, precision of values,
regional categorization, and how they display
summaries of emissions and savings. Although these
tools provide helpful observations, they each have
advantages and drawbacks. Our research paper takes
a thorough expedition into the realm of cloud carbon
footprint calculators. The approach involves
meticulously examining the tools provided by various
cloud service providers. Customer Carbon Footprint
Tool offered by Amazon Web Services (AWS),
Microsoft Sustainability Calculator provided by
Azure Cloud, Carbon Footprint from Google Cloud
Platform (GCP) and IBM Cloud’s IBM Cloud Carbon
Calculator are analyzed extensively in this work. The
name of the cloud service provider and the name of
the tool offered by it are used interchangeably
throughout the text, unless stated otherwise.
Through this process, we conduct a comprehensive
comparison to uncover the subtleties that differentiate
each one. The goal is to equip individuals and
organizations with a thorough understanding of these
tools to make informed decisions and take steps
towards reducing their carbon footprint when
utilizing and providing cloud services. Our
exploration continues even after this point, and as we
further examine the inner workings of these
calculators, we discover significant deficiencies in
their capabilities. We bring attention to the absence of
a facility for real-time monitoring of carbon
emissions, the incapacity of users to establish
personalized threshold alerts and other ecological
factors that are usually sidelined. Moreover, our
vision for the future involves the progression of these
tools to provide users with the data and practical
methods to counteract their negative impact on the
environment [6]. We propose integrating machine
learning for dynamic carbon footprint calculations
and optimizing carbon offsetting measures. The
vision is to measure emissions and actively engage
users in mitigating their environmental impact.
The study presented in this paper emphasizes that the
only way to reduce the environmental impact of this
growing cloud services industry is to do it passively
by reducing energy consumption and emissions.
Unlike other sectors like manufacturing, active
carbon capture at the source is not feasible. The
remaining paper is organized as follows. Section II is
structured into four parts. Part A details the four cloud
providers' carbon footprint calculation tools. Part B
outlines the sources of data used for comparing these
tools. Part C introduces the comparison framework
that guided the evaluation process. Part D elaborates
on the broader methodology employed for calculating
carbon emissions. Section III presents results and
analysis based on a comprehensive evaluation of
various factors. Section IV outlines potential future
work to enhance the efficiency and accuracy of the
tools for better practical implementation and broader
impact. Finally, Section V concludes the paper.
2 STUDY
The methodology employed in this research paper is
designed to comprehensively compare and evaluate
the carbon footprint calculator tools offered by
various cloud providers. This study aims to assess
these tools' capabilities and limitations, shed light on
their functionalities, and offer insights into how they
contribute to sustainable cloud computing practices.
It also aims to help customers choose eco-friendly
cloud services that align with sustainability goals and
save money [7]. Furthermore, it improves the
understanding of the environmental impact of cloud
computing and encourages providers to reduce their
carbon footprint. This leads to more robust and
reliable carbon measurement tools.
2.1 Overview of the carbon calculator
tools
1. Customer Carbon Footprint Tool by
AWS- The AWS Customer Carbon Footprint
Tool allows users to examine the estimated carbon
footprint associated with using AWS services,
facilitating the accurate assessment of an
organization's overall carbon footprint and
monitoring emissions reductions over time. The
tool utilizes the Greenhouse Gas Protocol to
calculate estimates, presenting the information
through easily comprehensible data
visualizations. Access to the Customer Carbon
Footprint Tool is available through the billing
dashboard, requiring a new AWS identity and
access management permission.
2. Users are offered various options to
customize their analysis by setting preferred
periods. The estimates are delivered monthly,
allowing users to review data as far back as
January 2020 retrospectively. As users configure
their desired time frames, the dashboard
dynamically updates to display the estimated
carbon emissions generated during the selected
periods. Users will find five distinct sections
within the tool offering insights into their carbon
emissions from AWS services. The first section
Towards Sustainable Cloud Computing: A Comparative Evaluation of Carbon Footprint Calculator Tools
91

presents estimated AWS emissions, depicted in
green, representing the combined scope one and
scope two carbon footprint for the selected time,
measured in metric tons of carbon dioxide
equivalent.
3. To offer context, the tool utilizes data
sourced from 451 Research, an advisory
organization that is part of S&P Global Market
Intelligence, to calculate the carbon emissions
saved by operating workloads on AWS rather than
on premises. Users can gain visibility into the
geographic distribution of their emissions,
derived from the specific services used in each
AWS region and aggregated by geography.
4. Furthermore, the tool furnishes a
breakdown of emissions by broad AWS service
based on users' historical usage. Users have the
flexibility to review emission changes over time,
with data available monthly, quarterly, or yearly.
Additionally, the tool offers a forecast of future
carbon emissions based on current AWS usage
patterns and AWS' renewable energy project
roadmap. This projection illustrates how carbon
emissions will evolve over the coming years.
Users can observe changes in their forecast as
their usage patterns shift, and AWS introduces
new renewable projects globally. This dynamic
feature allows users to track and anticipate
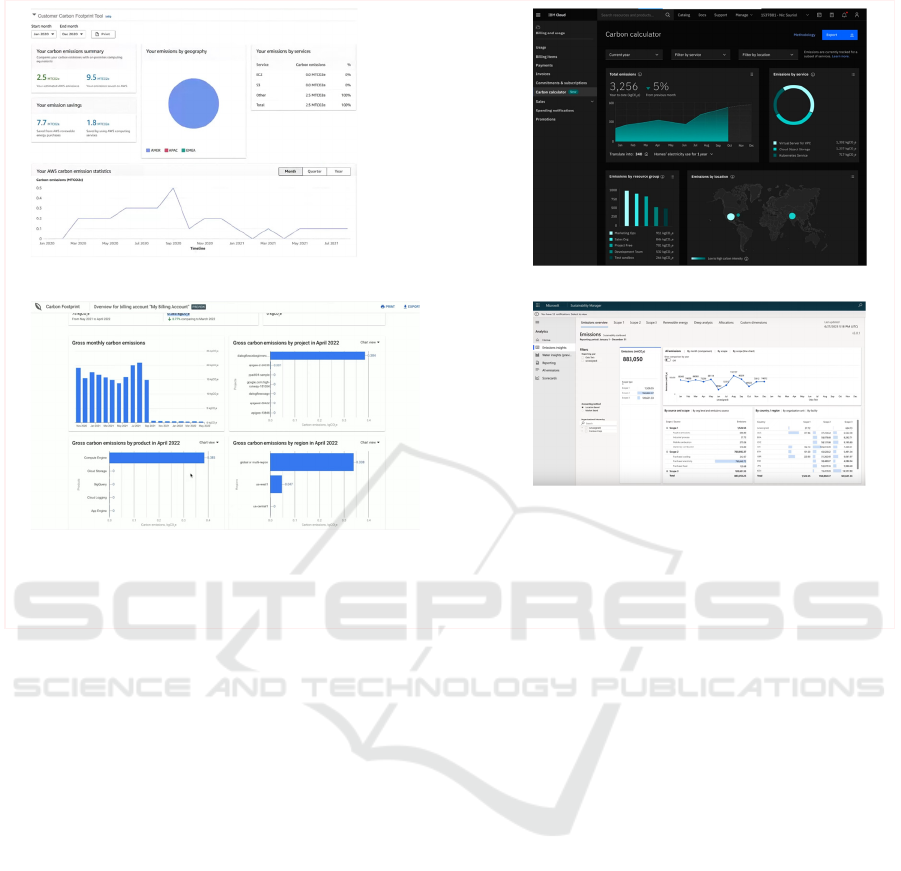
alterations in their carbon footprint over time. Fig.
1(a) illustrates the dashboard of Customer Carbon
Footprint Tool By AWS.
IBM Cloud Carbon Calculator- The Cloud
Carbon Calculator Dashboard offers clients
access to emissions data for various IBM Cloud
workloads, including High 1 Performance
Computing (HPC) and financial services. This
tool presents a range of features for tracking
carbon emissions, allowing users to view total
emissions by service, resource group, and
location. Additionally, it facilitates data analysis
by enabling the filtering of emissions data based
on time period, service, or location and supports
data export in CSV format for further
examination. The calculator helps explicitly
estimate electricity consumption and associated
greenhouse gas (GHG) emissions for select IBM
Cloud services, thus providing insights on a per-
account, per1service, per-location, and resource
group basis. Fig. 2(b) shows the Carbon
Calculator dashboard offered by IBM cloud.
Carbon Footprint by Google Cloud- In the
Google Cloud environment, a dedicated carbon
footprint dashboard is accessible through the
console, providing visibility to individuals with
billing admin rights. This dashboard features
precise infographics, offering comprehensive
insights into total emissions categorized by
project, month, product, region, and more. The
same functionality extends to Workspace
customers, ensuring a consistent user experience.
Users also have the option to export the data to
BigQuery, facilitating custom analytics and
visualizations. This exported data can be utilized
to meet sustainability reporting requirements,
particularly in the auditing of scope three
greenhouse gases.
Carbon Footprint builds its calculations from
bottom to top, relying heavily on machine-level
power and activity monitoring inside Google data
centres.
Google has introduced a key metric, the Carbon-
Free Energy Percent (CFE), to empower users to
select regions with higher CFE percentages.
Regions with higher CFE percentages are
preferable as they contribute to fewer carbon
emissions. This information is integrated into
many of Google Cloud's products, and when users
choose a region, a user-friendly low CO2 icon is
displayed in the Cloud Console. Additionally, this
icon is annotated on the locations page of the
documentation for various products, enhancing
user awareness of the environmental impact
associated with their choices. Fig. 3(c)
pictorializes how Carbon Footprint by GCP
provides emissions summary.
Microsoft Sustainability Calculator by Azure-
The Emissions Impact Dashboard, powered by
Microsoft Power BI and Microsoft Azure Data
Explorer, allows employees to monitor the
environmental impact of their Azure virtual
machine usage. It encourages proactive measures,
such as optimizing design systems or downsizing
virtual machines based on real-time data. The
IC3Com 2024 - International Conference on Cognitive & Cloud Computing
92
dashboard integrates seamlessly with the
Sustainability Manager, offering a connector to
import data for tracking carbon emissions across
different scopes, including scope three emissions
from Azure services. Access to this dashboard
requires an Enterprise Agreement (EA)
enrollment number, billing account ID, and admin
access. It ensures transparency by utilizing billing
information to allocate carbon emissions,
respecting user privacy and permission settings.
Specifically designed for Microsoft 365, the
Power BI app provides a clear quantitative
overview of greenhouse gas emissions associated
with organizational use, including Teams calling,
file storage, and SharePoint. Verified by a third
party, the methodology covers all three scopes of
emissions. The Emission Savings tab estimates
the avoided greenhouse gas emissions achieved
by using the Cloud over on-premises alternatives,
emphasizing the up to 98 percent higher carbon
efficiency of the Microsoft cloud. Users can
customize estimates based on on-premises
efficiency and the volume of renewable energy
purchased by their organization. Fig. 4(d) depicts
the Emissions Insights as displayed on Microsoft
Sustainability Calculator.
2.2 Data Sources and Collection
The carbon footprint calculator tools and official
documentation provided by the respective cloud
providers are the main data sources for this research.
Our sources include press releases and
announcements from major providers like Google
Cloud Platform, AWS, Microsoft Azure, and IBM
Cloud. Collecting data involves obtaining and
analyzing information about the functions,
characteristics, and technical specifications of each
calculator tool [8][9][10][11]. Not only that; also,
apart from these we dig into any other probable
unveiled dimensions surrounding these calculators to
ensure a comprehensive review.
2.3 Comparison Framework
To facilitate a structured and meaningful comparison,
we have established a comprehensive framework that
considers a range of critical factors:
• Cost: Cost involved in using carbon calculator tools
for emissions measurement and management.
• Data Availability and Frequency: Indicates the
accessibility and update frequency of carbon
emissions data within the tools.
a
b
c
d
Fig. 1 (a) Customer Carbon Footprint Tool dashboard by AWS, (b) Carbon Calculator dashboard by IBM, (c) Overview
dashboard of Carbon Calculator by GCP, (d) Emissions Insights on Microsoft Sustainability Calculator by Azure.
Towards Sustainable Cloud Computing: A Comparative Evaluation of Carbon Footprint Calculator Tools
93

• Rounding of Emission Values: Sheds light on the
precision and accuracy of the emissions reporting.
• Presentation of Emissions and Savings
Summaries: Describes how the tools display
estimated carbon emissions and emissions savings,
often compared to on-premises workloads.
• Geographical Breakdown of Emissions: Shows
the carbon emissions data categorized by
geographical regions, like continents or countries.
• Breakdown by Specific Cloud Services: Displays
carbon emissions linked to specific cloud services.
For example, EC2 vs S3 emissions in AWS cloud.
• Emissions Trends Over Time: Illustrates how
historical carbon emissions data is presented over
time (e.g., monthly, or yearly).
• Path to Renewable Energy Adoption: Graphically
represents how carbon emissions decrease as the
cloud provider transitions to renewable energy
sources.
• Adherence to Recognized Standards: This ensures
if the tools follow established norms, like the
Greenhouse Gas Protocol and ISO standards, for
reliable measurements. This involves Scope 1
emissions indicating direct emissions from an
organization's activities, Scope 2 emissions cover
indirect emissions from purchased electricity while
Scope 3 emissions refer to indirect green-house gas
emissions that occur from activities outside an
organization's direct control.
• Consideration of Regional Variations: Considers
regional differences in emissions based on the energy
grid mix.
• Differentiation Between Estimates and Actual
Emissions: Distinction between estimated and actual
emissions for transparency.
• Integration with Provider’s Carbon Reporting
Framework: Refers to how well the carbon reporting
framework integrates with the organization’s
sustainability reporting, enabling organizations track,
evaluate, and report their carbon emissions and other
sustainability factors.
2.4 Calculation of carbon emission
Calculating the carbon footprint of cloud services
involves a step-by-step process [12]. First, the tools
and service providers collect information about the
services used along with their respective quantities.
Next, they determine the energy usage as a function
of cloud utilization and computation resource
requirements. The next step is to obtain the total
emissions by multiplying the electricity consumption
by the corresponding carbon emissions per unit of
electricity usage to calculate the total emissions.
Here, the carbon emissions per unit of electricity
usage vary with location and the carbon intensity of
the source used to power the respective data centres
[13].
These tools may normalize the result to ensure
fairness, measuring emissions per service unit. The
objective is to comprehend and compare the
environmental impact of diverse online activities.
Although all the primary carbon emissions tools
employ a similar methodology to estimate the carbon
footprint, slight variations exist. AWS's Customer
Carbon Footprint tool follows the Greenhouse Gas
Protocol (GHG) to calculate its carbon footprint. IBM
Cloud Carbon Calculator uses a non-automated,
report-based process. It allocates a portion of the
electricity consumption to each one of the services in
a location based on the physical hosts being used.
It is essential to note that the accuracy of these
calculations relies on the information provided by the
companies delivering these online services. There is
a lack of literature on the elaborate implementation of
these services in the public domain.
3 RESULTS AND ANALYSIS
Table 1 comprehensively compares the key features
of major cloud providers. AWS and GCP offer their
carbon calculators free of charge, providing a low
barrier to entry for users looking to assess their
environmental impact. On the other hand, Azure
requires a Power BI Pro license for installation and
use. IBM Cloud’s carbon calculator is complimentary
with the billing service, which also costs similar.
GCP excels in data update frequency by providing
daily updates, ensuring users can access the most
current information. At the same time, Azure and
IBM Cloud offer monthly updates. GCP also leads in
data availability, allowing users to access the
previous year’s data. At the same time, AWS and
IBM Cloud have data availability of 36 months, while
Azure keeps data for the last 2 years.
AWS, Azure, and GCP round their emissions
values, albeit to varying decimal places. In contrast,
IBM Cloud rounds emissions values to the nearest
whole number of metric tons of carbon equivalent
(MtCO2e), potentially sacrificing granularity for
simplicity.
AWS and Azure offer summaries of estimated
emissions and potential savings relative to on-
premises workloads. GCP excels in this area,
providing a comprehensive overview of gross carbon
emissions, carbon-free energy percentages, and
average emissions intensity of the electricity grid.
IC3Com 2024 - International Conference on Cognitive & Cloud Computing
94

IBM Cloud focuses on total emissions, resource
groups, and location summaries. However, it does not
offer information on potential savings, possibly
missing an opportunity to showcase the
environmental benefits of cloud migration.
Organizations with global operations need to factor in
the distribution of emissions around the globe. AWS,
Azure, and GCP provide insights into regional
emissions. However, AWS groups regions by North,
Central, and South America (AMER) and Europe, the
Middle East, and Africa (EMEA), whereas GCP
offers a more detailed breakdown. IBM Cloud offers
a geographical breakdown but does not elaborate on
the carbon emissions factor of each location.
AWS, Azure, and GCP offer emissions breakdowns
by specific services, empowering users to pinpoint
areas of concern. IBM Cloud follows suit but also
provides information on the electricity consumption
of each service, enhancing the tool’s utility.
AWS, Azure, and GCP offer visualizations
illustrating the path to renewable energy adoption,
aligning with their sustainability commitments.
Although committed to similar goals, IBM Cloud
does not provide forecasts related to renewable
energy adoption. This could be an area for
improvement to showcase IBM's commitment to
sustainability. All companies adhere to the
Greenhouse Gas Protocol and ISO requirements for
greenhouse fuel reporting while contrasting the
divide between estimates and actual emissions. Only
AWS lags in considering scope three emissions
among the four.
This comparison highlights limitations, emphasizing
the need for more precise calculators. It also guides
the strategy for developing a robust cloud carbon
footprint calculator and how companies can adapt by
integrating advantageous features from other
providers if they lack tools. Moreover, this
comparison proves invaluable for hybrid cloud usage,
helping users identify which service emits fewer
carbon emissions within each cloud provider,
ultimately aiding in selecting the most eco-friendly
and cost-effective cloud provider for specific
workloads. This supports a multi-cloud approach to
minimize carbon emissions.
Although these tools are primarily designed to
mitigate and manage environmental impacts,
particularly carbon emissions, they also
offer cost benefits. Optimizing resource allocation by
identifying inefficiencies can significantly cut
operational expenses. Monitoring energy
consumption enables businesses to adopt energy-
saving measures, reducing electricity bills and overall
costs. Additionally, prioritizing renewable energy
adoption supports sustainability goals, stabilizes
energy costs, and reduces expenses.
It's important to note that exact statistics regarding
carbon emissions, energy efficiency, and other
environmental impacts depend on various factors
such as usage patterns, services employed, cloud
provider, and usage intensity. These statistics are
typically accessible to users through their respective
cloud dashboards. While this paper provides thorough
insights and analysis, the actual numerical values may
vary based on specific usage scenarios and
configurations.
4 FUTURE DIRECTIONS
The comparative analysis of carbon emission
calculator tools has unearthed numerous crucial areas
for future exploration and enhancement. These
regions embody the following areas.
Real-time Carbon Emission Calculation: One
observation is the absence of tools providing real-
time carbon emission statistics. Such real-time
information holds enormous value for numerous
reasons: real-time emission monitoring and
assessment, resource optimization, real-time alerts,
and compliance.
Threshold Based Alerts: Currently, carbon emission
tools cannot set personalized thresholds, triggering
alerts if emissions cross the set limit. This feature, like
cost tracking from providers like AWS, empowers
customers to plan their usage and proactively be
mindful of their emissions.
Self-Emission of Tools: It is imperative to understand
that the tools' constant monitoring, calculations and
relaying of carbon emissions data can add to the
overall values, even in modest quantities. This
cumulative impact must be recounted and addressed
as a part of improvement and optimization.
Comprehensive Environmental Impact Reporting:
Future updates of the tools should encompass
dashboards and sections committed to displaying a
broader spectrum of environmental impacts due to
various cloud activities, like water utilization and
emissions, during the establishment of the cloud
infrastructure.
Carbon Offset Integration: Future advancements
should include features that guide users in reducing
their carbon footprint. This can be achieved by
connecting the tool to carbon offset registries,
Towards Sustainable Cloud Computing: A Comparative Evaluation of Carbon Footprint Calculator Tools
95

Table 1. Comparison of Carbon Calculator Tools by Various Cloud Providers.
allowing users to find and select projects that balance
out their carbon emissions. Moreover, there could be
a default choice suggesting tree planting, as a single
tree can offset about one metric ton of carbon dioxide
during its lifetime. Additionally, automated
reminders can be sent to users at regular intervals,
recommending carbon offsetting methods based on
their usage patterns. This encourages active steps to
reduce one's environmental impact.
Features
Customer Carbon
Footprint Tool by
AWS
Microsoft
Sustainability
Calculator b
y
Azure
Carbon Footprint
by Google Cloud
IBM Cloud Carbon
Calculator by IBM
Cost and Accessibility
Free
Power BI Pro
licence required to
install the tool
Free Free with billing service
Data Availability and
Frequency
Three-month
delayed update,
data availability
for past 36 months
Monthly updates,
data availability for
past 2 years
Daily updates,
data availability
for past 1 year
Monthly updates, data
availability for past 36
months
Rounding of Emission
Values
Rounded to the
nearest two
decimal places
Rounded to the
nearest whole
number
Rounded to the
nearest two
decimal places
Rounded to the nearest
whole number
Presentation of
Emissions and Savings
Summaries
Relative to on-
premises
workloads
Relative to on-
premises workloads
Overview of gross
carbon emissions,
carbon free energy
percentages, and
average emissions
intensity of the
electricity grid
Total emissions, resource
group, and location
summaries
Geographical
Breakdown of
Emissions
Yes, grouped by
AMER and
EMEA
Yes, detailed
breakdown by
source, scope, region
etc
Yes
Yes, but does not elaborate
on the carbon emissions
factor of each location
Breakdown by Specific
Cloud Services
Yes Yes Yes
Yes, also provides
information on the
electricity consumption of
each service
Emissions Trends Over
Time
Yes, monthly,
quarterly, or
annual views
Yes, monthly,
quarterly, or annual
views
Yes, monthly,
quarterly, or
annual views
Yes, monthly, quarterly, or
annual views
Path to Renewable
Energy Adoption
Yes Yes Yes No
Adherence to
Recognized Standards
Yes, Greenhouse
Gas Protocol and
ISO
requirements;
includes Scope 1
and 2 emissions
Yes, Greenhouse
Gas Protocol and
ISO requirements;
includes Scope 1, 2,
and 3 emissions
Yes, Greenhouse
Gas Protocol and
ISO
requirements;
includes Scope 1,
2 and 3 emissions
Yes, Greenhouse Gas
Protocol and ISO
requirements; includes
Scope 1, 2 and 3 emissions
Consideration of
Regional Variations in
Emissions
Yes Yes Yes Yes
Differentiation Between
Estimates and Actual
Emissions
Yes Yes Yes Yes
Integration with
Provider’s Carbon
Re
p
ortin
g
Framewor
k
Yes Yes Yes Yes
IC3Com 2024 - International Conference on Cognitive & Cloud Computing
96

Machine Learning for Real-time Calculation: More
accurate machine learning models can be
incorporated to bridge the gap between the estimates
and actual emissions by leveraging cloud usage
patterns and emissions data. Also, Machine learning
offers carbon footprint reduction advice by
suggesting practices like data deduplication, thin
provisioning, tiered storage, energy-efficient
hardware selection, optimal data centre locations, and
efficient cooling systems [14]. The lack of available
literature and implementation indicates this is
relatively unexplored territory. We see significant
potential in properly leveraging ML for enhanced
accuracy and facilitating the implementation of
offsetting measures [15]. For instance, understanding
how much carbon can be generated based on usage
and proposing corresponding measures represents an
area where ML could make a valuable impact. Our
proposal recognizes the necessity for exploration and
advancement in this domain.
In essence the development of carbon emission
calculation tools should prioritize measurements.
Offer services that deliver actionable insights to
support sustainability initiatives. Features like real
time monitoring, threshold alerts, comprehensive
environmental reporting and integration with carbon
offsetting mechanisms can transform these tools into
resources for organizations committed to reducing
their carbon footprint while promoting sustainability.
5 CONCLUSION
The technological marvels of the today's era are built
on reliant cloud services. Hence, it is important not to
undermine the environmental impacts caused by the
rapid expansion of cloud services. Few major players
power most of the cloud services available today, and
often in the pursuit of profits and expansion, the
impact of this growth is neglected.
This paper delves into the carbon footprint
calculator tools by these major players. The study
examines the carbon monitoring tools by cloud
service providers like Google Cloud, Amazon Web
Services, Google Cloud Platform, and IBM Cloud
and sets them apart by pointing out their subtleties
and nuances. Though these tools offer insights into
carbon emissions, they lack in real time tracking and
the facility to enable personalized threshold alerts.
This study is a call for action to all the cloud service
providers. Our study advocated for accountability by
spreading user awareness regarding their usage and
emissions while allowing for options to offset the
carbon footprints. By ecological practices in cloud
computing, we can strive towards a coexistence of
technology and sustainability.
REFERENCES
1. S. Thakur and A. Chaurasia, “Towards Green Cloud
Computing: Impact of carbon footprint on
environment,” in Proceedings of the 6th International
Conference - Cloud System and Big Data Engineering
(Confluence), Noida, India, 2016, pp. 209-213. doi:
10.1109/CONFLUENCE.2016.7508115.
2. K. Kinkar, P. Bhosale, A. Kasar, and V. Gutte, “Carbon
Footprint Analysis: Need for Green Cloud Computing,”
2022 International Conference on Electronics and
Renewable Systems (ICEARS), Tuticorin, India, 2022,
pp. 1-6. doi: 10.1109/ICEARS53579.2022.9752341.
3. K. Arora and R. Sharma, “A Review on Green Cloud
Computing as a Step Towards Promoting Sustainable
and Eco-friendly Computational Approach,”
International Journal of Scientific Research in
Computer Science, Engineering and Information
Technology (IJSRCSEIT), vol. 9, no. 2, pp. 608-612,
2023. doi: 10.32628/CSEIT2390288
4. A. Atrey, N. Jain, and N. C. S. N. Iyengar, “A Study on
Green Cloud Computing,” International Journal of Grid
and Distributed Computing, vol. 7, no. 1, pp. 25-36,
2014, doi: 10.14257/ijgdc.2013.6.6.08.
5. U. Awada, K. Li, and Y. Shen, “Energy Consumption
in Cloud Computing Data Centers,” International
Journal of Cloud Computing and Services Science (IJ-
CLOSER), vol. 3, 2014. doi:
10.11591/closer.v3i3.6346.
6. C. R. Chowdhury, A. Chatterjee, A. Sardar, S. Agarwal,
and A. Nath, “A Comprehensive study on Cloud Green
Computing: To Reduce Carbon Footprints Using
Clouds,” International Journal of Advanced Research in
Computer Science, pp. 77-84, 2013.
7. L. R. Jahangard and A. Shirmarz, “Taxonomy of green
cloud computing techniques with Environment Quality
Improvement Considering: A survey,” International
Journal of Energy and Environmental Engineering, vol.
13, no. 4, pp. 1247-1269, 2022. doi: 10.1007/s40095-
022-00497-2
8. Amazon Web Services, Inc. (2021). AWS Customer
Carbon Footprint Tool. Retrieved from:
https://aws.amazon.com/abou/aws- /sustainability/
9. Microsoft. (2021). Emissions Impact Dashboard for
Azure. Retrieved from: https://azure.microsoft.com/en-
us/resources/cloudcomputing/dictionary/what-is-
azure-carbon-calculator/
10. Google Cloud (2021). GCP Carbon Calculator.
Retrieved from:
https://cloud.google.com/blog/topics/sustainability/the
-carbon 1 freeenergy-percentage-of-google-cloud-
exceeds-90/
11. IBM. (2021). IBM Cloud Carbon Calculator. Retrieved
from: https://www.ibm.com/cloud/sustainability
12. C. Li, "Key technologies of cloud computing oriented
carbon footprint quantification model," The
International Conference on Forthcoming Networks
and Sustainability (FoNeS, 2022), Hybrid Conference,
Nicosia, Cyprus, 2022, pp. 678-682, doi:
10.1049/icp.2022.2533
Towards Sustainable Cloud Computing: A Comparative Evaluation of Carbon Footprint Calculator Tools
97

13. A. M. Farooqi, M. T. Nafis, and K. Usvub,
“Comparative Analysis of Green Cloud Computing,”
International Journal of Advanced Research in
Computer Science, vol. 8, no. 2, pp. 100-104, March
2017. doi: 10.26483/ijarcs.v8i2.2929
14. S. Manchanda and M. S. Bajwa, “Scrutinizing Various
Approaches towards Green Cloud Computing,”
International Journal of Advanced Networking and
Applications, Special Conference Issue: National
Conference on Cloud Computing & Big Data, pp. 153-
158.
15. Q. Nguyen, I. Diaz-Rainey, and D. Kuruppuarachchi,
“Predicting corporate carbon footprints for climate
finance risk analyses: A machine learning approach,”
Energy Economics, Elsevier, vol. 95, 2021. doi:
10.1016/j.eneco.2021.105129
IC3Com 2024 - International Conference on Cognitive & Cloud Computing
98
