
Application of Deep Learning in Tourist
Daniel Samwel Makala
a
and Li Zongmin Li
b
Department of Computer Science, China University of Petroleum (East), Qingdao, China
Keywords: Deep Learning, Machine Learning, Prediction Analysis, Forecasting, Neural Networks.
Abstract: One of the Giant sectors in Tanzania is Tourism. About 40% of the foreign exchange in Tanzania comes from
this sector. It is the number one job provider to Tanzanians, about 10% of the working class is in the tourism
sector. Since independence, the sector has been growing well until 2019 during the pandemic issue of COVID-
19. However, since 2020 Tanzania has regained and restored the tourist income to normal and expected more
tourists. Government and Authority are in the age of determining the number of tourists to come and the
income associated with the tourist for better planning. Forecasting tourist inflows requires an accurate model
because of the highly changing tourist data due to external factors such as political influence, security issues,
or transportation issues. This study analyses and proposes the CNN to be used for the prediction of tourist
arrival. CNN can handle and process multiple sequences and thus can handle data and multivariate time series.
Using data from 1961 to 2022, of Tanzania's arrival, the proposed model was able to predict with more
accuracy compared to ARIMA, LSTM, and CNN-LSTM by having 0.1 RMSE. However, the study is limited
due to the unavailability of daily tourist income.
1 INTRODUCTION
1.1 Overview of Tanzania Tourism
Tanzania is one of the most beautiful countries in the
attraction of visiting and tourism. She is most famous
for her natural gorgeous and rich cultural heritage.
She is home to the beautiful highest mountain in
Africa, Mount Kilimanjaro, and the world's number
one natural national park, Serengeti National Park.
Not only those two Tanzania has abundant attractions
including Zanzibar Island, Ngorongoro creator
among many others. Because of this beautiful nature,
the demand for quality tourism services has
increased. The Tanzanian tourism industry
contributes a lot to the Tanzanian economy. It
contributes about 17% to the national GDP of the
country and 35% of all foreign exchange revenues.
According to government statistics, the tourism sector
provides direct and indirect employment to the
people. It was recorded in 2018 that this sector gave
out 2.6 million jobs to the people. This means the
tourism sector in Tanzania is one of the major job
providers. (Kyara et al., 2022).
a
https://orcid.org/0000-0003-3827-2346
b
https://orcid.org/0000-0003-4785-791X
It is all known that the pandemic of covid 19
disturbs each economic sector everywhere. This
tragedy spared no sector as the tourism sector also
faced this challenge. This is because of many
countries’ restrictions on traveling, and it was
predicted that international tourism would fall by
80% (Henseler et al., 2022). Before COVID-19, this
sector was the leading foreign exchange earner in
Tanzania. From late 2021, the sector is regaining
momentum, and the government has to lift the sector
to its peak. One of the ways used by the government
is the introduction of the royal tour (Tanzania
Tourism Sector - February 2023 Update, n.d.). The
royal tour involves the President of Tanzania as the
tour guide. The president's ultimate guide for a week,
unveiling Tanzania’s history, environment, music
foods, and culture, as well as telling the stories of
Tanzania’s hidden jewels. The CEO of the Hotel
Association in Tanzania said We hold better positive
projections in 2023. If the income of tourists increases
at this rate, then we can call it a full recovery at least
by the end of this year (Tanzania Tourism Sector -
February 2023 Update, n.d.).
With the increase in popularity, it comes with the
responsibility as it is very crucial to manage the
248
Makala, D. S. and Zongmin, L.
Application of Deep Learning in Tourist.
DOI: 10.5220/0013342500004646
Paper published under CC license (CC BY-NC-ND 4.0)
In Proceedings of the 1st International Conference on Cognitive & Cloud Computing (IC3Com 2024), pages 248-256
ISBN: 978-989-758-739-9
Proceedings Copyright © 2025 by SCITEPRESS – Science and Technology Publications, Lda.

number of visitors entering the countries to maintain
better environments for the attractions as well as to
ensure the environment is not damaged or
overwhelmed by tourists. Thus, it is essential to
determine the volume of people (tourists) visiting the
country over time. Forecasting the income of tourists
will enable stakeholders in the tourism sector to
provide a memorable experience for their tourists and
hence a country gets better recommendations to
attract more tourists. A better prediction model is
needed.
This study uses the Tourism sector in Tanzania as
a case study as Tanzania is one of the countries doing
better in the tourism sector. This case study will
represent the tourism sector around the world.
1.2 Background of the Study
As discussed in the earlier segment, it is important to
forecast the number of tourist arrivals in any country
for better tourism service. This article focuses on
identifying the best deep learning model to be used
for forecasting the volume of tourist arrivals with the
case study of Tanzania. Nevertheless, the study also
engaged in comparing the results of the proposed
model with the real data to see how the model has
performed. Lastly, the study uses the model to focus
on the volume of tourist arrivals in Tanzania.
In this study, the deep learning mole is considered
since deep learning has been showing a greater
impact in the prediction analysis of times series. The
CNN model is proposed to be used in the prediction
of tourism arrival in Tanzania. The CNN model has
been performing wonders in the health sector,
especially in image recognition and speech
recognition. Because of the better performance of the
model in images, the study proposed this model to use
the features in the models to capture the trend
movement of the tourism arrival, as it is known the
nature of the number of tourists is very volatile and
non-linear. Therefore, the proposed model will be a
suitable model for capturing all the trend movement
of time series data such as the number of income
tourists. The proposed model will be compared with
another popular traditional model of ARIMA and
Deep learning models of LSTM as well as CNN-
LSTM models.
2 RELATED WORKS
2.1 Introduction
Related work is simply a summary of existing
research and study published materials related to a
certain topic. It gives out what some researchers have
done about that specific topic. It also provides more
sources of information for easy understanding. This
part of the related work surveys the available
literature to identify current trends and gaps in
knowledge, while also providing context for future
studies. Different studies have indicated that the way
of forecasting is categorized in two ways which are
linear way and non-linear ways. (Y. Li & Cao, 2018).
However, according to, there are three ways of
forecasting, these are time series way, Artificial
intelligence, and economics. But time series and
econometric ways are sometimes known as
traditional ways.
For a long time, prediction and forecasting have
been conducted. In previous years linear methods
were highly used although they were not able to
capture all the non-linearity data for prediction.
Sometimes complex models may not perform as
perfectly as simpler techniques. (Choy, 1984).
“Because of the influence of external forces such as
public health, economic crises, and seasonal
variations, the tourism arrival time series data have
become more complex, and nonstationary as a result,
it is tremendously challenging to obtain satisfactory
results when dealing with the prediction of such
dataset” (Goh et al., 2008).
Different researchers and academicians have
discussed the tourism sector in Tanzania. Much more
the discussion is based on how tourism employs
Tanzanians. It is found that about 5% of GDP is from
the tourism sector and this is incline in future time.
The tourism sector provides 10% of the working
population in Tanzania. The sector is a leading sector
in contribution to foreign exchanges. (Wamboye et
al., 2020)
2.2 Traditional Forecasting Models
ARIMA method has been extensively used in
prediction and forecasting. This model can take into
account seasonality variation and that is often used in
the tourism sector, since one of the factors that affect
the income of tourists is the season of the year. Take
the example of (Bumthang, 2018), who researched
forecasting international tourists visiting Bumthang
in Bhutan. The data used are from January 2017 to
June 2017. The out of their research shows that
Season Arima (0,0,0) *(1,1,0) performs very well
with an accuracy of 91%. More to that (Petrevska,
2017) also conducted a study using 58 observations
of the data arrival to Macedonia from 1956 to 2013.
The result shows that the ARIMA (1,1,1,) is suitable
for forecasting tourists in Macedonia and predicted
Application of Deep Learning in Tourist
249

that by 2018 the arrival of tourists will increase by
13.9%.
Besides the ARIMA model, the economic method
known as the Vector Autoregressive model (VAR) is
another prediction technique that is doing very well.
The VAR model relies on one element depending on
the other element. This implies that, to perform with
VAR two or more variables are needed and must
relate to each other. (Vector Autoregression (VAR) -
Comprehensive Guide with Examples in Python -
Machine Learning Plus, n.d.). This model has been
used in tourism demand by different researchers,
(Witt & Witt, 1995; Wong et al., 2006).
(Choy, 1984)“Conducted and investigated a
comprehensive method for tourism demand analysis.
This accurate and systematic approach is based on the
Bayesian global vector autoregressive model
(BGVAR). They deal with the income of
international tourists in nine Countries of Southern
Asia.” The outcome of their research shows BGVAR
to perform better than the other three different VAR
models. They conclude by outlining the superiority of
their model and how powerful it is in forecasting
tourism in Asia and time series in general.
It is true many studies show wide usage of
traditional models, this indicates how powerful
ARIMA is among the traditional. (Huang & Min,
2002) And in studies on the demand for tourists in
Taiwan. (M. Li et al., 2023) Among others, all show
how the ARIMA model is successful, but the model
performs well when dealing with the linearity of the
data only. Similarly, the VAR model to predict the
flow of tourists in Macau, Germany, and British
forecasted demand in Greece, and forecasted tourism
ex-port and export price of the EU-15, respectively.
All the above researchers found VAR to be the best
model. However due to the complexity and large
volume of data available now days Deep learning has
become a solution for the problem of non-linear data.
Different traditional models have been used in
tourism sectors such as elaborated by (Astuti et al.,
2018; Yue et al., 2017).
The traditional models have some weaknesses
that lead to the development of artificial intelligence
models especially deep learning modes. These
include reliance on historical data and linear models,
falling short of capturing the complexities of the
modern world, failure to capture the non-linear
relationship of the variables as well as failure to
handle large volumes of data.
2.3 Deep Learning Models
Artificial Intelligence can be defined by dozens of
definitions. Some research explains (AI) Artificial
intelligence as the power of computers and machines
to impersonate the problem-solving and decision-
making capabilities of the human mind. (What Is
Artificial Intelligence (AI) ? | IBM, n.d.). AI is where
the world is and deep Learning is the feature. The
tourism sector also heavily applied DL techniques in
different ways. (Kontogianni et al., 2022). For a better
plan of tourist policy, accurate tourism demand
forecasting plays an important factor. However,
making predictions about tourism is very complex
and not in linear form. And here is where Deep
Learning Models come in.
(Essien & Chukwukelu, 2022) In their study, the
aim is to “provide an efficient evaluation of the
existing literature on the applications of deep learning
(DL) in hospitality, tourism, and travel as well as an
agenda for future research”. Their study is based on a
review case analysis. Their study concentrates on the
five years of data from 2017 to 2021, basically
journals from Springer, Science Direct, Emerald
Insight, and Wiley Library. They found out that
“Deep learning is mainly used to develop novel
models that create business value by forecasting (or
projecting) some parameter(s) and promoting better
offerings to tourists”.
Other researchers proposed a hybrid model of
SARIMA-CNN-LSTM intending to forecast the
tourist demand using daily data. Here SARIMA
captures the linearity of the data structure, CNN
captures nonlinear data features and LSTM captures
the long-term dependencies in the data. Combining
all these three models ensures they capture every
feature of the data. The results show the proposed
model of the SARIMA-CNN-LSTM has greater
forecasting accuracy compared to the individual
model. We all know forecasting the flow of tourists is
at an important level for the government and
authorities. (Y. Li & Cao, 2018) uses LSTM to
predict the flow of tourists where the proposed model
performs better than ARIM and Back Propagation
Neural Network (BPNN). More to that, (Wu et al.,
2020) whose study aimed at forecasting the daily
arrival of tourists in Macau China, proposed to use the
hybrid mode of the SARIMA-LSTM approach. The
results indicate the hybrid model performs well.
Again (Chang & Tsai, 2017) compare the SVM, NN
and Deep learning applied neural network, by using
the MAPE as a measurement of performance they
find deep learning applied Neural Network has a
MAPE of 2.05% while the other models have a
MAPE of 10%.
IC3Com 2024 - International Conference on Cognitive & Cloud Computing
250

However deep learning models have resolved the
issues raised in traditional models. As we all know
nothing is perfect, the deep learning models have
some shortcomings too which include that, they
perfectly work well when a large dataset is involved.
Also, the algorithm of DL models is much more
complex. To try to resolve these issues the study uses
the CNN model to ensure the mentioned issues are
resolved with the main focus being to get the greatest
model in the prediction of tourist arrival.
3 METHODOLOGIES
3.1 Introduction
The emphasis of this study is to find the best model
for the prediction of tourist arrival using the case
study of Tanzania tourist arrival. To achieve this
target, the deep learning model of CNN is proposed
since the model has been doing an amazing job in
various tasks such as image recognition, playing
complex games, car-self driving, and speech
recognition. The model is then compared with
ARIMA, LSTM, and the hybrid model of CNN-
LSTM. There here our proposed model together with
comparison models is explained in the methodology
section.
3.2 Data Collection and Processing
Making predictions about tourism is very complex
and not in linear form. And here is where Deep
Learning Models come in. One of the key aspects of
any research study and to have data. The data may be
collected from different sources such as interviews,
questionnaires, captured from different platforms, or
even face-to-face conversations depending on the
nature of your study. Due to the high increase in the
usage of technology, and the availability of large
volume data, many companies and government
institutions put most of the data over the internet (soft
data). This paper uses data obtained from the
Tanzania National Bureau of Statistics, World Bank,
and Statista. (Tanzania Tourism Sector - February
2023 Update, n.d.), (Tanzania: Number of Tourist
Arrivals 2015-2022 | Statista, n.d.). The annual data
of tourist arrivals from 1961 to 2022 is obtained from
the mentioned websites.
After acquiring the data, the cleaning of the data
phase follows. Here understanding what kind of data
is needed in our model is required. Cleaning and data
processing involve putting the data in the required
form, ensuring no missing or filling up of the missing
data, and so on. Thereafter data are categorized into
training data and testing data. Training data in this
study case are the tourist arrival in Tanzania from
1961 – 2012 and the validation data is for ten years
from 2013 -2022.
3.3 Convolutional Neural Network
Convolution Neural Network is a deep neural
network that has been very famous in image
classification, and image search among others in the
same line. Because of that, it has been very useful in
health centers, especially in cancer detection and MRI
scanners. Nerve the less in recent years it has been
involved in time series prediction.
CNN structure has two sections, the first being the
convolutional and pooling parts and the second party
is fully connected layers. The first section,
convolutional and pooling consists of an input layer
and convolutional kernels. ‘The pooling part does a
reduction of the dimension and puts them into a single
neuron. The convolutional layers perform
convolution operations on the time series of the
preceding layer with convolution filters” (Luo et al.,
2019). The fully connected layer is simply one neuron
in one layer that has a connection to another neuron
in another layer. It is simple MLP. The fully
connected layer is connected to the output layer.
Figure 1 explains the structure of CNN. In CNN the
number of training weights is small causing a more
efficient model and expecting more accurate and
reliable results.
Figure 1Simple Architecture of CNN Model (Gu et al.,
2019)
3.4 Long Short Time Memory
It is an updated recurrent neural network that has the
capability of learning order dependence in a time
series sequence. This means LSTM is a modified
RNN that has been explicitly designed to avoid the
long-term dependency problem, which is the main
issue in RNN models. The LSTM was first discovered
by Hochreiter and Schmidhuber to address the issue
of long-term relief (Hochreiter & Schmidhuber,
1997)
Application of Deep Learning in Tourist
251

LSTM uses artificial neural networks. The
networks have connections to each other as data can
be transferred backward and forward. These neural
networks are also known as RNN (Recurrent Neural
Network). The structure of the LSTM is comprised of
four main sections in a single unit of LSTM
architecture. These four components are a cell, an
input gate, an output gate, and a forget gate. Three
gates control the flow of information into and out of
the cell, and the cell keeps track of values over an
arbitrary period as described in Figure 2.
Figure 2 Simple Block of LSTM (Makala & Li, 2019)
Forget gate: As the name expresses itself, the
forget gate is in control of determining which data
from the previous state is eliminated or kept. This
allows the LSTM to have the ability to keep the long-
term dependencies. This means forget gate assists in
choosing which past information is still important for
the prediction and which ones are not important. The
data from the previous state meets the current input
and are both processed through the sigmoid function
where the output is based on 1 or 0 values. For that
case when output is zero (0), that means the LSTM
forgets that information while the 1 value is kept.
Mathematically the work at Forget gate can be
expressed as in an equation 1 given that ht-1 is the
information from the previous cell and xt is the
current input.
𝑓
= 𝜎(𝑤
ℎ
, 𝑥
+ 𝑏
)
(1)
Input gate: One of the gates in the LSTM block
is the input gate. It does deal with determining which
information is to be added to the cell at a particular
time. The input gate has a layer that uses a function
known as sigmoid, whereby the sigmoid function
generates values between 0 and 1 and these values are
the ones that act as gate and control the information
passing through. Therefore, the main function at the
input gate includes controlling the information
entering the cell state, by filtering the important
information to pass through and discarding the
irrelevant information. In addition to that, there is
tanh function which creates a vector of new input that
could be added to the cell. More to that, the input gate
can handle long-term dependence. Now let the
information from the previous state be denoted by
ℎ𝑡−1 and current input 𝑥𝑡. The general equation at the
input gate will be as:
𝑖
= 𝜎(𝑤
ℎ
, 𝑥
+ 𝑏
)
(2
)
Memory Cell: it comprises the CEC, having a
recurrent edge with unit weight. The current cell state
is computed by forgetting irrelevant information (if
any) from the previous time step and accepting
relevant information (if any) from the current input.
Equation here are
𝑐
̅
= 𝑡𝑎𝑛ℎ(𝑤
ℎ
, 𝑥
+ 𝑏
)
(3
)
𝑐
=
𝑓
∗𝑐
+ 𝑖
∗𝑐
̅
(4
)
Output gate. This is the last part of the block. As
its name is the output gate is where the decision to
give output or to re-enter again of information is
conducted. It controls what information would flow
out of the LSTM unit as the output of LSTM. At this
gate, the main function is regulating the information
that has been processed in hidden layers and becomes
the out of the LSTM unit. Also, this gate enables the
LSTM unit to learn the complexity of the pattern and
hence improve the performance. In a similar manner
as in forget get, the input from the past cell is
combined with the current input and they pass
through the sigmoid function to generate the value
between o and 1 and then are multiplied by the tanh
function. These two functions can be expressed
mathematically as shown in equation 5 and 6
respectively.
𝑜
= 𝜎(𝑤
ℎ
, 𝑥
+ 𝑏
)
(5
)
And the
ℎ
= 𝑜
∗tanh
(
𝑐
)
(6
)
Whereby:
𝑖𝑡 indicates the input gate, 𝑓𝑡shows forget gate, 𝑜𝑡
is the output gate, 𝜎 is the sigmoid function, 𝑤𝑥
indicates weight at respective gates, ℎ𝑡−1 shows the
input from the previous LSTM block, 𝑥𝑡 shows
current input and 𝑏𝑜 indicate biases at respective
gates.
Generally, LSTM does have to do very well in
many aspects because of the function it has in each
gate. These gates allow better control of information.
More of that it consists of memory cell which enables
the storage of information. LSTM should be able to
IC3Com 2024 - International Conference on Cognitive & Cloud Computing
252
handle the long-term dependency. It has done well in
natural language processing, image classification,
and time-series forecasting
3.5 ARIMA
Autoregressive Integrated Moving Average is also
known as ARIMA by most people. It is one of the old
and common models in forecasting and prediction
analysis. This model was first introduced by G. Box
and Gwilym in the 1970s (Liu et al., 2011; Sato,
2013). ARIMA's name comes from the combination
of the three models. AR is simply an autoregression
method, I stands for integrated and MA is the Moving
average method. This means It combines three
important components: autoregression, differencing,
and MA to capture the trends and patterns in the data.
The mode generally advancements the version of the
autoregressive moving average (ARMA). It is most
denoted as ARIMA (p, d, q), whereby P is lag order,
which is simply the number of lag observations
included in the model, and d is the degree of
difference which is the number of times that the raw
observations are differenced, and q is the order of
moving average some time known as the size of the
moving average window.
These parameters (p,d,q) can change the model
when is obtained. The parameter value of zero (0),
indicates that that parameter has no use in the
equation and the model. This way, the ARIMA model
can be developed to perform the function of an
ARMA model, or even simple AR, I, or MA models.
Consider an example the value of is (p,0,0) then
ARIMA becomes equal to AR(p) since d and q have
no meaning and values p, d, and q can never be
negative.
In ARIMA the predicting equation is constructed
as follows. First, let y denote the d
th
difference of Y,
which means:
If d = 0; then 𝑦𝑡 = Y𝑡
(7)
If d = 1: 𝑦𝑡 = Y𝑡 - Yt-1
(8)
If d = 2: y𝑡 = (𝑌𝑡 - Yt-1) - (𝑌𝑡-1 - Yt-2)
(9)
=𝑌𝑡 - 2Yt-1 + Yt-2
(10)
According to (ARIMA Model - Complete Guide to
Time Series Forecasting in Python | ML+, n.d.) the
mathematical presented can be put in words and be
Predicted
Yt = Constant + Linear combination Lags of Y +
Linear Combination of Lagged forecast errors (up to
q lags).
Therefore in ARIMA, it is very important to find
the value of parameters p,d,q. The value of p can be
found by looking at the value of PACF. This is a
Partial Autocorrelation plot. PACF is a correlation
relationship between the series and its lag. The Value
of d can be calculated by looking at several
differencing conducted. The aim of doing
differencing is to make time series data at the
stationary level. If the data given are at stationery that
means d =0. The stationarity of data can be calculated
by the Augmented Dickey-Fuller test.
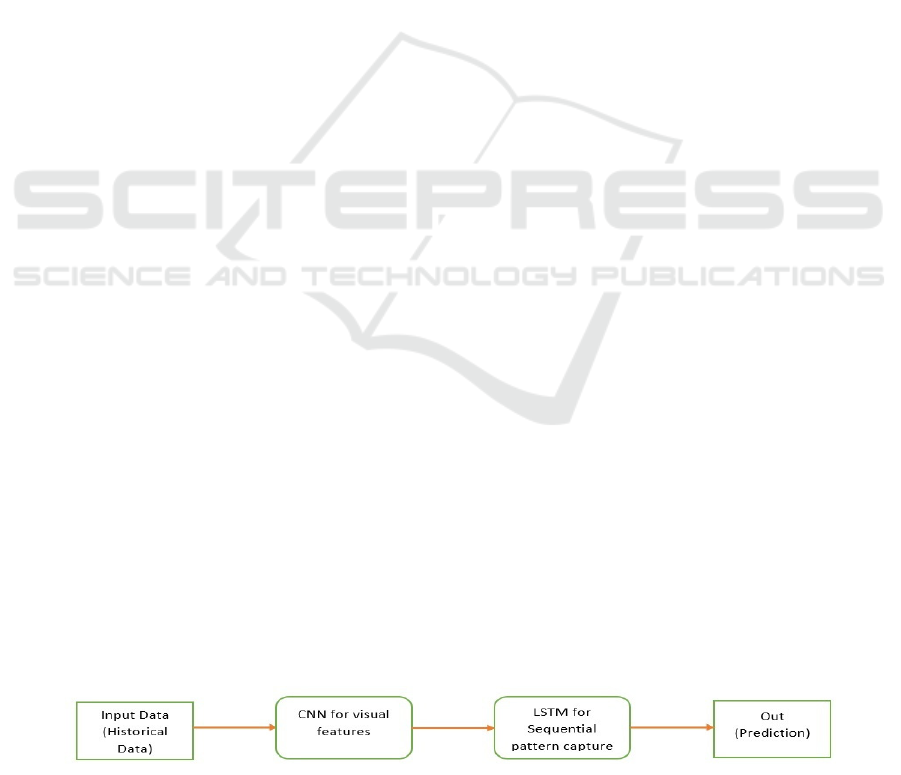
3.6 CNN-LSTM
As the name referred to CNN-LSTM, it is the hybrid
of the two models of neural convolution network and
the LSTM (long short time memory). CNN-LSTM
was created for the focus on the time series
forecasting issues and to generate text descriptions
from sequences of images and videos, but can also
accommodate the times series prediction.
This hybrid method is a combination of the CNN
model and LSTM. In this model, first, the input data
passes through the Convolution layers in CNN to
produce the vectors, which are then passed through
the LSTM layers to produce output. The aim of
choosing this methodology is to capture all necessary
information from CNN and LSTM in case one model
is missed. Figure 3 explains the pictorial presentation
of the flow of data of the model hybrid CNN-LSTM.
Thus In this model, the CNN part will also be
involved in interpreting the sequence of input data
while LSTM will be put together for the forecasting
process.
3.7 Performance Evaluation
It is very important to determine how the models have
performed and compare them to each other. These
performance measurements tell us how best the
model is doing and based on these results, decision-
Figure 3 Showing simple flow of data in CNN-LSTM
Application of Deep Learning in Tourist
253

makers can decide on the different factors to look at
when computing the outcome of the deep learning
model. For this research work, accuracy was the main
factor. Here we consider three main measurement toll
that are:
RMSE: This is Root Means Square Error, that
simply the square root of the square of different actual
values and predicted values it is one of the popular
metrics in prediction analysis. RMSE gives the results
in the same SI unit as the data used in prediction. For
example, in the forecasting of the price of oil, the
RMSE result will be in the same price unit.
Mathematically:
𝑅𝑀𝑆𝐸 =
∑
(𝑝𝑟𝑒𝑑𝑖𝑐𝑡−
𝐴
𝑐𝑡𝑢𝑎𝑙)
𝑁
(11)
MAE: This Means Absolute Error is the metric
used to measure how much big an error occurred in
the forecasting model. Similar to RMSE the results of
the MAE are also in the same unit with the value used
in the forecasting model.
𝑀𝐴𝐸 =
1
𝑛
|
𝑃𝑟𝑒𝑑𝑖𝑐𝑡𝑖𝑜𝑛−
𝐴
𝑐𝑡𝑢𝑎𝑙
|
(12)
R-squares (R2) is sometimes referred to as the
coefficient of determination. It is mostly used in a
regression model which determines the
proportionality of variance in the dependent variable
that explains the independent variable. Mostly
presented as a percentage value. [46] The higher the
value the better performance.
𝑅−𝑆𝑞𝑢𝑎𝑟𝑒𝑑= = 1 −
𝑆𝑆
𝑆𝑆
(13)
𝑆𝑆
= sum of squares due to regression, and
𝑆𝑆
The total sum of sq.
4 RESULTS AND DISCUSSION
Before running into the training, the data has to be
divided into the training set and evaluation set. Then
proposed model is trained with the training in order
to learn the movement and trend of the given data.
with tunning at different parameters of the model
such as different epochs, and the number of layers,
the model with epochs of 500 and the 1 convolutional
layer of 256 filters provides better results. The
outcome of this research article shows that the CNN
performed better compared to all other models,
however, the hybrid model of CNN-LSTM is also
better. Looking at the evaluation tools, the less the
value of the RMSE indicates the better performance
of the model. CNN model has approximately 0.1
RMSE which can also explain how perfect the model
is with R-square, whereas CNN has 99% as shown in
Fig 4. Figure 4 shows how results of each model vs
the true value. Looking CNN, and True values are
very closely followed by the hybrid model of CNN-
LSTM
This study expected all of the deep learning to
perform better, unfortunately, LSTM did poorly. The
main reason of poorly performance of LSTM is
caused by having fewer datasets which are annual
data. Since the CNN did well followed by the CNN-
LSTM, with having r-square of 0.99 and 0.98
respectively, the see pictorial for how they relate with
the actual value as shown in Figure 4. If you look over
you will observe in both cases the predictions are
almost similar to the actual value, however, by
looking at the evaluation matrix tools R-Square,
RMSE, and Means Absolute Error the CNN did better
as indicated in Table 1.
Table 1: Shows the performance of the models.
RMSE MAE R-Square
d
149113.89 133688.35 0.83
ARIMA 408036.81 257622.42 0.26
LSTM 464294.04 389014.22 0.22
CNN 0.09 0.04 0.99
CNN-LSTM 1389 1052.74 0.98
IC3Com 2024 - International Conference on Cognitive & Cloud Computing
254
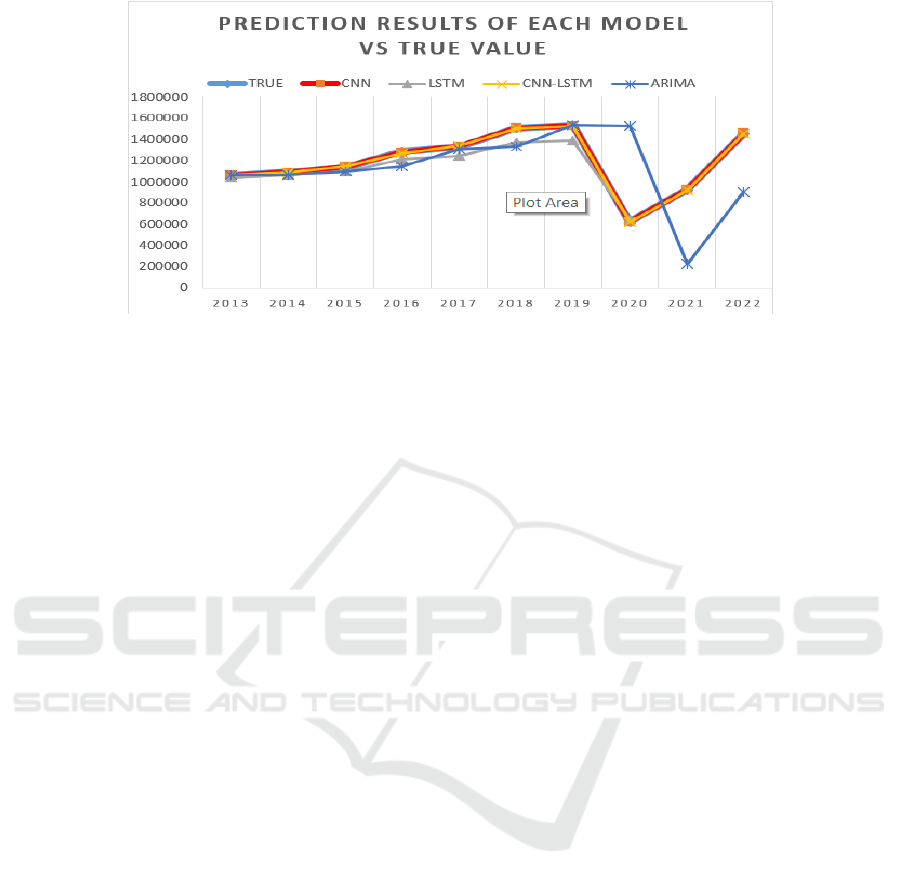
Figure 4 Shows how each model has performed with compared with the true value
5 CONCLUSIONS
CNN has performed well compared to other models.
This shows that the deep learning model has more
chance of doing better compared to other models
regardless of the limited dataset used in this study.
Deep learning is the current and future technology
since it has already done wonders in self car driven,
speech recognition, as well as image classification.
The deep learning techniques have the potential to
revolutionize the tourism industries across the world
by providing accurate information and hence the DL
will provide efficient solutions for the market as well
as the service provided in the tourism industries. By
having the proper framework and designing of the
model that can accurately predict customer behaviors
and be able to capture the trend of income tourists, the
Tanzania tourism sector may have the greater benefit
from the increase of revenue as well as improving the
customer service to the tourist. More to that Deep
learning technology can be used in improving safety
levels, within public places through facial recognition
logarithms, whereby it helps officials and authorities
to keep the cities safe. Also helps against terrorism
and hence attracts more tourists.
Nevertheless, the Tanzania government has to
overcome and address all the challenges associated
with technology adaptation. These challenges include
a lack of skilled personnel, technological
infrastructure, as well as cyber security. This study
believes the Tanzania Government will soon be able
to utilize deep learning technology solutions to
improve the tourism sector.
In conclusion, this study paper has shown a
meaningful input and influence on the tourism sector
by forecasting the arrival of tourism in Tanzania. The
dataset of tourist arrivals in Tanzania represents all
the countries as Tanzania has been used as a place of
where the research has been conducted. This study
intended to fill the gaps that arise with other models,
especially the traditional ones. However, there are
some limitations to this research such as the
availability of data, thus giving out opportunities for
improvements. We further welcome more research to
dig more into the application of the Convolutional
Neural Network model in the prediction of times
series including tourist arrivals.
DECLARATION
The authors of this work declare that they have no
known kind of interest that influences this work paper
ACKNOWLEDGMENTS
The authors of this work would like to acknowledge
the support received during this work from the Deep
Learning group at China University of Petroleum,
Qingdao.
REFERENCES
ARIMA Model - Complete Guide to Time Series
Forecasting in Python | ML+. (n.d.). Retrieved August
15, 2023, from
https://www.machinelearningplus.com/time-
series/arima-model-time-series-forecasting-python/
Astuti, S. W., -, J., & Fahrudin, R. (2018). Forecasting
Tourist Visits Using Seasonal Autoregressive
Integrated Moving Average Method. IOP Conference
Series: Materials Science and Engineering, 407(1),
Application of Deep Learning in Tourist
255

012148. https://doi.org/10.1088/1757-
899X/407/1/012148
Bumthang, in. (2018). ARIMA model to forecast
international tourist visit. J. Phys.: Conf. Ser, 1039,
12023. https://doi.org/10.1088/1742-
6596/1039/1/012023
Chang, Y. W., & Tsai, C. Y. (2017). Apply deep learning
neural network to forecast number of tourists.
Proceedings - 31st IEEE International Conference on
Advanced Information Networking and Applications
Workshops, WAINA 2017, 259–264.
https://doi.org/10.1109/WAINA.2017.125
Choy, D. J. L. (1984). Forecasting tourism revisited.
Tourism Management, 5(3), 171–176.
https://doi.org/10.1016/0261-5177(84)90036-0
Essien, A., & Chukwukelu, G. (2022). Deep learning in
hospitality and tourism: a research framework agenda
for future research. International Journal of
Contemporary Hospitality Management, 34(12), 4480–
4515. https://doi.org/10.1108/IJCHM-09-2021-
1176/FULL/XML
Goh, C., Law, R., & Mok, H. M. K. (2008). Analyzing and
Forecasting Tourism Demand: A Rough Sets
Approach. Journal of Travel Research, 46(3), 327–338.
https://doi.org/10.1177/0047287506304047
Gu, H., Wang, Y., Hong, S., & Gui, G. (2019). Blind
channel identification aided generalized automatic
modulation recognition based on deep learning. IEEE
Access, 7, 110722–110729.
https://doi.org/10.1109/ACCESS.2019.2934354
Henseler, M., Maisonnave, H., & Maskaeva, A. (2022).
Economic impacts of COVID-19 on the tourism sector
in Tanzania. Annals of Tourism Research Empirical
Insights, 3(1), 100042.
https://doi.org/10.1016/J.ANNALE.2022.100042
Huang, J. H., & Min, J. C. H. (2002). Earthquake
devastation and recovery in tourism: the Taiwan case.
Tourism Management, 23(2), 145–154.
https://doi.org/10.1016/S0261-5177(01)00051-6
Kontogianni, A., Alepis, E., & Patsakis, C. (2022).
Promoting smart tourism personalised services via a
combination of deep learning techniques. Expert
Systems with Applications, 187, 115964.
https://doi.org/10.1016/J.ESWA.2021.115964
Kyara, V. C., Rahman, M. M., & Khanam, R. (2022).
Investigating the environmental externalities of tourism
development: evidence from Tanzania. Heliyon, 8(6),
e09617.
https://doi.org/10.1016/J.HELIYON.2022.E09617
Li, M., Zhang, C., Sun, S., & Wang, S. (2023). A novel deep
learning approach for tourism volume forecasting with
tourist search data. International Journal of Tourism
Research, 25(2), 183–197.
https://doi.org/10.1002/JTR.2558
Li, Y., & Cao, H. (2018). Prediction for Tourism Flow
based on LSTM Neural Network. Procedia Computer
Science, 129, 277–283.
https://doi.org/10.1016/J.PROCS.2018.03.076
Liu, Q., Liu, X., Jiang, B., & Yang, W. (2011). Forecasting
incidence of hemorrhagic fever with renal syndrome in
China using ARIMA model. BMC Infectious Diseases,
11, 218. https://doi.org/10.1186/1471-2334-11-218
Luo, Z., Cai, X., Tanaka, K., Takiguchi, T., Kinkyo, T., &
Hamori, S. (2019). Can We Forecast Daily Oil Futures
Prices? Experimental Evidence from Convolutional
Neural Networks. Journal of Risk and Financial
Management, 12(1), 9.
https://doi.org/10.3390/jrfm12010009
Makala, D., & Li, Z. (2019). ECONOMIC
FORECASTING WITH DEEP LEARNING: CRUDE
OIL. MATTER: International Journal of Science and
Technology, 5(2), 213–228.
https://doi.org/10.20319/mijst.2019.52.213228
Petrevska, B. (2017). Predicting tourism demand by
A.R.I.M.A. models. Economic Research-Ekonomska
Istraživanja, 30(1), 939–950.
https://doi.org/10.1080/1331677X.2017.1314822
Sato, R. C. (2013). Disease management with ARIMA
model in time series. Einstein, 11(1), 128.
https://doi.org/10.1590/S1679-45082013000100024
Tanzania: number of tourist arrivals 2015-2022 | Statista.
(n.d.). Retrieved July 29, 2023, from
https://www.statista.com/statistics/1248890/tourist-
arrivals-in-tanzania/
Tanzania Tourism Sector - February 2023 Update. (n.d.).
Retrieved July 26, 2023, from
https://www.tanzaniainvest.com/tourism
Vector Autoregression (VAR) - Comprehensive Guide with
Examples in Python - Machine Learning Plus. (n.d.).
Retrieved July 27, 2023, from
https://www.machinelearningplus.com/time-
series/vector-autoregression-examples-python/
Wamboye, E. F., Nyaronga, P. J., & Sergi, B. S. (2020).
What are the determinants of international tourism in
Tanzania? World Development Perspectives, 17,
100175. https://doi.org/10.1016/J.WDP.2020.100175
What is Artificial Intelligence (AI) ? | IBM. (n.d.). Retrieved
July 27, 2023, from
https://www.ibm.com/topics/artificial-intelligence
Witt, S. F., & Witt, C. A. (1995). Forecasting tourism
demand: A review of empirical research. International
Journal of Forecasting, 11(3), 447–475.
https://doi.org/10.1016/0169-2070(95)00591-7
Wong, K. K. F., Song, H., & Chon, K. S. (2006). Bayesian
models for tourism demand forecasting. Tourism
Management, 27(5), 773–780.
https://doi.org/10.1016/J.TOURMAN.2005.05.017
Wu, D. C. W., Ji, L., He, K., & Tso, K. F. G. (2020).
Forecasting Tourist Daily Arrivals With A Hybrid
Sarima–Lstm Approach.
Https://Doi.Org/10.1177/1096348020934046, 45(1),
52–67. https://doi.org/10.1177/1096348020934046
Yue, Y., Wei, M., & Yuan, S. (2017). Forecast related to
linear regression of China’s tourism market. Journal of
Interdisciplinary Mathematics, 20(6–7), 1367–1371.
https://doi.org/10.1080/09720502.2017.1386472
IC3Com 2024 - International Conference on Cognitive & Cloud Computing
256
