
A Novel Cuff-Less and Calibration-Free Blood Pressure Estimation
Framework Using Single Photoplethysmogram
Yusuf Ziya Hayirlioglu and Beren Semiz
a
Department of Electrical and Electronics Engineering, Koc¸ University, Istanbul, Turkey
Keywords:
Blood Pressure, Photoplethysmogram, Deep Learning, Continuous Monitoring.
Abstract:
Blood pressure (BP) is one of the four main vital signs and is a key indicator of cardiovascular health. However,
monitoring of BP is not regularly done in most of the population until health problems arise. Continuous
and convenient monitoring of blood pressure is thus needed to address this issue. We propose a novel BP
estimation algorithm without calibration to estimate BP from a cuff-less photoplethysmogram (PPG) system.
Data from a total of 219 subjects, which underwent only simple preprocessing steps, was used to train and
evaluate a hybrid Convolutional Long Short-Term Memory Neural Network (CNN-LSTM) model. The model
was trained using the preprocessed PPG signal as the only input. The model had two neurons in the last
layer to output systolic blood pressure (SBP) and diastolic blood pressure (DBP) values. The model was
optimized by conducting a random search on its hyperparameters for better performance. The model resulted
in a comparable performance to those in the literature, with mean absolute errors (MAEs) of 14.13 mmHg
and 8.80 mmHg for SBP and DBP, respectively. To assess generalizability, we also tested the trained model
on a second dataset collected from 20 subjects using a custom wearable system, which was again resulted
in MAEs of 10.71 mmHg and 10.09 mmHg, respectively. Overall, our results show that such a pipeline
could potentially be leveraged in the design of wearable systems to achieve cuff-less and calibration-free BP
monitoring in ambulatory settings.
1 INTRODUCTION
Blood pressure (BP) is one of the four main vital
signs along with pulse rate, respiration rate, and tem-
perature, serving as a critical parameter in assess-
ing cardiovascular health (Sapra et al., 2020). Accu-
rate evaluation of BP levels contributes substantially
to the early detection and management of hyperten-
sion. Hypertension is a major cause of premature
death around the world and is a major risk factor for
conditions and diseases such as stroke, heart failure,
and kidney disease. Only 42% of adults with hyper-
tension are properly diagnosed and treated (Lackland
and Weber, 2015). Continuous blood pressure mon-
itoring systems hold the potential to facilitate timely
disease detection and intervention, facilitate the for-
mulation of individualized therapeutic regimens, and
afford proactive and preemptive healthcare strategies
for individuals susceptible to ailments resulting from
abnormal blood pressure (Sana et al., 2020).
BP monitoring methods can be classified into two
groups: non-invasive and invasive. The gold standard
a
https://orcid.org/0000-0002-7544-5974
for non-invasive blood pressure monitoring involves
using the auscultatory technique (Korotkoff sounds)
through oscillometric sphygmomanometers and cuffs
(MHRA, 2019). This method provides accurate but
intermittent readings of BP (Mukherjee et al., 2018).
Invasive methods require the cannulation of an artery
with a stiff catheter to insert a transducer for BP
measurement. This method provides continuous and
significantly accurate BP readings; however, it is
not preferred unless necessary due to potential harm
and high levels of discomfort to the patient. Other
BP measurement methods include ultrasound sens-
ing, volume clamping, tactile sensing, pulse tran-
sit time (PTT)-based measurement, and photophle-
tysmography (PPG)-based measurement (Mukherjee
et al., 2018).
Among all the methods, PPG-based BP measure-
ment is the most promising method for daily, contin-
uous BP monitoring due to its low cost, accessibility,
unobtrusive nature, and easy integration into wearable
devices such as smartwatches. The PPG signal is a re-
sult of the variance in the amount of light absorbed in
the arteries due to the changes in arterial blood vol-
Hayirlioglu, Y. Z. and Semiz, B.
A Novel Cuff-Less and Calibration-Free Blood Pressure Estimation Framework Using Single Photoplethysmogram.
DOI: 10.5220/0013055600003911
Paper published under CC license (CC BY-NC-ND 4.0)
In Proceedings of the 18th International Joint Conference on Biomedical Engineering Systems and Technologies (BIOSTEC 2025) - Volume 1, pages 697-703
ISBN: 978-989-758-731-3; ISSN: 2184-4305
Proceedings Copyright © 2025 by SCITEPRESS – Science and Technology Publications, Lda.
697

ume during the cardiac cycle. Its working principle is
based on optical detection, consisting of a light source
and a photosensor. Depending on the working mode
of the photosensor, a PPG signal is generated by mea-
suring either the reflected or transmitted light from the
relevant region. In the literature, PPG signals have
been analyzed to provide crucial information regard-
ing vascular resistance, blood oxygen level, and blood
pressure (cheol Jeong et al., 2018).
Studies involving PPG developed different tech-
niques to analyze the signal to estimate blood pres-
sure. Pulse arrival time (PAT)- and PTT-based blood
pressure calculations are among the most common
methods to estimate the blood pressure from PPG
signals since there is an established relationship be-
tween the two (Kim et al., 2015). Other commonly
used techniques involve extracting several frequency
and time domain features and using machine learn-
ing algorithms to estimate the blood pressure (Maq-
sood et al., 2021). Most work in the domain also re-
quires personal calibration over short time intervals,
which would necessitate access to information about
the subject beforehand, which might not always be
available (Elgendi et al., 2019). For PAT- and PTT-
based estimation methods, the requirement to use two
synchronized sensors to accurately measure these fea-
tures is their biggest disadvantage. For methods that
involve manual feature extraction, a careful and time-
consuming analysis of the signals is required. Ad-
ditionally, it is difficult to standardize the steps in
feature extraction procedures. On the other hand,
deep learning-based methods can have feature ex-
traction capabilities embedded in their architecture.
They are supposed to generalize over the dataset they
are trained on, but training them requires a substan-
tial amount of data. The availability of numerous
databases with PPG and BP measurements trivializes
this problem.
Considering the points above, we propose a deep
learning-based regression model for BP estimation
using a single PPG measurement. Although methods
to estimate or measure BP from certain physiological
markers exist, a vast majority of them require mul-
tiple sensor modalities, bulky and inconvenient mea-
surement devices, or exhaustive signal analysis. This
work aims to develop a novel, robust, and convenient
estimation of BP from a single PPG signal without the
use of a cuff or any kind of personal calibration proce-
dure. Our main contributions are that we demonstrate
a novel approach to BP estimation, utilizing a Convo-
lutional Long Short-Term Memory Neural Network
(CNN-LSTM) hybrid architecture to estimate BP di-
rectly from filtered PPG signals with no personal cal-
ibration procedure. The proposed model is also suffi-
ciently lightweight and can easily be trained on com-
mercial PCs with a GPU.
This paper is organized as follows: The dataset,
the general structure of the preprocessing steps, and
selection and evaluation methods of our proposed al-
gorithm are described in Section 2. Section 3 presents
a comparative evaluation of our algorithm’s perfor-
mance. Concluding remarks have been presented in
Section 4.
2 METHODS
2.1 Dataset
This study primarily uses the PPG-BP dataset pub-
lished by Liang et al. (Liang et al., 2022) for training
and validation. The dataset consists of 657 recordings
from 219 subjects. Each subject first had their arte-
rial blood pressure measured using the Omron HEM-
7201 (Omron Company, Kyoto, Japan) followed by
three, 2.1-second-long PPG recordings in the span of
three minutes. The PPG recording quality was eval-
uated by the authors of the dataset using a skewness
signal quality index.
2.2 Preprocessing
The raw PPG values from the dataset had high fre-
quency noise contaminating the signal. Low fre-
quency baseline wander was also present in the
recordings. Therefore, we conducted a filtering op-
eration before using the dataset to train our BP esti-
mation algorithm. A 4th order Butterworth filter was
used with cut-offs at 0.4 Hz and 20 Hz. The resulting
clean signal is shown in Figure 1. In the literature, it
has been shown that the PPG signal can be adequately
analyzed within these frequency ranges (Reali et al.,
2022).
Also, deep learning algorithms greatly benefit
from normalization. We normalized the data to limit
the scale and reduce the variance according to the
equation below, where µ is the mean and σ is the stan-
dard deviation (Equation 1).
x
normalized
=
x − µ
σ
(1)
2.3 Machine Learning Algorithms
1. CNNs and their application over 1D data is not
an unexplored topic. However, due to the pop-
ularity and success of 2D CNNs, conventionally,
1D data is transformed into 2D graphs (such as
BIOSIGNALS 2025 - 18th International Conference on Bio-inspired Systems and Signal Processing
698
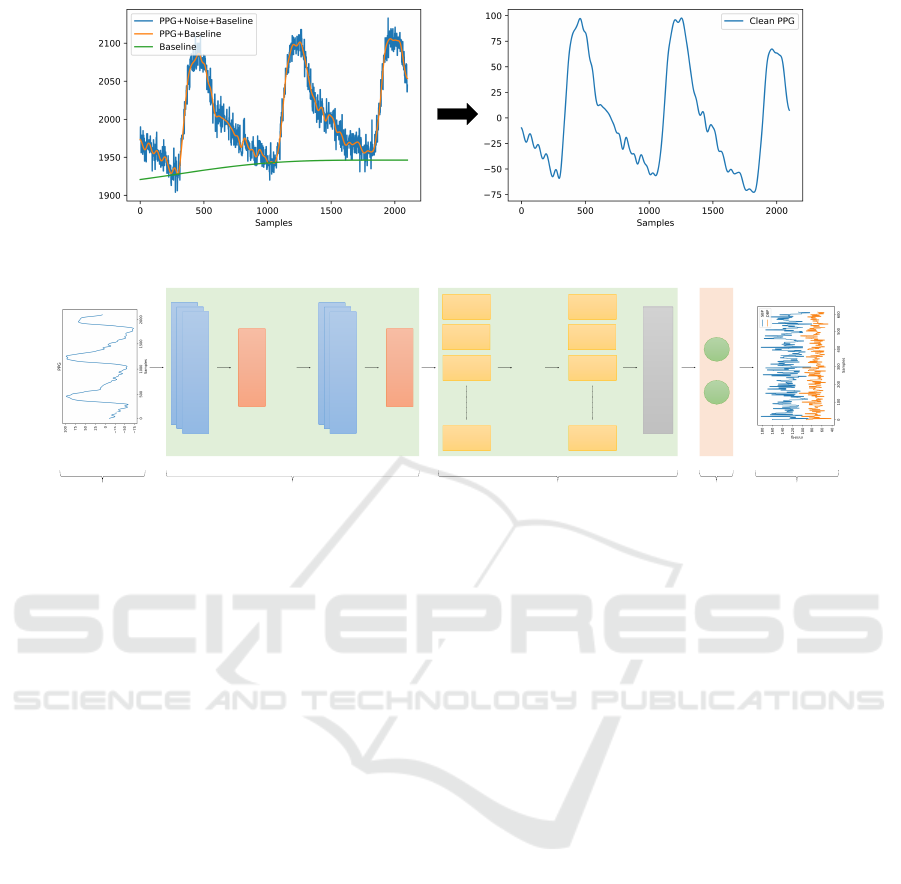
Figure 1: PPG signal after preprocessing.
.…
LSTM
.…
LSTM
LSTM
LSTM
LSTM
LSTM
LSTM
LSTM
1D CNN
Max
Pooling
1D CNN
Max
Pooling
Flatten
Input Convolutional Layers
LSTM Layers
Dense
Layer
Output
Figure 2: General Structure of the Model.
spectrograms) for analysis. Recently, the use of
1D CNNs for 1D data has become more com-
mon in the literature. This is in part due to 1D
CNNs requiring less computational complexity
and memory, making them a suitable candidate to
use for lightweight, real-time applications with-
out requiring specialized hardware. They are also
easier to train than 2D CNNs, often requiring a
smaller dataset. They have been used in time-
series data analysis such as speech recognition,
ECG monitoring, and stock value forecasting (Ki-
ranyaz et al., 2021).
2. LSTMs are proposed as a solution to the explod-
ing/vanishing gradient problem of Recurrent Neu-
ral Networks (RNNs). Its ability to remember
longer dependencies is a result of its recurrently
connected memory blocks that regulate the flow
of information via non-linear gating units. For this
reason, it’s a popular choice for handling time se-
ries data (Van Houdt et al., 2020).
3. CNN-LSTM hybrid models take advantage of
both architectures. CNNs provide LSTMs with
extracted features with a reduced dimensional-
ity that adequately represents the input, while
LSTMs capture temporal dependencies over long
sequences. The hybrid architecture consistently
outperformed conventional unmixed CNN and
LSTM architectures (Van Houdt et al., 2020). In
the literature, the hybrid model has been used for
classification of plant growth status (Xing et al.,
2023), forecasting of photovoltaic power produc-
tion, emotion identification, etc. (Van Houdt et al.,
2020; Agga et al., 2022). Bao et al. have success-
fully demonstrated that a hybrid model can suc-
cessfully estimate wrist angles from electromyo-
gram (EMG) signals (Bao et al., 2020). They
compared their hybrid model with support vec-
tor regression (SVR), Random Forest, CNNs, and
LSTMs. Their hybrid model outperformed all
other models in all trials and protocols.
We propose a CNN-LSTM hybrid network to
solve the BP estimation problem. LSTMs and CNNs
are highly popular deep learning techniques and have
a variety of use cases ranging from natural language
processing to image processing. LSTMs’ ability
to capture dependencies in long temporal sequences
makes them a good match for time series estimation
applications. CNNs can extract learned features from
the raw data. In theory, a hybrid model consisting of
both should be able to extract the local features of a
signal and capture the long-term dependencies.
2.4 Hyperparameter Selection
The general structure of the model is presented in Fig-
ure 2. To tune the hyperparameters for our model, we
conducted a random search on the hyperparameters in
Table 1, training 100 different models over 30 epochs
A Novel Cuff-Less and Calibration-Free Blood Pressure Estimation Framework Using Single Photoplethysmogram
699

Table 1: List of selectable hyperparameters.
Hyperparameters Hyperparameter Values
1D CNN Layers 1, 3
1D CNN Filters 16, 32, 64
1D CNN Kernel Sizes 5, 15, 63
Lstm Layers 1, 3, 5
Lstm Units 32, 64, 128
Dense Layers 0, 1, 3
Dense Units 16, 64, 128
Table 2: Hyperparameter selection results.
Hyperparameters Hyperparameter Values
1D CNN Layers 3
1D CNN Filters
Layer 1: 16
Layer 2: 32
Layer 3: 64
1D CNN Kernel Sizes
Layer 1: 63
Layer 2: 15
Layer 3: 15
Lstm Layers 5
Lstm Units
Layer 1: 128
Layer 2: 128
Layer 3: 32
Layer 4: 64
Layer 5: 128
Dense Layers 0
Dense Units –
on the dataset.
The resulting architecture with the smallest val-
idation root mean square error was selected as the
candidate to be further trained on the dataset. The
random search yielded the parameters in Table 2 for
the model.
We have two neurons as the last layer of our ar-
chitecture to output systolic blood pressure (SBP) and
diastolic blood pressure (DBP) values.
2.5 Model Evaluation
For a more reliable estimation of our model’s perfor-
mance, we used 10-fold cross-validation. The met-
rics used to evaluate the algorithm’s performance are
presented below, where y is the ground truth, x is the
prediction, and n is the number of samples.
1. Mean Absolute Error (MAE): The mean of abso-
lute errors (Equation 2).
MAE =
1
n
n
∑
i=1
|y
i
− x
i
| (2)
2. Root Mean Square Error (RMSE): The standard
deviation of prediction errors. It measures how
spread the residuals are (Equation 3).
RMSE =
s
1
n
n
∑
i=1
(y
i
− x
i
)
2
(3)
3. Mean Absolute Error Percentage (MAPE): The
percentage mean of absolute errors (Equation 4).
MAPE =
1
n
n
∑
i=1
|
y
i
− x
i
y
i
| (4)
We used MSE (square of RMSE) to monitor the
prediction success of the algorithm during training.
2.6 Experiments to Assess
Generalizability
To assess generalizability, we also tested the trained
model on the dataset we collected from 20 subjects
using a custom wearable system. Data collection was
conducted upon approval by the Koc University Insti-
tutional Review Board, and all participants provided
written consent. Subject demographics were as fol-
lows: 8 females and 12 males, Age: 23.8 ± 4.2,
Height: 172.6 ± 9.5 cm, Weight: 70.9 ± 16.1 kg.
Before the experimental protocol, the subjects’
SBP and DBP were measured using Omron M2 de-
vice. Following that, the subjects were asked to stand
still for two minutes while their PPG signals were be-
ing collected from their wrist area using a MAX30102
sensor at 50 Hz. The IR signal was pre-processed in
a similar manner (detailed in Section 2.2) and used as
the test data for the pretrained CNN-LSTM model.
3 RESULTS AND DISCUSSION
In this work, we focused on BP estimation from raw
PPG signals without using handcrafted features. Only
the filtered PPG recording was fed to the CNN-LSTM
hybrid model. Most works in the literature propose a
calibration method to improve their results. Slapniv-
car et al. used 20% of the test subjects to train their
network for personalization (Slapni
ˇ
car et al., 2019).
Their MAE improved as much as 5.98 mmHg and 5.5
mmHg, respectively, for their best-performing algo-
rithm. In another work, Xing et al. compared their
calibration-free algorithm with the same algorithm
with a calibration factor (Xing et al., 2019). Their
calibration factor was the median of a person’s previ-
ous fitting errors. Their calibration factor improved
their estimation results by 2.0±4.1 mmHg for SBP,
2.2±0.5 mmHg for DPB in the young (≤50 yo), and
5.5±4.3 mmHg for SBP, 2.4±2.1 mmHg for DPB in
BIOSIGNALS 2025 - 18th International Conference on Bio-inspired Systems and Signal Processing
700
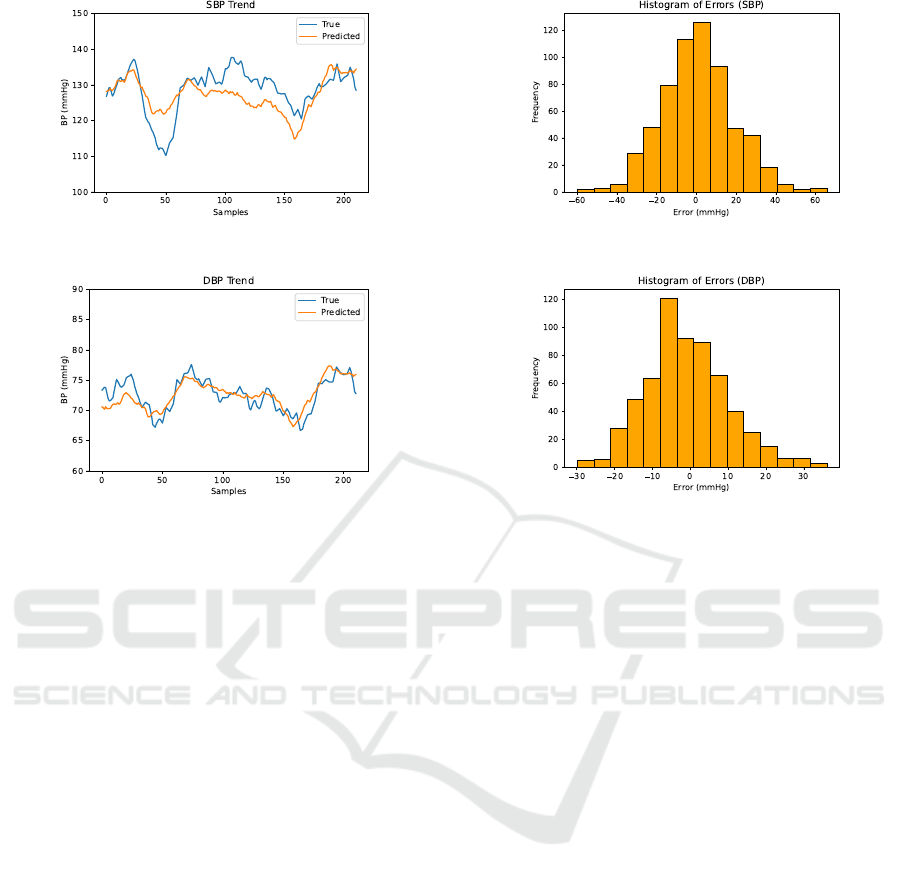
Figure 3: SBP Trend.
Figure 4: DBP Trend.
the old (>50 yo) population. They argue that the cali-
bration process reduced biases. However, we find this
a bit counterintuitive since the population size for the
older population was higher than the younger popu-
lation by 81%. In fact, the estimations should have
been more biased towards the older population when
the calibration-free algorithm was used; however, this
was not the case. Depending on how the calibration
is made, calibrations might introduce even more bi-
ases to compensate for the errors. Considering the
previous point and how personal calibration requires
subject-specific information that might not always be
available, we decided to go with a calibration-free
method in designing our algorithm.
3.1 Model Evaluation Results
We selected two papers using the same dataset as
ours; therefore, the evaluation criteria that would nor-
mally be dependent on data distribution to draw con-
clusions, such as MAE, makes sense. Although most
BP datasets have a similar range, depending on the
subject demographics, the difference in the distribu-
tion of BP can be significant enough to skew con-
clusions drawn from different datasets. Our moti-
vation was to prevent such an occasion from occur-
ring. Table 3 lists some of the best algorithms be-
longing to the two papers that used the same dataset
as ours. Among them, only ours and (Gonz
´
alez et al.,
2023)’s ResNet approach don’t use any feature extrac-
Figure 5: SBP Error Histogram.
Figure 6: DBP Error Histogram.
tion prior to training. Our approach and (Gonz
´
alez
et al., 2023)’s ResNet approach show very similar per-
formances, with ours having better mean errors but
slightly worse standard deviations. The rest of the
machine learning approaches that utilize some kind of
feature extraction method prior to training have better
results in general. This might be due to deep learning-
based approaches requiring a larger dataset to better
understand the relationship between the input and out-
put.
Figures 3 - 4 show trends in four folds of the test
data. The figures show that our algorithm can prop-
erly encapsulate the upward and downward move-
ments in the blood pressure. The data was smoothed
with a moving average filter (n = 30) to make the trend
clearer in the visualization.
Figures 5 - 6 visualize the histograms of resid-
ual errors. The error histograms indicate that the er-
rors are normally distributed around 0. The error his-
togram of SBP has a higher range. This is because
SBP has a higher variance as a result of its larger mag-
nitude in comparison to DBP.
3.2 Experiments to Assess
Generalizability
As detailed in Section 2.6, we also tested the trained
model on the IR PPG signals we collected from 20
subjects. For the SBP measurements, the MAE and
MAPE were calculated to be 10.71 mmHg and 9.45%,
A Novel Cuff-Less and Calibration-Free Blood Pressure Estimation Framework Using Single Photoplethysmogram
701

Table 3: Comparison of model performance.
Model Performance Criteria Systolic BP Diastolic BP
RelieF GPR (w/o opt.)
MAE (mmHg)
RMSE (mmHg)
ME+STD (mmHg)
MAPE (%)
10.08
14.80
-
-
7.87
9.83
-
-
CFS GPR (w/o opt.)
MAE
RMSE
ME+STD
MAPE
11.91
16.05
-
-
7.64
9.16
-
-
RelieF GPR (w opt.)
MAE
RMSE
ME+STD
MAPE
3.02
6.74
-
-
1.74
3.59
-
-
LightBGM
MAE
RMSE
ME+STD
MAPE
13.06
-
0.00±16.95
-
8.16
-
-0.04±10.30
-
AdaBoost
MAE
RMSE
ME+STD
MAPE
13.22
-
-0.56±16.95
-
8.04
-
-0.16±10.25
-
ResNet
MAE
RMSE
ME+STD
MAPE
13.62
-
-1.85±17.45
-
8.61
-
-2.17±10.81
-
Ours
MAE
RMSE
ME+STD
MAPE
14.13
18.13
0.71±18.23
11.24%
8.80
10.96
-0.79±11.08
12.54%
respectively. For the DBP measurements, the MAE
and MAPE were 10.09 mmHg and 12.02%, respec-
tively. Obtaining high performance from a different
test dataset justified that our pipeline was indeed gen-
eralizable regardless of the instrumentation used.
4 CONCLUSION
In this study, we proposed and implemented a
calibration-free BP estimation algorithm and demon-
strated that it is possible to estimate SBP and DBP
from a single PPG without manual feature extrac-
tion. The preprocessing steps to prepare the data for
training were discussed. The general structure of the
proposed CNN-LSTM model and its hyperparame-
ters were described in detail. The performance of
the model was evaluated with the metrics indicated
in Section 2.5 and compared to similar works in the
literature.
Different from the other works, our algorithm
does not rely on multiple sensor modalities, nor does
it rely on personal calibration to estimate the BP. Our
CNN-LSTM hybrid model is also a novel approach
to BP estimation. An advantage of our model is that
it is sufficiently lightweight to run on commercial
old GPUs such as GTX1070. It completes a 10-fold
cross-validation under 10 minutes on the full dataset,
and only takes seconds to predict BP given the data.
Single PPG, cuff-less BP monitoring is cheap, ac-
cessible, and user-friendly. In the near future, it might
be possible to integrate algorithms of this kind into
smartwatches or other wearables. Similar to how a
fingertip pulse oximeter is able to measure blood oxy-
gen levels, devices of the same kind might be able
to provide BP readings. This way, BP-related risk
factors could be detected and serve to prevent or di-
agnose certain conditions and diseases in the general
populace, increasing quality of life.
BIOSIGNALS 2025 - 18th International Conference on Bio-inspired Systems and Signal Processing
702

REFERENCES
Agga, A., Abbou, A., Labbadi, M., El Houm, Y., and Ali,
I. H. O. (2022). Cnn-lstm: An efficient hybrid deep
learning architecture for predicting short-term photo-
voltaic power production. Electric Power Systems Re-
search, 208:107908.
Bao, T., Zaidi, S. A. R., Xie, S., Yang, P., and Zhang, Z.-Q.
(2020). A cnn-lstm hybrid model for wrist kinemat-
ics estimation using surface electromyography. IEEE
Transactions on Instrumentation and Measurement,
70:1–9.
cheol Jeong, I., Bychkov, D., and Searson, P. C. (2018).
Wearable devices for precision medicine and health
state monitoring. IEEE Transactions on Biomedical
Engineering, 66(5):1242–1258.
Elgendi, M., Fletcher, R., Liang, Y., Howard, N., Lovell,
N. H., Abbott, D., Lim, K., and Ward, R. (2019). The
use of photoplethysmography for assessing hyperten-
sion. NPJ digital medicine, 2(1):60.
Gonz
´
alez, S., Hsieh, W.-T., and Chen, T. P.-C. (2023). A
benchmark for machine-learning based non-invasive
blood pressure estimation using photoplethysmogram.
Scientific Data, 10(1):149.
Kim, C.-S., Carek, A. M., Mukkamala, R., Inan, O. T.,
and Hahn, J.-O. (2015). Ballistocardiogram as prox-
imal timing reference for pulse transit time measure-
ment: Potential for cuffless blood pressure monitor-
ing. IEEE Transactions on Biomedical Engineering,
62(11):2657–2664.
Kiranyaz, S., Avci, O., Abdeljaber, O., Ince, T., Gabbouj,
M., and Inman, D. J. (2021). 1d convolutional neu-
ral networks and applications: A survey. Mechanical
systems and signal processing, 151:107398.
Lackland, D. T. and Weber, M. A. (2015). Global burden
of cardiovascular disease and stroke: hypertension at
the core. Canadian Journal of Cardiology, 31(5):569–
571.
Liang, Y., Liu, G., Chen, Z., and Elgendi, M. (2022). PPG-
BP Database.
Maqsood, S., Xu, S., Springer, M., and Mohawesh, R.
(2021). A benchmark study of machine learning for
analysis of signal feature extraction techniques for
blood pressure estimation using photoplethysmogra-
phy (ppg). Ieee Access, 9:138817–138833.
MHRA (2019). Blood pressure measurement devices.
Mukherjee, R., Ghosh, S., Gupta, B., and Chakravarty, T.
(2018). A literature review on current and proposed
technologies of noninvasive blood pressure measure-
ment. Telemedicine and e-Health, 24(3):185–193.
Reali, P., Lolatto, R., Coelli, S., Tartaglia, G., and Bianchi,
A. M. (2022). Information retrieval from photo-
plethysmographic sensors: A comprehensive compar-
ison of practical interpolation and breath-extraction
techniques at different sampling rates. Sensors,
22(4):1428.
Sana, F., Isselbacher, E. M., Singh, J. P., Heist, E. K.,
Pathik, B., and Armoundas, A. A. (2020). Wearable
devices for ambulatory cardiac monitoring: Jacc state-
of-the-art review. Journal of the American College of
Cardiology, 75(13):1582–1592.
Sapra, A., Malik, A., and Bhandari, P. (2020). Vital sign
assessment.
Slapni
ˇ
car, G., Mlakar, N., and Lu
ˇ
strek, M. (2019). Blood
pressure estimation from photoplethysmogram using
a spectro-temporal deep neural network. Sensors,
19(15):3420.
Van Houdt, G., Mosquera, C., and N
´
apoles, G. (2020). A
review on the long short-term memory model. Artifi-
cial Intelligence Review, 53:5929–5955.
Xing, D., Wang, Y., Sun, P., Huang, H., and Lin, E. (2023).
A cnn-lstm-att hybrid model for classification and
evaluation of growth status under drought and heat
stress in chinese fir (cunninghamia lanceolata). Plant
Methods, 19(1):66.
Xing, X., Ma, Z., Zhang, M., Zhou, Y., Dong, W., and Song,
M. (2019). An unobtrusive and calibration-free blood
pressure estimation method using photoplethysmog-
raphy and biometrics. Scientific reports, 9(1):8611.
A Novel Cuff-Less and Calibration-Free Blood Pressure Estimation Framework Using Single Photoplethysmogram
703
