
Unsupervised Partial Domain Adaptation for Occupants Behavior
Modeling in Smart Buildings
Jawher Dridi
a
, Manar Amayri
b
and Nizar Bouguila
c
Concordia Institute for Information Systems Engineering (CIISE),Concordia University, Canada
Keywords:
Activity Recognition, Occupancy Estimation, Smart Buildings, Domain Adaptation, Unsupervised Learning,
Deep Learning, Machine Learning, Sensor Data.
Abstract:
Smart buildings rely on activity recognition (AR) and occupancy estimation (OE) tasks to provide residents
with several services such as optimal energy management, HVAC (Heating, ventilation, and air conditioning)
systems optimization, and security. Estimating the number of occupants and recognizing their activities is
performed using sensor data which is scarce. The collection and labeling of smart building data are tedious,
costly, and time-consuming, pushing researchers to consider solutions based on domain adaptation (DA) to
transfer knowledge from source domains where data is abundant to target domains where data is scarce. In
particular, unsupervised domain adaptation (UDA) has been considered to solve the unavailability of labeled
data in target domains. Previous research has focused on standard UDA methods where label space is identical
between source and target domains which is not the case for real-world datasets. This work considers unsuper-
vised partial domain adaptation (UPDA) methods where target classes are a subset of source classes. We adapt
and evaluate two UPDA techniques called Adversarial Re-weighting for Partial Domain Adaptation (ARPDA)
and Selective Adversarial Networks for Partial Domain Adaptation (SAN w PDA). We have compared their
performance to Adversarial Re-weighting for Standard Domain Adaptation (ARSDA) and Selective Adversar-
ial Networks for Standard Domain Adaptation (SAN w SDA) as well as several previous UDA methods. The
impressive results with scores up to 98% prove the efficiency of the adapted UPDA techniques. We provide
the code in the following repository: https://github.com/JawDri/UPDA-for-OE-and-AR.git.
1 INTRODUCTION
Smart buildings (Kazmi et al., 2017), powered by
the Internet of Things (IoT) and machine learning
(Dridi et al., 2022), offer several advantages for resi-
dents which help enhance life conditions and reduce
bills. 0E and AR are among the most interesting
smart building tasks that can help provide optimal en-
ergy management, HVAC (Heating, ventilation, and
air conditioning) systems optimization, and security
(Dridi et al., 2023a; Dridi et al., 2022; Prabhakaran
et al., 2022; Dridi et al., 2023b). Indeed, estimating
the number of occupants in different areas can be used
to distribute energy optimally across the building and
reduce energy waste in unoccupied places (Zamzami
et al., 2019). HVAC systems can also be optimized
by adjusting heating, ventilation, and air conditioning
based on the number of occupants and their activities
a
https://orcid.org/0000-0001-6062-2897
b
https://orcid.org/0000-0002-5610-8833
c
https://orcid.org/0000-0001-7224-7940
in a particular place (Dridi et al., 2023a). Recognizing
activities in buildings helps provide more security for
residents by identifying unauthorized actions using
sensor data (Dridi et al., 2022). Smart building data,
in particular labeled data, is scarce and hard to collect
due to several factors such as cost, privacy, and time
(Dridi et al., 2023b). All these issues have pushed re-
searchers to consider unsupervised domain adaptation
(UDA) methods that collect knowledge from source
domains where labeled data is available and transfer
it to target domains where labeled data is unavailable
(Dridi et al., 2023b). Researchers aim, by sharing
knowledge across domains, to solve data scarcity is-
sues and to enhance target model performances. Pre-
vious works on UDA have considered the same la-
bel space between source and target domains while
sharing knowledge which is not the case in most real-
world scenarios. Indeed, collected datasets may con-
tain different or related classes and not necessarily the
same labels which can lead to negative transfer while
sharing knowledge across domains. In this work, we
Dridi, J., Amayri, M. and Bouguila, N.
Unsupervised Partial Domain Adaptation for Occupants Behavior Modeling in Smart Buildings.
DOI: 10.5220/0013073400003953
In Proceedings of the 14th International Conference on Smart Cities and Green ICT Systems (SMARTGREENS 2025), pages 69-76
ISBN: 978-989-758-751-1; ISSN: 2184-4968
Copyright © 2025 by Paper published under CC license (CC BY-NC-ND 4.0)
69

adapt partial UDA methods to share knowledge from
source to target domains where target labels are a sub-
set of source classes. The considered UPDA tech-
niques reduce the effect of negative transfer caused
by the source labels. The adapted methods are Ad-
versarial Re-weighting for Partial Domain Adaptation
(ARPDA) (Gu et al., 2021) and Selective Adversar-
ial Networks for Partial Domain Adaptation (SAN w
PDA) (Cao et al., 2018). We have compared their
performance to Adversarial Re-weighting for Stan-
dard Domain Adaptation (ARSDA) (Gu et al., 2021)
and Selective Adversarial Networks for Standard Do-
main Adaptation (SAN w SDA) (Cao et al., 2018)
as well as several previous UDA methods. Adver-
sarial Re-weighting is based on adversarial learning
and it learns the contribution of each source sample
to the update of the target model networks by assign-
ing them source weights. By re-weighting source do-
main data, it mitigates negative transfer, then it aligns
source and target data distributions by minimizing
a Wasserstein distance. Adversarial Re-weighting
has been evaluated with partial and standard UDA
(ARPDA and ARSDA). SAN (Selective Adversar-
ial Networks) is also based on adversarial learning,
it eliminates source samples with outlier labels and
encourages samples with shared labels, to mitigate
negative transfer while reducing discrepancy between
source and target domains. SAN has been evalu-
ated with partial and standard UDA (SAN w PDA
and SAN w SDA). The adapted methods have been
evaluated on smart buildings datasets for several AR
and OE tasks (Dridi et al., 2023a). This research
has several contributions as follows. It is the first to
adapt ARPDA, ARSDA, and SAN approaches from
2-dimensional space to 1-dimensional and evaluate
them with partial and standard UDA. It has provided
new architectures for the features extractor, classi-
fier, and discriminator modules that fit IoT data. The
newly adapted approaches can be applied to any 1-
D data and are not restricted to smart building data.
Partial UDA methods that have been adapted solve a
real issue related to negative transfer which is com-
mon in smart buildings data. A comparison analy-
sis between the findings of the adapted methods with
partial and standard UDA as well as previous UDA
methods. The adapted UPDA methods have outstand-
ing performances with scores up to 98%. The rest of
the paper is divided into 3 sections. In section 2, we
present some works related to OE, AR, and partial
DA. In section 3, we explain the adapted partial UDA
methods: ARPDA and SAN w PDA. In section 4, we
present the experimental setup and discuss the results.
2 LITERATURE REVIEW
AR and OE tasks, based on smart building data, can
contribute to the generation of several advantages
such as energy management (Dridi et al., 2023a). Do-
main adaptation solves the problem of data scarcity
which is common in smart buildings by sharing
knowledge across domains (Dridi et al., 2023b). Sev-
eral works have been done on AR, OE, and DA.
2.1 Occupancy Estimation (OE)
Occupancy estimation (Amayri et al., 2019), is the
task of counting people in an area such as a room,
apartment, or building. Several works have been
done to predict the number of occupants using dif-
ferent types of smart building data. (Chen et al.,
2017) has developed an OE method based on hid-
den Markov models (HMMs) and logistic regression
to optimize HVAC systems and ensure safety within
buildings. The approach is called an inhomogeneous
hidden Markov model with multinomial logistic re-
gression (IHMM-MLR), and it uses environmental
sensors (Chen et al., 2017), such as humidity and CO2
concentration sensors, to collect the required data.
2.2 Activity Recognition (AR)
Activity recognition (Ali and Bouguila, 2020), is a
smart building task that aims to understand the be-
havior and actions of people by recognizing their ac-
tivities. AR is beneficial by providing several advan-
tages such as security and HVAC systems optimiza-
tion. (Wang et al., 2016) has used smartphone in-
ertial sensors, such as gyroscopes, to collect needed
data for AR. The choice of smartphone sensors is due
to their low cost (Wang et al., 2016). Activities of
people have been recognized using collected data and
machine learning classifiers such as the Na
¨
ıve Bayes
classifier.
2.3 Partial Domain Adaptation (PDA)
Domain adaptation (Dridi et al., 2023b), is a tool
used to solve data scarcity issues by sharing knowl-
edge from domains where data is available to other
domains where data is scarce. In smart buildings,
data scarcity is a common issue that has pushed
researchers to employ domain adaptation methods.
Most research focuses on standard domain adaptation
where source and target domains share the same label
space which is not the case with real-world datasets.
Collected smart building data contains related labels
and a few common labels between domains. (Li
SMARTGREENS 2025 - 14th International Conference on Smart Cities and Green ICT Systems
70
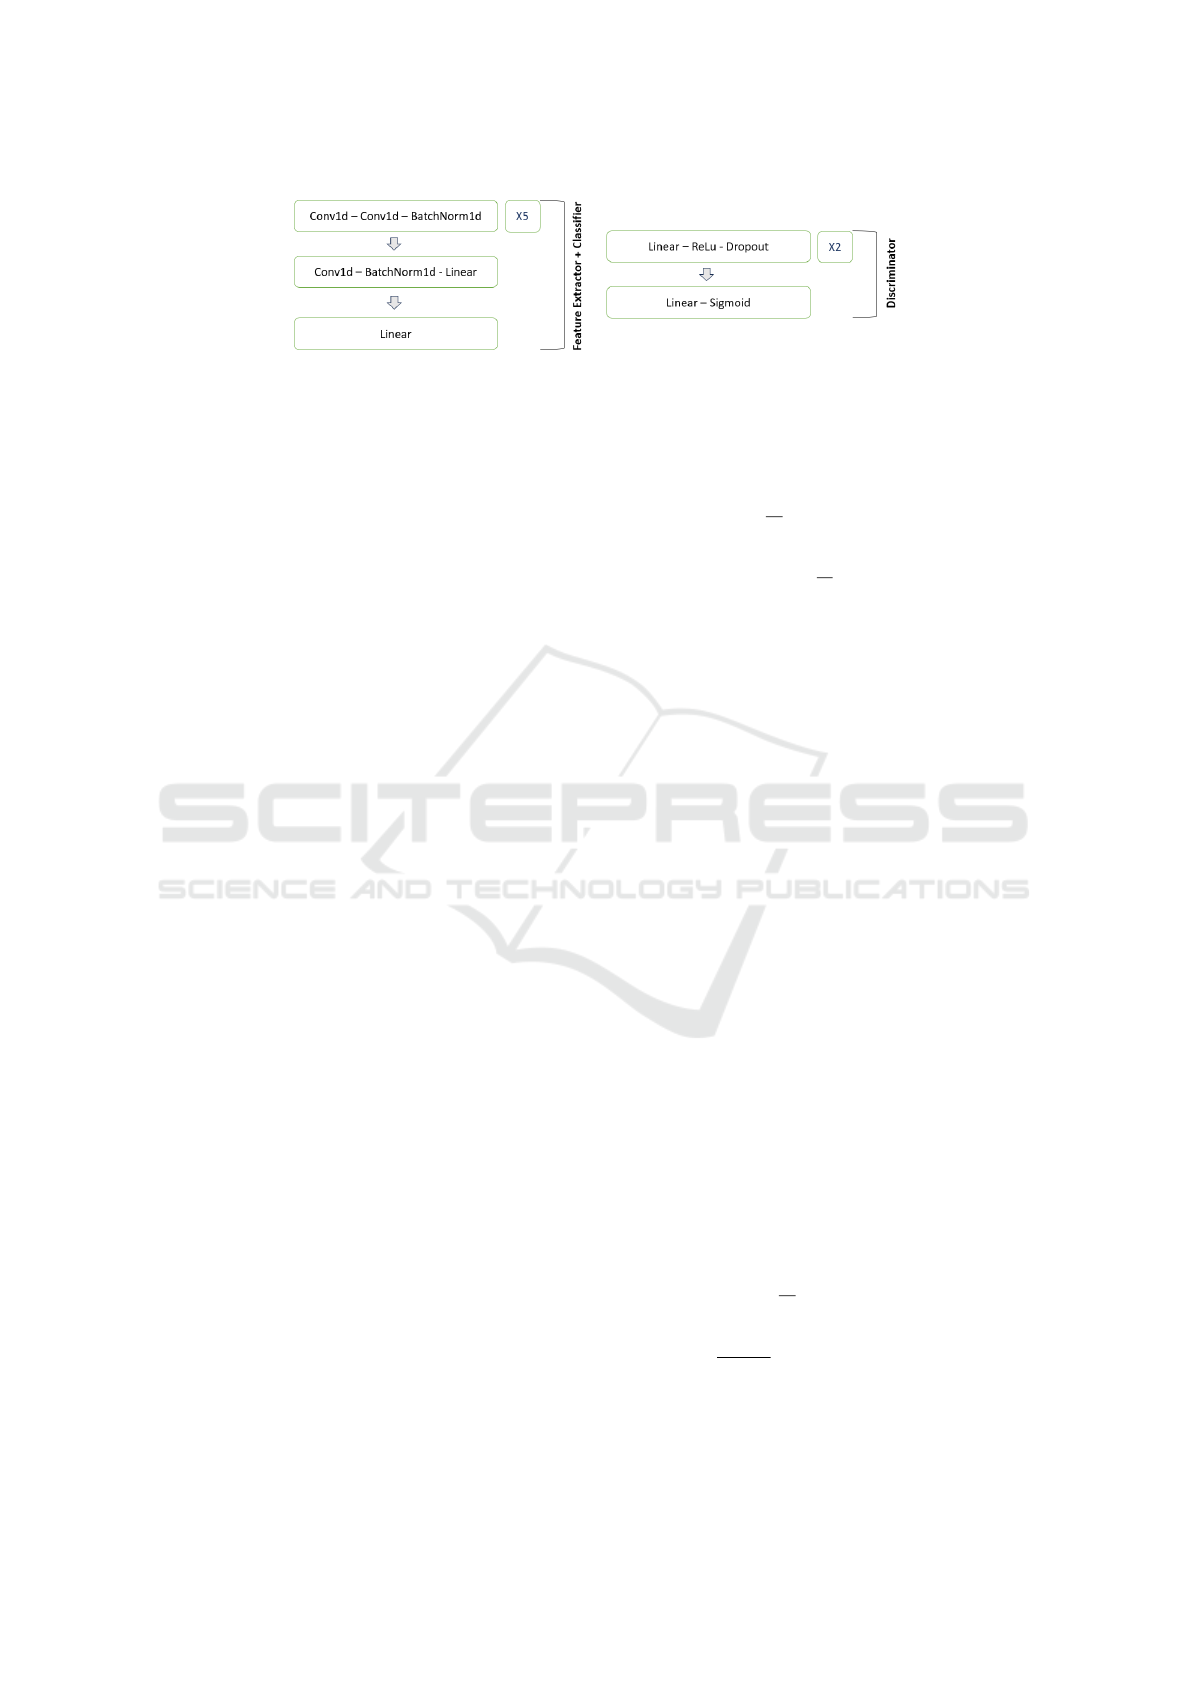
Figure 1: Model and discriminator architectures for UPDA approaches.
et al., 2020) has developed a PDA method called Deep
Residual Correction Network (DRCN) which reduces
the negative transfer created by outlier source labels.
In this research, we aim to estimate the number
of occupants in buildings and recognize their activi-
ties. Since smart building data is scarce, we use do-
main adaptation methods, particularly unsupervised
approaches. Commonly, real-world datasets do not
share the same label space, but they may share a sub-
set of classes. Therefore, we consider partial domain
adaptation to mitigate the effect of negative transfer
created by outlier source labels. We consider Un-
supervised Partial Domain Adaptation for Estimat-
ing Occupancy and Recognizing Activities in Smart
Buildings.
3 METHODS
In this work, we consider partial UDA methods that
deal with real-world scenarios where datasets con-
tain a common label subspace and multiple unre-
lated labels. Let us consider a labeled source do-
main S = {x
s
i
, y
s
i
}
n
s
i=1
and an unlabeled target domain
T = {x
t
i
}
n
t
i=1
, with n
s
and n
t
the number of source
and target samples, respectively. Let Y
s
and Y
t
be
the source and target label spaces, respectively, where
Y
t
⊂ Y
s
. Figure 1 gives the newly created architec-
tures for the feature extractor, classifier, and discrim-
inator modules of the adapted methods.
3.1 Adversarial Re-Weighting for
Partial Domain Adaptation
(ARPDA)
ARPDA applies a feature transformation using a fea-
ture extractor F, then it re-weights the source samples
using adversarial learning based on their importance
for the target label space (Gu et al., 2021). ARPDA
applies a reweighted cross-entropy objective using the
generated weights of source data, and a conditional
entropy objective to update the target model (the fea-
ture extractor F and the classifier C) to allow knowl-
edge transfer across the domains (Gu et al., 2021).
The overall objective is a combination of a target
domain conditional entropy and a source domain re-
weighted cross-entropy losses as defined in Eq.(1).
L(θ
F
, θ
C
, W ) =
1
n
s
n
s
∑
i=1
w
i
J (C(F(x
s
i
;θ
F
);θ
C
), y
s
i
)+
1
n
t
n
t
∑
j=1
H(C(F(x
t
j
;θ
F
);θ
C
))
(1)
where H(·) is a conditional entropy, J (·, ·) is a
cross-entropy objective, (θ
F
, θ
C
) are the parameters
of the model, and W = {w
i
}
n
s
i=1
is a weights vector
of source samples (Gu et al., 2021). The conditional
entropy loss encourages the separation of classes, and
the re-weighted cross-entropy loss predicts the classes
of input data (Gu et al., 2021). The Wasserstein
distance is used to measure the relatedness between
source and target samples in order to re-weigh source
instances based on their importance. The shared label
space between source and target domains is supposed
to have close data distribution (Gu et al., 2021).
3.2 Selective Adversarial Networks for
Partial Domain Adaptation (SAN w
PDA)
SAN w PDA (Cao et al., 2018), is an UPDA method
that combines both the reduction of negative transfer
caused by outlier source samples and the promoting
of positive transfer generated by the rest of source
data. It is based on adversarial learning (Cao et al.,
2018) which has been used in several research that
tackles standard UDA where the source and target la-
bel spaces are the same. For a typical standard UDA
based on adversarial learning the objective defined in
Eq.(2) can be an example.
C
o
(θ
f
, θ
y
, θ
d
) =
1
n
s
∑
x
i
∈S
L
y
(G
y
(G
f
(x
i
)), y
i
)−
λ
n
s
+ n
t
∑
x
i
∈(S
S
T )
L
d
(G
d
(G
f
(x
i
), d
i
),
(2)
where G
f
is a feature extractor with parameters
θ
f
, G
y
is a classifier with parameters θ
y
, G
d
is a
Unsupervised Partial Domain Adaptation for Occupants Behavior Modeling in Smart Buildings
71

discriminator with parameters θ
d
, λ is a balancing-
parameter, L
y
is a label prediction loss, L
d
is a domain
discriminator loss, and d
i
is a domain label. For par-
tial UDA, the domain discriminator’s objective is up-
graded by assigning a discriminator G
k
d
for each of all
the target labels (K). Since the target data is unlabeled
it is not evident to assign each discriminator G
k
d
to tar-
get input data x
i
. Therefore, pseudo-labels ˆy
i
= G
y
(x
i
)
are given to each data sample using the source knowl-
edge (Cao et al., 2018). A new probability-weighted
domain discriminator objective is defined in Eq.(3).
L
′
d
=
1
n
s
+ n
t
K
∑
k=1
∑
x
i
∈(S
S
T )
ˆy
k
i
L
k
d
(G
k
d
(G
f
(x
i
), d
i
), (3)
where d
i
is a domain label, L
k
d
is a cross-entropy
objective, and G
k
d
is a domain discriminator module
for the k-th source class (Cao et al., 2018). The con-
sidered multi-discriminator domain adversarial net-
work reduces negative transfer and promotes positive
transfer by aligning each data sample with data points
that are close or with the same classes, and by us-
ing probability weights for each domain discrimina-
tor which filters unrelated data sample classes (Cao
et al., 2018). The proposed objective can be further
enhanced by enhancing the positive transfer. The loss
defined in Eq.(4) reduces further the weights of the
domain discriminators of outlier source classes (Cao
et al., 2018).
L
′
d
=
1
n
s
+ n
t
K
∑
k=1
(
1
n
t
∑
x
i
∈T
ˆy
k
i
)∗
∑
x
i
∈(S
S
T )
ˆy
k
i
L
k
d
(G
k
d
(G
f
(x
i
), d
i
),
(4)
where
1
n
t
∑
x
i
∈T
ˆy
k
i
represents the weights for each
label k which is large for common source and tar-
get classes and small for outlier labels (Cao et al.,
2018). Since the reduction of negative transfer and
the outliers filtration depends heavily on ˆy
i
= G
y
(x
i
),
we introduce a conditional-entropy H(·) as in (Gu
et al., 2021) for further performance enhancement.
The overall objective function of SAN w PDA is de-
fined in Eq.(5).
C(θ
f
, θ
y
, θ
k
d
) =
1
n
s
∑
x
i
∈S
L
y
(G
y
(G
f
(x
i
)), y
i
)+
1
n
t
∑
x
i
∈T
H(G
y
(G
f
(x
i
)))−
λ
n
s
+ n
t
K
∑
k=1
(
1
n
t
∑
x
i
∈T
ˆy
k
i
)
∑
x
i
∈(S
S
T )
ˆy
k
i
L
k
d
(G
k
d
(G
f
(x
i
), d
i
),
(5)
where λ is a balancing parameter.
4 EXPERIMENTAL SETUP AND
RESULTS
4.1 Experimental Setup
For OE, we used our private datasets (Amayri and
Ploix, 2018) collected in two offices at Grenoble In-
stitute of Technology. For USDA, we considered
3 levels of occupancy: no occupant, one occupant,
and two occupants. For UPDA, we considered 5
levels of occupancy by adding three occupants and
four occupants levels (Amayri and Ploix, 2018). The
datasets have been collected using ambient sensors
such as power consumption sensors (Amayri and
Ploix, 2018). For AR, we used the Washington State
University (WSU) Center for Advanced Studies in
Adaptive Systems (CASAS) datasets (Cook, 2010).
They have been collected using ambient sensors such
as door contact sensors (Cook, 2010). For USDA, we
considered 5 activities: preparing breakfast, prepar-
ing lunch, preparing dinner, watching TV, and toilet-
ing. However, for UPDA, we considered 7 activities
by adding bathing and sleeping out-of-bed activities
(Cook, 2010). We have used accuracy as a metric
for balanced datasets and F1 score as a metric for
unbalanced datasets (Dridi et al., 2023a; Dridi et al.,
2022; Dridi et al., 2023b). Table 1 shows some of the
values of the used parameters in the adapted meth-
ods: number of epochs, batch size, optimizer, learn-
ing rate, gamma value linked with the learning rate,
weight decay for L2 penalization, and momentum.
We have compared the obtained scores from UDA
methods with a supervised machine learning method
(SMLM) which is a decision tree classifier trained and
evaluated on target data. SMLM is considered as a
reference in this research to evaluate the efficiency of
the adapted methods compared to supervised learning
methods.
4.2 Experimental Results
4.2.1 5-label AR
5-label AR is the task of recognizing 5 human activi-
ties in buildings. For standard UDA, where the source
and target label spaces are the same, the considered
activities are: toileting, watching TV, cooking break-
fast, lunch, and dinner. For partial UDA, where the
target label space is a part of the source label space,
the added two activities to the source domain: bathing
and sleeping. Table 2 gives the obtained scores for
the adapted UPDA and USDA techniques, supervised
machine learning methods (SMLM) as well as pre-
vious research on UDA (Dridi et al., 2023a). AR-
SMARTGREENS 2025 - 14th International Conference on Smart Cities and Green ICT Systems
72
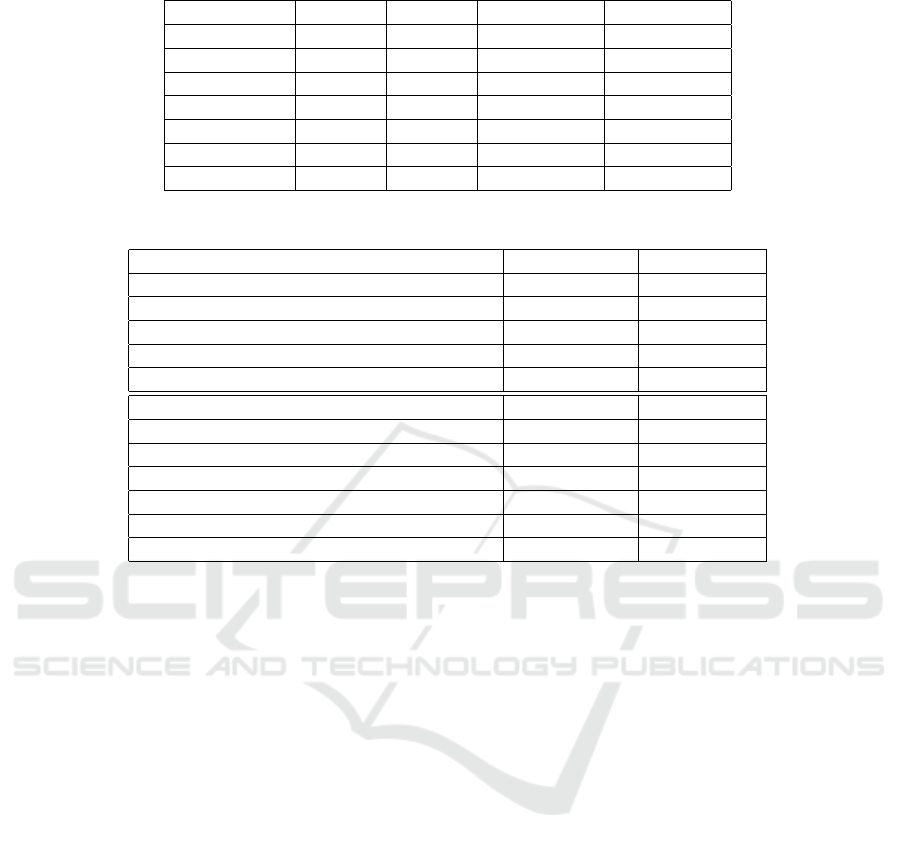
Table 1: Parameters used in the implemented methods.
Parameter ARSDA ARPDA SAN w SDA SAN w PDA
epochs 1000 1000 1000 1000
batch-size 36 36 36 36
optimizer SGD SGD SGD SGD
lr 1e-3 1e-3 1e-2 1e-2
gamma 1e-3 1e-3 1.0 1.0
momentum 0.9 0.9 0.9 0.9
weight-decay 5e-4 5e-4 5e-4 5e-4
Table 2: AR accuracy for 5 balanced classes and F1 score for 5 unbalanced classes.
Method Accuracy (%) F1-score (%)
ARSDA 84.67 73.98
ARPDA 67.33 62.32
SAN w SDA 78.00 63.79
SAN w PDA 68.13 54.16
SMLM 99.33 98.66
DSN (Dridi et al., 2023a) 20.66 23.12
CAT (Dridi et al., 2023a) 38.00 55.64
CAT+RevGrad (Dridi et al., 2023a) 49.00 51.15
CoWA-JMDS (Dridi et al., 2023a) 30.68 18.20
CoWA-JMDS w/o WM (Dridi et al., 2023a) 24.40 10.85
DaC (Dridi et al., 2023a) 56.08 36.65
AaD (Dridi et al., 2023a) 33.19 14.67
SDA, which is a standard UDA method where source
and target label spaces are the same, has the best per-
formance for both balanced and unbalanced datasets
with 84.67% accuracy and 73.98% F1 score. The de-
crease in performance with unbalanced datasets is ex-
pected (Dridi et al., 2023a; Dridi et al., 2022; Dridi
et al., 2023b) since label proportions change leads
to performance degradation in most cases. ARPDA,
which is a partial UDA version of ARSDA where the
source domain has more labels than the target domain,
has a great performance for both balanced and unbal-
anced datasets but less than the performance of AR-
SDA. The decrease in performance is expected since
ARPDA faces the challenge of negative transfer cre-
ated by outlier labels such as bathing. With unbal-
anced datasets, we see a further decrease in perfor-
mance which is expected for different label propor-
tions with 62.32% of F1 score compared to balanced
datasets with 67.33% of accuracy. The performance
of ARPDA is good when compared to supervised ma-
chine learning method performance (SMLM). Also,
ARPDA has exceeded several previous standard UDA
methods such as DSN (Dridi et al., 2023a) and CAT
(Dridi et al., 2023a). The great performance is thanks
to adversarial learning that helped reduce the effect
of outlier source samples. SAN w PDA has also
given great performance comparable to ARPDA with
68.13% of accuracy for balanced label proportions
and 54.16% of F1 score for unbalanced datasets.
SAN w SDA, where source and target label space are
the same, has better performance than SAN w PDA
which is expected since we are not facing the chal-
lenge of negative transfer. SAN w PDA has exceeded
several standard UDA methods (Dridi et al., 2023a)
which is a great achievement for a method that has
the challenge of negative transfer.
4.2.2 3-Label AR
3-label AR is the task of recognizing 3 activities that
are common between source and target domain for
standard UDA. The activities are: toileting, watch-
ing TV, and cooking dinner. For partial UDA, we add
outlier labels for the source domain (cooking break-
fast and lunch). Table 3 gives all the obtained scores.
Compared to the supervised machine learning method
(SMLM) which trains and evaluates a classifier us-
ing labeled target data, the adapted standard and par-
tial UDA have shown an outstanding performance.
ARPDA has an accuracy of 94% which is a bit lower
than the standard UDA method (ARSDA), and this
proves the efficiency of adversarial learning to remove
negative transfer created by outlier source data. SAN
w PDA has also given outstanding performance ex-
ceeding ARPDA (95.99%) which is also a bit lower
Unsupervised Partial Domain Adaptation for Occupants Behavior Modeling in Smart Buildings
73
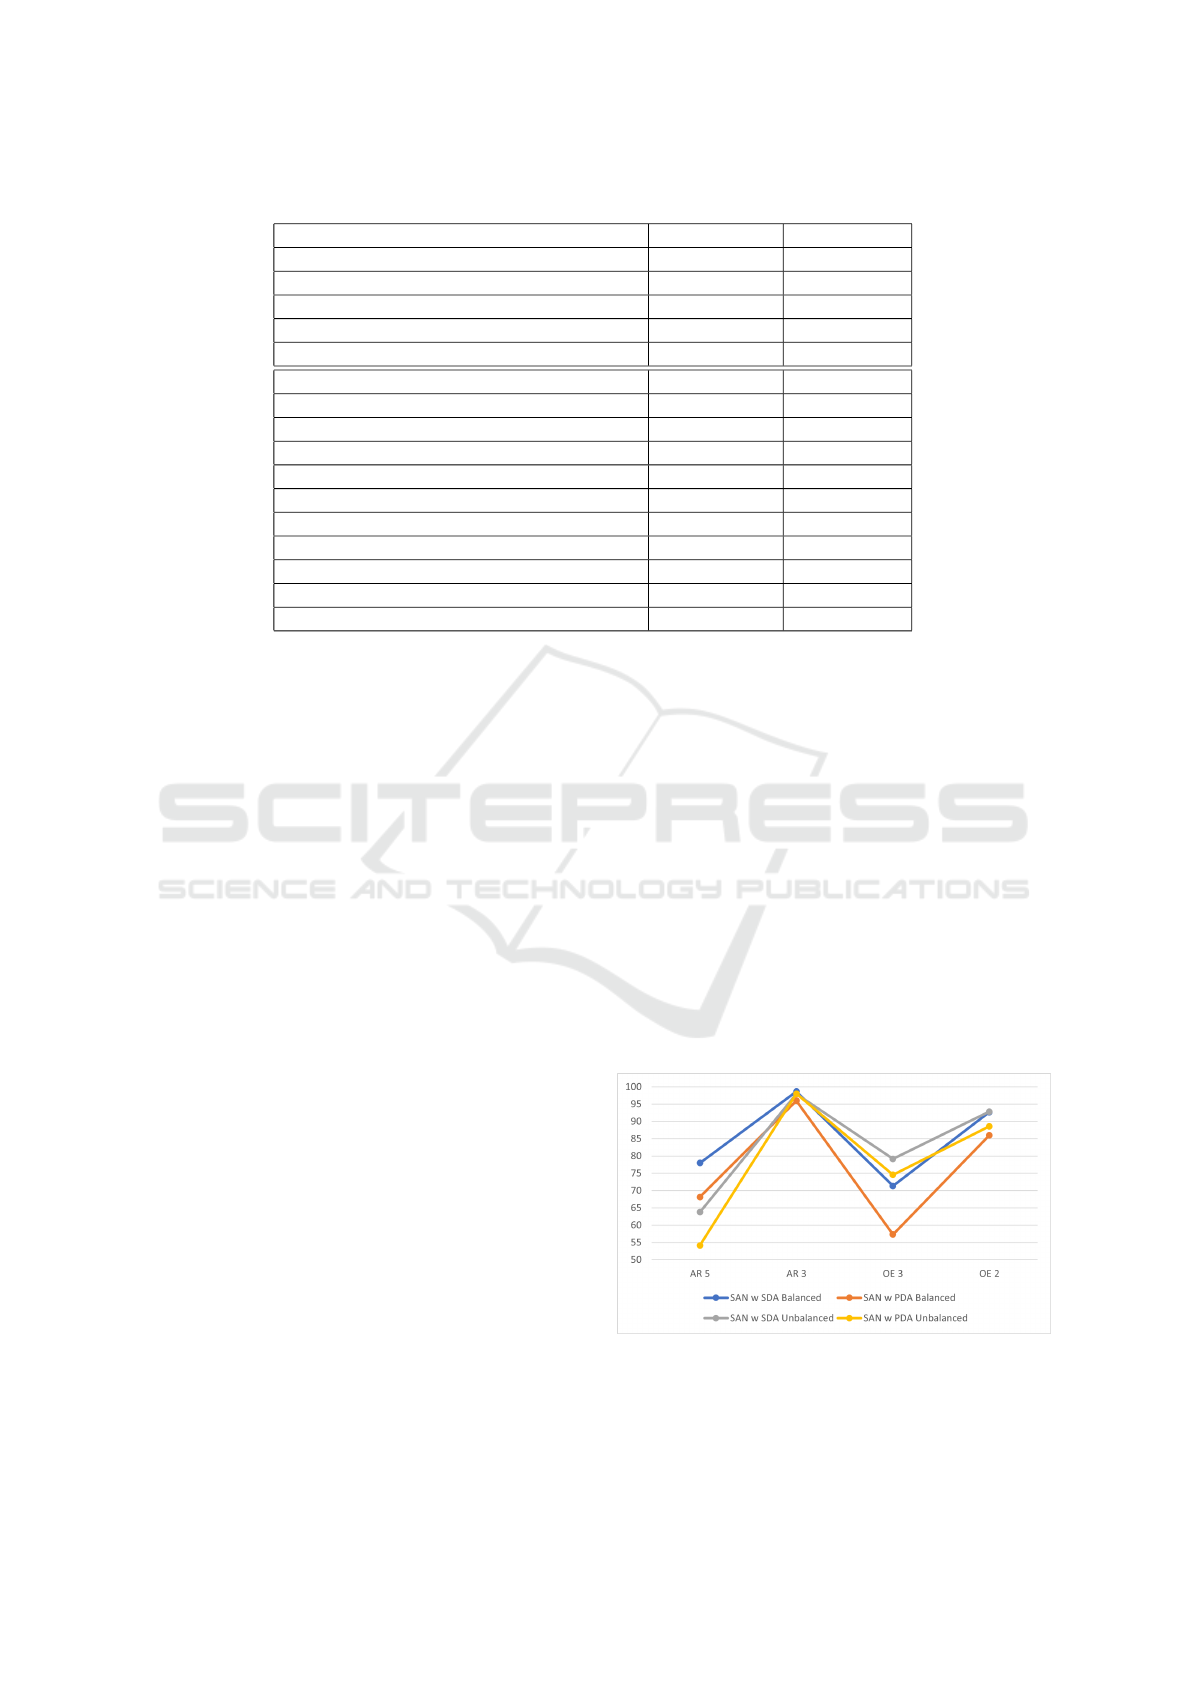
Table 3: AR accuracy for 3 balanced classes and F1 score for 3 unbalanced classes.
Method Accuracy (%) F1-score (%)
ARSDA 95.33 97.97
ARPDA 94.00 97.98
SAN w SDA 98.67 97.98
SAN w PDA 95.99 97.99
SMLM 100 100
DSN (Dridi et al., 2023a) 39.00 45.54
CAT (Dridi et al., 2023a) 78.00 80.00
CAT+RevGrad (Dridi et al., 2023a) 87.00 75.79
CAT+rRevGrad (Dridi et al., 2023a) 65.50 80.68
ATDOC+NC (Dridi et al., 2023a) 84.00 87.35
CoWA-JMDS (Dridi et al., 2023a) 65.07 46.79
CoWA-JMDS w/o WM (Dridi et al., 2023a) 58.00 33.28
DaC (Dridi et al., 2023a) 81.93 79.78
AaD (Dridi et al., 2023a) 58.09 25.18
SHOT-IM (Dridi et al., 2023a) 88.80 93.31
SHOT-Pseudo-labeling (Dridi et al., 2023a) 78.80 87.70
than SAN w SDA (98.67%). For unbalanced label
proportions, all the adapted standard and partial UDA
methods have almost the same performance with out-
standing scores around 98%. The excellent F1 scores
are greater than the performance of balanced datasets
which can be due to the additional information gained
about the labels’ proportion difference as explained
before (Dridi et al., 2023a; Dridi et al., 2022; Dridi
et al., 2023b). The adapted UPDA methods have the
advantage of excessively reducing the effect of neg-
ative transfer which can be seen by the close perfor-
mance with USDA methods, and they have the ad-
vantage of exceeding multiple previous USDA meth-
ods with a large performance gap such as DaC (Dridi
et al., 2023a).
4.2.3 3-Label OE
3-label OE is the task of predicting 3 levels of oc-
cupancy for standard UDA which are no occupant,
one occupant, and two occupants. For partial UDA
methods, we add 2 levels which are 3 occupants and
4 occupants levels. Table 4 gives all the obtained
scores for current tasks. ARPDA and SAN w PDA
have shown very good performances for estimating
the number of occupants even with outlier samples
of source domains. Thanks to promoting the positive
transfer, SAN w PDA has 57.33% accuracy and 74.55
F1 score for balanced and unbalanced datasets, re-
spectively. There is a remarkable drop in performance
for SAN w PDA compared to SAN w SDA which is
expected due to the effect of source outlier labels. The
increase in performance with unbalanced datasets is
thanks to gathered information about label proportion
differences as explained in (Dridi et al., 2023a; Dridi
et al., 2022; Dridi et al., 2023b). ARPDA has ex-
ceeded SAN w PDA with very good performances for
both balanced and unbalanced datasets. ARPDA with
61.33% accuracy and 69.87% F1 score has exceeded
multiple USDA methods such as CoWA-JMDS (Dridi
et al., 2023a) even though it is a UPDA method, and it
has close performance to ARSDA where source and
target label spaces are the same. For partial UDA,
ARPDA has the best performance for the current sce-
nario thanks to the efficient use of adversarial learning
to reduce the effect of negative transfer created by out-
lier source data. The excellent performance obtained
for the unbalanced datasets with partial and unsuper-
vised DA methods proves the efficiency of the consid-
ered techniques that can overcome the combination of
several challenges and provide very good results.
Figure 2: SAN results for balanced and unbalanced datasets
with standard and partial domain adaptation.
SMARTGREENS 2025 - 14th International Conference on Smart Cities and Green ICT Systems
74
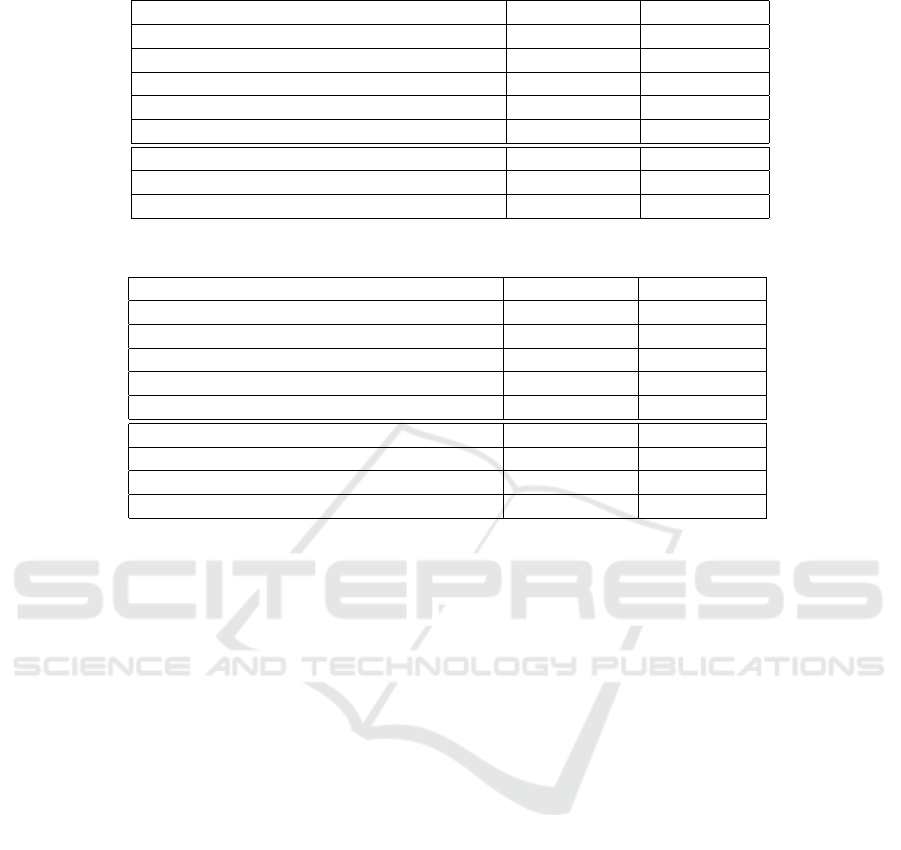
Table 4: OE accuracy for 3 balanced classes and F1 score for 3 unbalanced classes.
Method Accuracy (%) F1-score (%)
ARSDA 76.67 82.91
ARPDA 61.33 69.87
SAN w SDA 71.33 79.15
SAN w PDA 57.33 74.55
SMLM 94.00 91.93
DSN (Dridi et al., 2023a) 34.80 57.01
CoWA-JMDS (Dridi et al., 2023a) 40.59 54.72
CoWA-JMDS w/o WM (Dridi et al., 2023a) 49.05 55.51
Table 5: OE accuracy for 2 balanced classes and F1 score for 2 unbalanced classes.
Method Accuracy (%) F1-score (%)
ARSDA 94.00 87.73
ARPDA 85.33 88.47
SAN w SDA 92.67 92.84
SAN w PDA 86.00 88.58
SMLM 96.66 95.30
DSN (Dridi et al., 2023a) 56.00 63.87
ATDOC+NC (Dridi et al., 2023a) 82.65 86.19
CoWA-JMDS (Dridi et al., 2023a) 76.55 72.31
CoWA-JMDS w/o WM (Dridi et al., 2023a) 85.88 72.31
4.2.4 2-Label OE
2-label OE is the task of estimating two levels of
occupants for standard UDA: no occupant and one
occupant. For UPDA, we add an outlier level for
source data which is: the 2 occupants level. Table
5 illustrates the performances of current and previ-
ous methods. All the adapted methods for standard
and partial UDA have given excellent scores that are
so close to the performance of SMLM which is a
great achievement. ARSDA has an accuracy of 94%
that exceeds ARPDA by around 8.5% which is ex-
pected due to the effect of negative transfer. SAN w
SDA has an accuracy of 92.67% that exceeds SAN w
PDA by around 6.5%. For unbalanced datasets, we
see a small increase in performance for most methods
which is explained by the additional information pro-
vided by the label proportion changes as explained in
(Dridi et al., 2023a; Dridi et al., 2022; Dridi et al.,
2023b). Overall the scores are excellent and they
have exceeded several previous standard UDA meth-
ods such as ATDOC+NC (Dridi et al., 2023a). Ob-
taining scores greater than 90% even the challenges
of negative transfer, unlabeled data, and unbalanced
label proportions, prove the efficiency of the consid-
ered methods.
4.3 Discussion
In this section, we chose the SAN method to discuss
further because it has the best performances for both
partial and standard UDA on average. Figure 2 gives
a graphic illustration of the obtained scores for both
SAN w PDA and SDA for all smart building tasks.
In the first view, we notice that all methods follow
the same trend for the different tasks with small dif-
ferences in performance for each smart building task.
It is clear that standard UDA has better performance
than partial UDA for all the methods and tasks which
is expected since UPDA methods face the challenge
of negative transfer created by outlier source labels.
The conclusions can be seen by the fact that USDA
charts are above UPDA charts for both balanced and
unbalanced scenarios. Also, it is clear that the de-
crease in task complexity increases performance such
as moving from 5-label AR to 3-label AR which is
expected as explained before in (Dridi et al., 2023b).
Adapted methods performances for UPDA are greater
than 90% for multiple scenarios which is an excel-
lent achievement for the current research that pushes
these techniques to real-world applications. The low-
est score is around 55% which is acceptable for the
current research that deals with data scarcity, unla-
beled target data, negative transfer, and unbalanced
label proportions.
Unsupervised Partial Domain Adaptation for Occupants Behavior Modeling in Smart Buildings
75

5 CONCLUSION
In conclusion, partial UDA methods have been
adapted and evaluated on AR and OE tasks aiming
to provide energy management, security, and HVAC
systems optimization for smart buildings. This work
has several contributions. Indeed, it is the first to
adapt ARPDA, ARSDA, and SAN approaches from
2-dimensional space to 1-dimensional and evaluate
them with partial and standard UDA. This research
has provided new architectures for the features extrac-
tor, classifier, and discriminator modules that fit IoT
data. The newly adapted approaches can be applied to
any 1-D data and are not restricted to smart building
data. Partial UDA methods that have been adapted
solve a real issue related to negative transfer which is
common in smart buildings data. Also, a comparison
analysis between the findings of the adapted meth-
ods with partial and standard UDA as well as previ-
ous UDA methods. The adapted UPDA methods have
outstanding performances with scores up to 98%. In
future work, we consider UPDA methods applied to
smart building tasks with more outlier labels in source
domains and compare the findings with the current re-
search.
REFERENCES
Ali, S. and Bouguila, N. (2020). Online learning for
beta-liouville hidden markov models: Incremental
variational learning for video surveillance and action
recognition. In 2020 IEEE International Conference
on Image Processing (ICIP), pages 3249–3253. IEEE.
Amayri, M. and Ploix, S. (2018). Decision tree and
parametrized classifier for estimating occupancy in
energy management. In 2018 5th International Con-
ference on Control, Decision and Information Tech-
nologies (CoDIT), pages 397–402. IEEE.
Amayri, M., Ploix, S., Najar, F., Bouguila, N., and Wurtz,
F. (2019). A statistical process control chart ap-
proach for occupancy estimation in smart buildings.
In 2019 IEEE Symposium Series on Computational
Intelligence (SSCI), pages 1729–1734. IEEE.
Cao, Z., Long, M., Wang, J., and Jordan, M. I. (2018).
Partial transfer learning with selective adversarial net-
works. In Proceedings of the IEEE conference on
computer vision and pattern recognition, pages 2724–
2732.
Chen, Z., Zhu, Q., Masood, M. K., and Soh, Y. C. (2017).
Environmental sensors-based occupancy estimation in
buildings via ihmm-mlr. IEEE Transactions on Indus-
trial Informatics, 13(5):2184–2193.
Cook, D. J. (2010). Learning setting-generalized activity
models for smart spaces. IEEE intelligent systems,
2010(99):1.
Dridi, J., Amayri, M., and Bouguila, N. (2022). Transfer
learning for estimating occupancy and recognizing ac-
tivities in smart buildings. Building and Environment,
217:109057.
Dridi, J., Amayri, M., and Bouguila, N. (2023a). Unsuper-
vised domain adaptation with and without access to
source data for estimating occupancy and recognizing
activities in smart buildings. Building and Environ-
ment, 243:110651.
Dridi, J., Amayri, M., and Bouguila, N. (2023b). Unsuper-
vised domain adaptation without source data for esti-
mating occupancy and recognizing activities in smart
buildings. Energy and Buildings, page 113808.
Gu, X., Yu, X., Sun, J., Xu, Z., et al. (2021). Adversarial
reweighting for partial domain adaptation. Advances
in Neural Information Processing Systems, 34:14860–
14872.
Kazmi, H., Mehmood, F., and Amayri, M. (2017). Smart
home futures: Algorithmic challenges and opportu-
nities. In 2017 14th International Symposium on
Pervasive Systems, Algorithms and Networks & 2017
11th International Conference on Frontier of Com-
puter Science and Technology & 2017 Third Inter-
national Symposium of Creative Computing (ISPAN-
FCST-ISCC), pages 441–448. IEEE.
Li, S., Liu, C. H., Lin, Q., Wen, Q., Su, L., Huang, G., and
Ding, Z. (2020). Deep residual correction network for
partial domain adaptation. IEEE transactions on pat-
tern analysis and machine intelligence, 43(7):2329–
2344.
Prabhakaran, K., Dridi, J., Amayri, M., and Bouguila, N.
(2022). Explainable k-means clustering for occupancy
estimation. Procedia Computer Science, 203:326–
333.
Wang, A., Chen, G., Yang, J., Zhao, S., and Chang, C.-Y.
(2016). A comparative study on human activity recog-
nition using inertial sensors in a smartphone. IEEE
Sensors Journal, 16(11):4566–4578.
Zamzami, N., Amayri, M., Bouguila, N., and Ploix, S.
(2019). Online clustering for estimating occupancy
in an office setting. In 2019 IEEE 28th International
Symposium on Industrial Electronics (ISIE), pages
2195–2200. IEEE.
SMARTGREENS 2025 - 14th International Conference on Smart Cities and Green ICT Systems
76
