
Towards More Robust Transcription Factor Binding Site Classifiers
Using Out-of-Distribution Data
Istv
´
an Megyeri
1 a
and Gergely Pap
1,2,3 b
1
University of Szeged, Dugonics Square 13, Szeged, 6720, Hungary
2
HUN-REN-SZTE Research Group on Artificial Intelligence, Szeged, Hungary
3
Princess Margaret Cancer Centre, 610 University Ave. Toronto, ON M5G 2M9, Canada
Keywords:
Transcription Factor Binding Sites, Neural Networks, Robustness.
Abstract:
The use of deep learning methods for solving tasks in computational biology has increased in recent years.
Many challenging problems are now addressed with novel architectures, training strategies and techniques
involved in deep learning such as gene expression prediction, identifying splicing patterns, and DNA-protein
binding site classification. Moreover, interpretability has become a key component of those methods used to
solve computational biology tasks. Gaining a novel insight by analyzing the learners is a key factor. However,
most deep learning models are hard to interpret, and they are prone to learn features which generalize poorly.
In this study, we examine the robustness of high performing neural networks using in-distribution (ID) and out-
of-distribution (OOD) examples. We demonstrate our findings in two different tasks taken from the domain of
DNA-protein binding site classification and show that the overconfident and incorrect predictions are a result
of the training data that has been built exclusively from ID samples. Adding OOD data to the training process
enhances the reliability of the networks and it improves the performance on the ID tasks.
1 INTRODUCTION
Transcription factors (TFs) are proteins that regulate
gene expression. They exert their influence through
binding to the strands of DNA. Disruptions in the reg-
ulatory mechanism of TFs are associated with sev-
eral diseases like some types of cancer (Vishnoi et al.,
2020; Lambert et al., 2018). Therefore, understand-
ing the way TFs work in healthy and unhealthy cir-
cumstances is an important research area. Sequenc-
ing techniques such as ChIP-seq and CUT&RUN pro-
vide information about the segments of DNA where
TF binding occurs. However, these experiments are
costly and not completely accurate. Consequently,
exploring other methods to predict TF binding might
prove advantageous.
Recently, machine learning and deep learning
methods have advanced the state of the field regarding
TFs by being able to detect their binding sites. These
detections rely on using the large amount of data pro-
duced by Next-Generation-Sequencing (NGS) tech-
niques, then a trained machine learning model is used
a
https://orcid.org/0000-0002-7918-6295
b
https://orcid.org/0000-0002-6641-5845
to examine the TFs. Extracting such regular pat-
terns from neural networks can describe nucleotide
sequences where the binding occurs, this being anal-
ogous to Position Weight Matrices (Alipanahi et al.,
2015).
Altering neural network architectures to enhance
prediction performance has received significant atten-
tion in the field. Early methods relied on convolu-
tional neural networks with nucleotide sequences as
input (Alipanahi et al., 2015; Qin and Feng, 2017).
Then recurrent neural networks and attention mech-
anisms were adopted for Transcription Binding Site
(TFBS) classification (Hassanzadeh and Wang, 2016;
Park et al., 2020). Often interpretability and reliabil-
ity of the models are expected to improve owing to
these improvements. Here, we claim that novel archi-
tectures are not sufficient and better training strategies
need to be developed to enhance reliability.
Including other modalities in the training process
(Chiu et al., 2023; Wang et al., 2023), and differ-
ent ways of representing the input sequence can help
models learn patterns that are not feasibly recogniz-
able from just using the base pairs. Methods that
rely on physico-chemical or conformational, or epige-
nomics features are likely to outperform nucleotide
40
Megyeri, I. and Pap, G.
Towards More Robust Transcription Factor Binding Site Classifiers Using Out-of-Distribution Data.
DOI: 10.5220/0013076600003890
In Proceedings of the 17th International Conference on Agents and Artificial Intelligence (ICAART 2025) - Volume 3, pages 40-47
ISBN: 978-989-758-737-5; ISSN: 2184-433X
Copyright © 2025 by Paper published under CC license (CC BY-NC-ND 4.0)
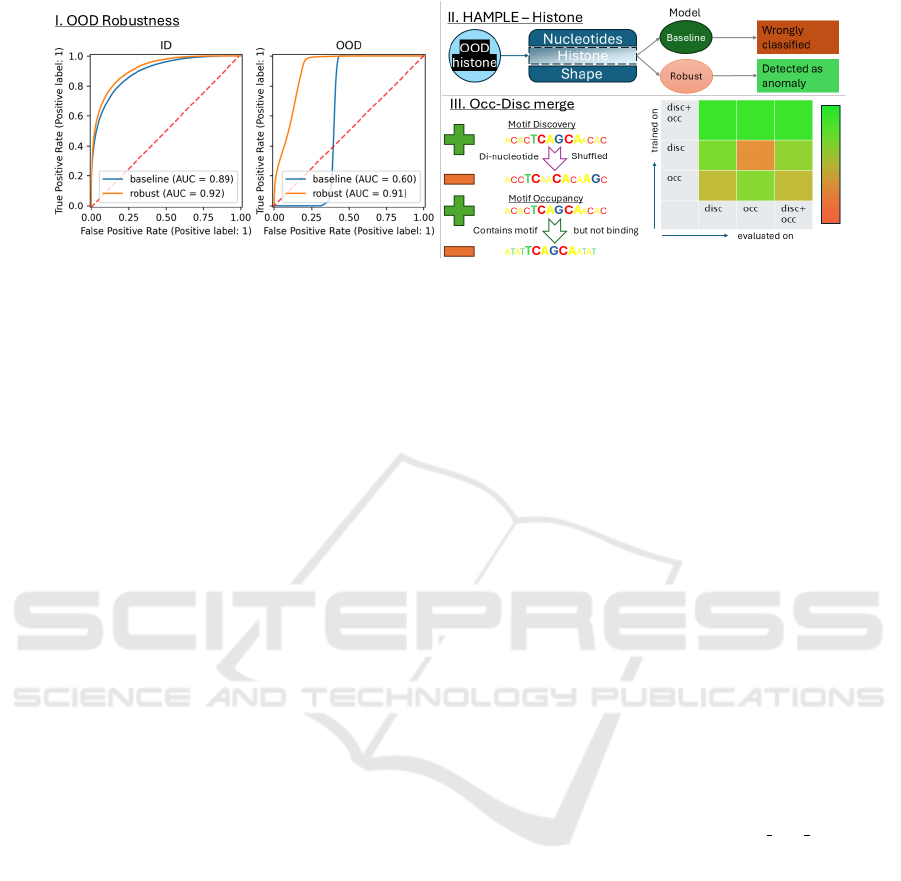
Figure 1: Networks trained and evaluated on in-distribution samples show high performance. However, when evaluated on
OOD examples their performance suffers irrespective their training methods. More robust models can be built by augmenting
training with out-of-distribution batches for uni-modal as well as multi-modal learners. For multi-modal, the OOD samples
are generated by modifying a single feature of the multi-modal input. Training a uni-modal network on one (occupancy)
classification subtask and evaluating on another (discovery) yields poor results - even though the underlying classification
problem is the same. In contrast, when the model is trained with both subtasks in parallel, the accuracy increases.
based learners. While physico-chemical properties
can be calculated from the nucleotide sequences on
a di- or trimer basis, many useful epigenomic features
rely on data sources and experiments that are hard to
come by. For example adding a histone modification
signal to a machine learning model will most likely
increase the performance. But the source of histone
marks is also a ChIP-seq experiment, thus limiting the
real-world impact of the computational method, since
both the output’s and the input’s data relies on wet-
lab techniques that require considerable resources to
carry them out.
In this study, we design methods for generating
out-of-distribution (OOD) samples that can be com-
bined with novel data sources i.e. for multi-modal
network training and also improving uni-modal nu-
cleotide sequence learners. We mainly rely on do-
main knowledge to generate an inconsistent input
which does not exist in the real world so the TFs
shall not bind to them. The generation is suitable
for multi-modal networks where we mix binding and
non-binding inputs by keeping one or more modalities
untouched while the other is replaced from a differ-
ent class sample. We challenge also uni-modal mod-
els by shuffling their binding sequences and present
them as non-binding sequences. We investigate mul-
tiple approaches of mixing samples for multi-modal
as well as uni-modal networks. The presented mix-
ing and shuffling mechanism destroy the underlying
structure of binding site so it can be a reliable source
for model evaluations.
Interestingly, we find that despite additional data
sources or novel architectures, generated OOD sam-
ples are a significant challenge even for state-of-the-
art networks (Han et al., 2021; Wang et al., 2023).
We note that the algorithms’ performance drops when
evaluated on out-of-distribution samples. Therefore,
these models do not adequately learn the mechanisms
of TFBSs and need to be improved by training on
OOD data.
To address this problem, we propose novel train-
ing strategies to enhance the reliability of the mod-
els on OOD samples. We leverage the generated data
while ensuring that we evaluate on OOD samples the
model was not trained on. Moreover, we present a
multi-task training method that can be used to en-
hance model performance via examples where the
ground truth is only partially available. The proposed
methods enhance the neural networks representation
on out-of-distribution samples without any extra cost,
and in certain cases the in-distribution performance is
significantly improved.
Our main findings and the overall pipeline for in-
creasing robustness by training with additional OOD
entities is shown in Fig. 1. The source code is avail-
able at https://github.com/szegedai/tf ood robustness.
2 RELATED WORK
2.1 Connection with Interpretability
and Robustness
Most TFBS prediction models prioritize interpretabil-
ity through methods like saliency maps, gradient vi-
sualizations, or motif extraction. Robustness is es-
sential in approaches like these, which are often ap-
plied for personal genome diagnostics or epigenetic
analysis where models must handle OOD inputs and
explain their predictions effectively. However, these
approaches often neglect robustness, leading to over-
confident predictions based on statistical noise or ir-
relevant features.
Towards More Robust Transcription Factor Binding Site Classifiers Using Out-of-Distribution Data
41

Adversarial examples highlight this issue by ex-
posing how easily models can be misled, undermin-
ing interpretability. Training with adversarial or mod-
ified examples has been shown to improve robustness
and align learned features with human understanding
(Geirhos et al., 2019). Our prior work (Pap. and
Megyeri., 2022) demonstrated that TFBS prediction
models perform poorly with modified sequences, in
which binding sites remain intact but nucleotides are
either cut from or appended to the sides. Augment-
ing training data with shifted or cropped sequences
improved both robustness and performance. We note
that domain generalization techniques and transfer
learning can also improve robustness.
Here, we focus on TFBS classifiers’ sensitivity
to OOD samples which can also characterize the
learner’s internal features. We incorporated OOD
data into regular training approaches designed specif-
ically for the two TFBS tasks defined in Section 3.
These approaches are applicable to different tasks
too, and help increase performance and robustness
through using OOD examples in training.
2.2 Generalization to Other Cell Lines
A key goal in DNA-protein binding detection is gen-
eralizing well to new cell types, as experimental data
for many TF/cell type pairs are unavailable. Success-
ful predictions across cell-types, as demonstrated in
Virtual ChIP-seq (Karimzadeh and Hoffman, 2022),
increase confidence in the meaningful biological char-
acteristics captured. However, performance varies
significantly between TFs and cell types. Mod-
els could fail to recognize critical statistical signals
(Schreiber et al., 2020). Improvements can be made
to nucleotide-based learners by augmenting training
with point mutations (Lee et al., 2024). Integrat-
ing additional data modalities like physico-chemical
descriptors and epigenomic features is advantageous.
(Chiu et al., 2023; Wu et al., 2024).
In this study, we show that additional features of
multi-modal inputs alone are not sufficient to detect
OOD samples, and incorporating OOD samples into
the training process provides an orthogonal improve-
ment. Moreover, we demonstrate that the OOD data
can be generated from ID data so it has no extra costs.
2.3 Classification with Convolutional
Networks
Many TFBS detection models rely on convolutional
neural networks (CNNs) with 1–3 layers, designed
to learn binding motifs from one-hot encoded se-
quences as a binary classification task. Shallow archi-
tectures enable effective motif extraction, as deeper
networks tend to fragment binding information over
layers (Koo and Eddy, 2019). DeepSEA (Zhou and
Troyanskaya, 2015) tackles the prediction of multi-
ple TFs, which is more challenging. More recently,
MAResNet (Han et al., 2021) addresses the two issues
detailed above. By applying the well-known architec-
tural choices developed for computer vision tasks, a
ResNet-like architecture is employed for binding site
prediction. In addition, pre-training is used, resulting
in the learners having information about multiple TFs
and this gives better performance when evaluated on
downstream tasks.
In our study, we evaluate both ResNet-like net-
works and CNNs with attention mechanisms. Both
types show a performance drop when evaluated on
OOD data, and are successfully improved with the
proposed training methods.
3 EXPERIMENTAL SETUP
Let us first introduce our notations and metrics. We
will train neural networks for binary classification
problems to recognize TFBSs. An example is given
as (x, y), where x ∈ R
d
and y ∈ {0, 1}. d denotes the
dimension of the input. A binary classifier network
is denoted by f
θ
: R
d
→ R
1
, using the following cost
function:
min
θ
L( f ) = y·log f (x)+(1−y)·(log(1− f (x))) (1)
To measure the performance of a trained network,
we will use accuracy, AUC, and AUPR. Accuracy is
defined as the ratio of the correctly classified inputs
in a given set. Area Under the ROC Curve(AUC)
measures the area under the true positive rate vs.
false positive rate curve, while AUPR measures the
area under the precision vs. recall curve. Accu-
racy will only change when the prediction exceeds the
0.5 threshold. In contrast, AUC and AUPRC can re-
flect smaller improvements with a more appropriate
threshold.
3.1 Datasets
Here, we first describe the uni-modal dataset and then
the multi-modal dataset. In each, we define the OOD
data generation methods and their notations.
For uni-modal experiments, we use the ENCODE
DREAM5 Transcription Factor Binding Site Chal-
lenge data. In (Zeng et al., 2016) the authors de-
fined two tasks, namely discovery and occupancy (de-
noted as Occ and Disc, respectively) for 422 and 690
ICAART 2025 - 17th International Conference on Agents and Artificial Intelligence
42

binding prediction tasks. Stated briefly, in the discov-
ery task, the positive entities are sequences contain-
ing binding sites based on ChIP-seq peaks, whereas
the negative ones are di-nucleotide shuffled versions
of the positive ones. Occupancy defines the positive
class similarly, but the negative sequences are chosen
based on them containing the binding motif pattern
but having no experimentally verified peaks. Gener-
ally speaking, occupancy proves to be a more difficult
task for the typical convnets with nucleotide sequence
inputs. Here, we define two scenarios for training
and evaluation. First, we simulate unseen OOD data
via training on occupancy and testing on discovery or
vice-versa. We will refer to the in-distribution data
as D
in
and use D
out
for the unseen data distribution.
In addition to this, we also take the union of the oc-
cupancy and discovery data denoted as D
all
and train
models over the joint distribution. During evaluation,
we will focus on the observed performance for the fol-
lowing three TFs: MAFK, SP1 and ZNF147. These
three were selected in order to represent a different
level of difficulty in terms of the classification task.
We refer to this as D
3
. Note that we also train mod-
els over a larger set with 422 TFs using both the oc-
cupancy and the discovery data which is referred as
D
422
.
For multi-modal experiments, we use the dataset
employed to train HAMPLE (Wang et al., 2023). The
goal of the classification task in this case is to pre-
dict the correct cell type for which a given TF binds
the input sequence. The model relies on three differ-
ent modalities, namely nucleotide sequence, physico-
chemical and 3D DNA properties (in brief: ‘shape’),
and histone modifications. The nucleotide sequence
belonging to a given bin does not vary regardless of
cell type (or class label). The physico-chemical prop-
erties are calculated from the nucleotide sequence, so
the same is true. Histone marks, however is different.
Unlike in uni-modal data, there are no different
variants of the same problem. Therefore, we define
different strategies to generate OOD samples. Sam-
ple generation is done by manipulating the histone
modifications of the entities. That is, without disrupt-
ing nucleotide or shape information, the signal values
belonging to the histone marks were rendered inde-
pendently of the correct class label for the OOD en-
tities. In this way, the model could not rely on the
most informative modality for cell type classification.
Several methods were developed to create the out-of-
distribution entities’ histone values. As mentioned
above, in each case the histone features belonging to
an augmented example were misleading: they contain
no information about the correct label. First, the his-
tone values were substituted with randomly generated
Table 1: Settings for the used ResNet configurations.
Depth Width Number of parameters
10 1 0.028M
2 0.061M
16 1 0.093M
2 0.109M
10 6.152M
22 1 0.126M
2 0.159M
28 1 0.192M
2 0.239M
10 12.612M
34 1 0.369M
2 0.499M
40 1 0.629M
2 0.759M
10 19.073M
numbers from a normal distribution N characterized
by the mean and the standard deviation of the origi-
nal histone values – denoted as D
N
. Second, the hi-
stone values were substituted using all of the other
possible histone values which do not belong to the
given entity’s class. In other words, given a sample,
its histone values were changed to a random one be-
longing to a different class – denoted as D
bs
- batch-
switch. Third, a subset of the original in-distribution
batch (e.g., 25%) was duplicated and then its histone
values were shuffled only using the values present in
that current batch. During shuffling the only criteria
was that the new, out-of-distribution histone proper-
ties must belong to a class different from the origi-
nal one – denoted as D
mixin
. Creating OOD entities
using a normal distribution allows for an almost in-
finite number of combinations. However, D
N
might
be the least similar to the ID examples. Using D
bs
makes use of the whole dataset, by switching the his-
tone modification in the currently generated batch, en-
suring many new OOD example creations. For D
mixin
the number of possible combinations is limited by the
present batch’s size and the class distribution in it.
Still, we hypothesize that the mixin strategy forces
the learner to exploit nucleotide and shape informa-
tion quite severely.
3.2 Uni-Modal Experiments
We define two training strategies over different sets of
data: single-task and multi-task training. For multi-
task training, we define two subtypes based on the
amount of data that is used. Next, these are intro-
duced in more detail.
In (Shen et al., 2021; Han et al., 2021), it
is demonstrated that ResNet-based models can effi-
ciently learn binding motifs for multiple transcription
factors (TFs) simultaneously. In our setup, we will
Towards More Robust Transcription Factor Binding Site Classifiers Using Out-of-Distribution Data
43

use wide residual architecture (Zagoruyko and Ko-
modakis, 2016) with 1D convolutions. Since we will
train models on different dataset sizes, thus we need to
adjust the network sizes for the given dataset. There-
fore, we explore network depth from 10 layers up to
40 and width parameters of {1, 2, 10}. This will allow
us to examine the performance of different training
strategies as a function of network capacity. The list
of all network configurations and their parameter val-
ues are presented in Table 1.
All residual networks are trained for 10
5
iterations
using the SGD optimizer with a learning rate of 10
−1
and weight decay of 0.0005. For networks with a
width of {1, 2} the learning rate is reduced according
to the cyclic learning rate schedule (Smith, 2017) with
a cycle length of 10
4
iterations. In the case of net-
works with a width of 10, we observed poor conver-
gence so we used cosine schedule (Loshchilov and
Hutter, 2017) with a single cycle during their train-
ing. The batch size was set to 192 and 3376 for D
3
and D
422
datasets, respectively. During training, the
weights are evaluated at every 1000th step using a val-
idation set and the checkpoint which provides the best
validation accuracy is saved.
Single-Task Training. As baselines, we train resid-
ual networks for single transcription factor binding
site prediction using one type of negative example,
derived either from occupancy or discovery. The
training objective is binary cross-entropy. During the
evaluation phase, we might make predictions on occu-
pancy or discovery regardless of what the model was
trained on. We define two evaluation scenarios: s-in
and s-out for single-task models. In s-in, all mod-
els are evaluated on the corresponding test set a.k.a.
D
in
(i.e., occupancy models are only used for occu-
pancy data and discovery models are exclusively used
for discovery test sets). This evaluation will show the
performance of the models under ideal circumstances,
which is unrealistic. In s-out - a more realistic evalua-
tion - the models are challenged via cross-task evalu-
ations using D
out
(i.e., occupancy models are used to
predict discovery and vice versa).
Multi-Task Training. To improve OOD detection
performance, we train multi-task networks using three
unions of the datasets. MD means the union of all
TF datasets but only using negative samples from the
discovery task. Similarly, MO means the network is
trained on all of the available TFs using the occupancy
datasets only. The union of MO and MD is referred to
as ALL. For model training, multi-task models used
the binary cross-entropy loss function. However, we
excluded the loss of those output neurons where the
ground truth is undefined (i.e., when predicting on
MAFK input, Sp1 output labels are not present). Sim-
ilar to single-TF model evaluations, we also define m-
out and m-in. In m-in, a combination of the models
is taken so that they are only used on in-distribution
data. The m-out case is the reverse, and will reflect
the results with cross-evaluations (i.e., the models are
adversely used). For the networks which are trained
on the ALL set we can only evaluate in-distribution
performance that is referred to as all. This can repre-
sent an upper bound of what we might expect from an
outlier detection method.
3.3 Multi-Modal Experiments
f
ID
is defined as the original, baseline HAMPLE
model, as proposed in (Wang et al., 2023). The ro-
bust learners are introduced next. First, f
N
relies on a
Gaussian distribution to augment histone properties.
(Similarly to how D
N
is generated.) Second, an out-
of-distribution batch was created in addition to the
original in-distribution batch – denoted as f
bs
- batch-
switch. In the former the histone values were sub-
stituted using all of the other possible histone values
which do not belong to the given entity’s class. In
other words, given a sample, its histone values were
changed to a randomly selected one belonging to a
different class, for all classes. This OOD batch has
four times more examples then the ID one. During
loss calculation the ID and OOD losses were multi-
plied by 0.8 and 0.2 before summation, respectively.
(The multiplication values were established empiri-
cally.) Third, a subset of the original in-distribution
batch (e.g., 25%) was duplicated and then its histone
values were shuffled only using the values present in
that current batch. During shuffling the only criteria
was that the new, out-of-distribution histone proper-
ties must belong to a class different from the original
one – denoted as f
mixin
. Creating OOD entities us-
ing a normal distribution allows for an almost infinite
number of combinations. However, f
N
might be the
least similar to the ID examples. Using D
bs
makes
use of the whole dataset, by switching the histone
modification in the currently generated batch, ensur-
ing many new OOD example creations. For D
mixin
the number of possible combinations is limited by
the present batch’s size and the class distribution in
it. On the other hand, we hypothesize that the mixin
strategy forces the learner to exploit nucleotide and
shape information most stringently. For evaluation
three datasets are used. D
in
is the original test set and
is used for measuring the models’ performance for
solving the base TFBS detection task. For evaluating
robustness the original test set is duplicated (so that
there are twice the number of examples when com-
pared with D
in
) and the histone properties are mod-
ICAART 2025 - 17th International Conference on Agents and Artificial Intelligence
44
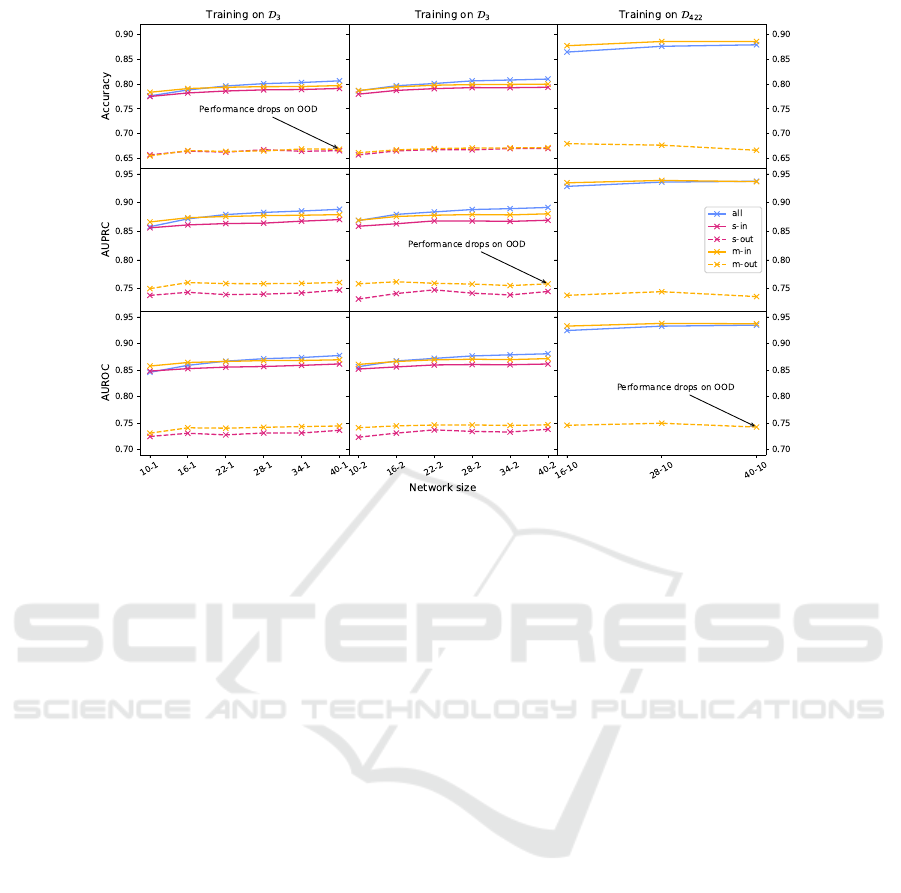
Figure 2: Accuracy, AUPRC, and AUROC scores are displayed as the function of network size and single(s-in/out) vs multi-
task training(m-in/out,all) for in and out distribution when applicable. Performance drops when models are evaluated on OOD
data for both multi-task as well as single-task models irrespective of the network sizes. A small but consistent improvement
is visible for m-out in the case of AUPRC and AUROC metrics. In addition to the improved OOD detection capability, multi-
task networks(m-in and all) outperform single-task networks for the in-distribution task, especially for larger networks.
ified in the newly created part. D
N
includes entities
where the values of the histone marks are replaced
from a Normal distribution while preserving the in-
herent statistical properties. For D
sub
the duplicated
part’s histone features are substituted with values be-
longing to a different class, selected randomly. Dur-
ing the robustness test, the unmodified part is labelled
as 1 and the modified as 0. Then using an Area Under
the Receiver Operating Characteristic Curve the clas-
sifiers’ ability to separate the two parts is measured.
10% of the training set was split for validation.
Early stopping with a criteria of 5 epochs was em-
ployed, the maximum number of epochs was 25. For
training the binary cross-entropy loss with the ADAM
optimizer was used with a learning rate of 5 × 10
−4
.
The learning rate was reduced by 0.5 is no improve-
ments were observed in terms of the validation loss
for 3 epochs during training. The batch size was 64.
For the robust training runs the number of convolu-
tional neurons was multiplied by four. This resulted
in the increase of the number of trainable parameters
from 167,049 to 377,121. When using the increased
size with f
ID
, overfitting became an issue. Although
in a few cases the larger ID networks performed bet-
ter than the original ones - both on ID and robustness
tasks. We use the higher measurement in our compa-
risons for each case.
4 RESULTS
Single- and Multi-Task ResNets. Accuracy,
AUPRC, and AUROC scores are displayed as the
function of network size and single vs multi-task
training in Fig. 2. We also show the in and out dis-
tribution performance of the models when applicable.
Our first observation is that the models’ perfor-
mance drops by 0.1 in all the metrics when they are
evaluated on OOD data for both multi-task as well as
single-task models irrespective of the network sizes.
This highlights the risk of the current practice of train-
ing and testing on a single distribution, one might not
see the model learned specific features that only apply
to the training distribution and does not allow general
inspection of the TF’s behavior.
The all curves in Fig. 2 show that when the same
architecture is trained in conjunction with a merged
dataset (e.g., both tasks’ entities are included during
fitting), the network can solve the task reliably, and
the combined training also provides a small boost in
performance. A small but consistent improvement is
visible for m-out in the case of AUPRC and AUROC
metrics. However, training on all the data results in
a significantly better performance which shows the
need for more appropriate training algorithms and
OOD data generation methods.
Towards More Robust Transcription Factor Binding Site Classifiers Using Out-of-Distribution Data
45
In addition to the improved OOD detection ca-
pability, multi-task networks (m-in and all) outper-
form single-task networks for the in-distribution task,
especially for larger networks. Further increasing
the number of tasks and training a single model that
can recognize 422 TFs on D
422
boosts the perfor-
mance by a large margin with respect to all the met-
rics. This highlights that multi-task training pro-
vides better representations. We note that even though
we had to scale up the networks to millions of pa-
rameters to provide competitive performance relative
to single-task models, it is still more compute- and
parameter-efficient than training 422 individual net-
works. Based on Table 1, a single-task network on
D
422
with an architecture of WRN-40-1 would have
2 × 422 × 0.629M= 530.876M parameters while a
WRN-40-10 multi-task network with 19.073M pro-
vides better results.
For Histone Modifications with HAMPLE. In the
following the results for ID and OOD performance
of the models based on the HAMPLE architecture
are shown. The first two columns of 2 show the TF
and training method. f
ID
or baseline means the origi-
nal normal/unmodified training setting as described in
(Wang et al., 2023). The D
in
column shows the AU-
ROC performance on the test set for the classification
task. The third and fourth columns show the robust-
ness of the networks measured in AUROC when the
task is the separation of the unmodified and the mod-
ified examples based on the test sets. D
N
or random
normal means that the histone values were changed
to random samples from a Gaussian distribution, for
all classes. The D
sub
substitute randomly method con-
sidered the original class labels during substitution, so
that the new replacement values are from a different
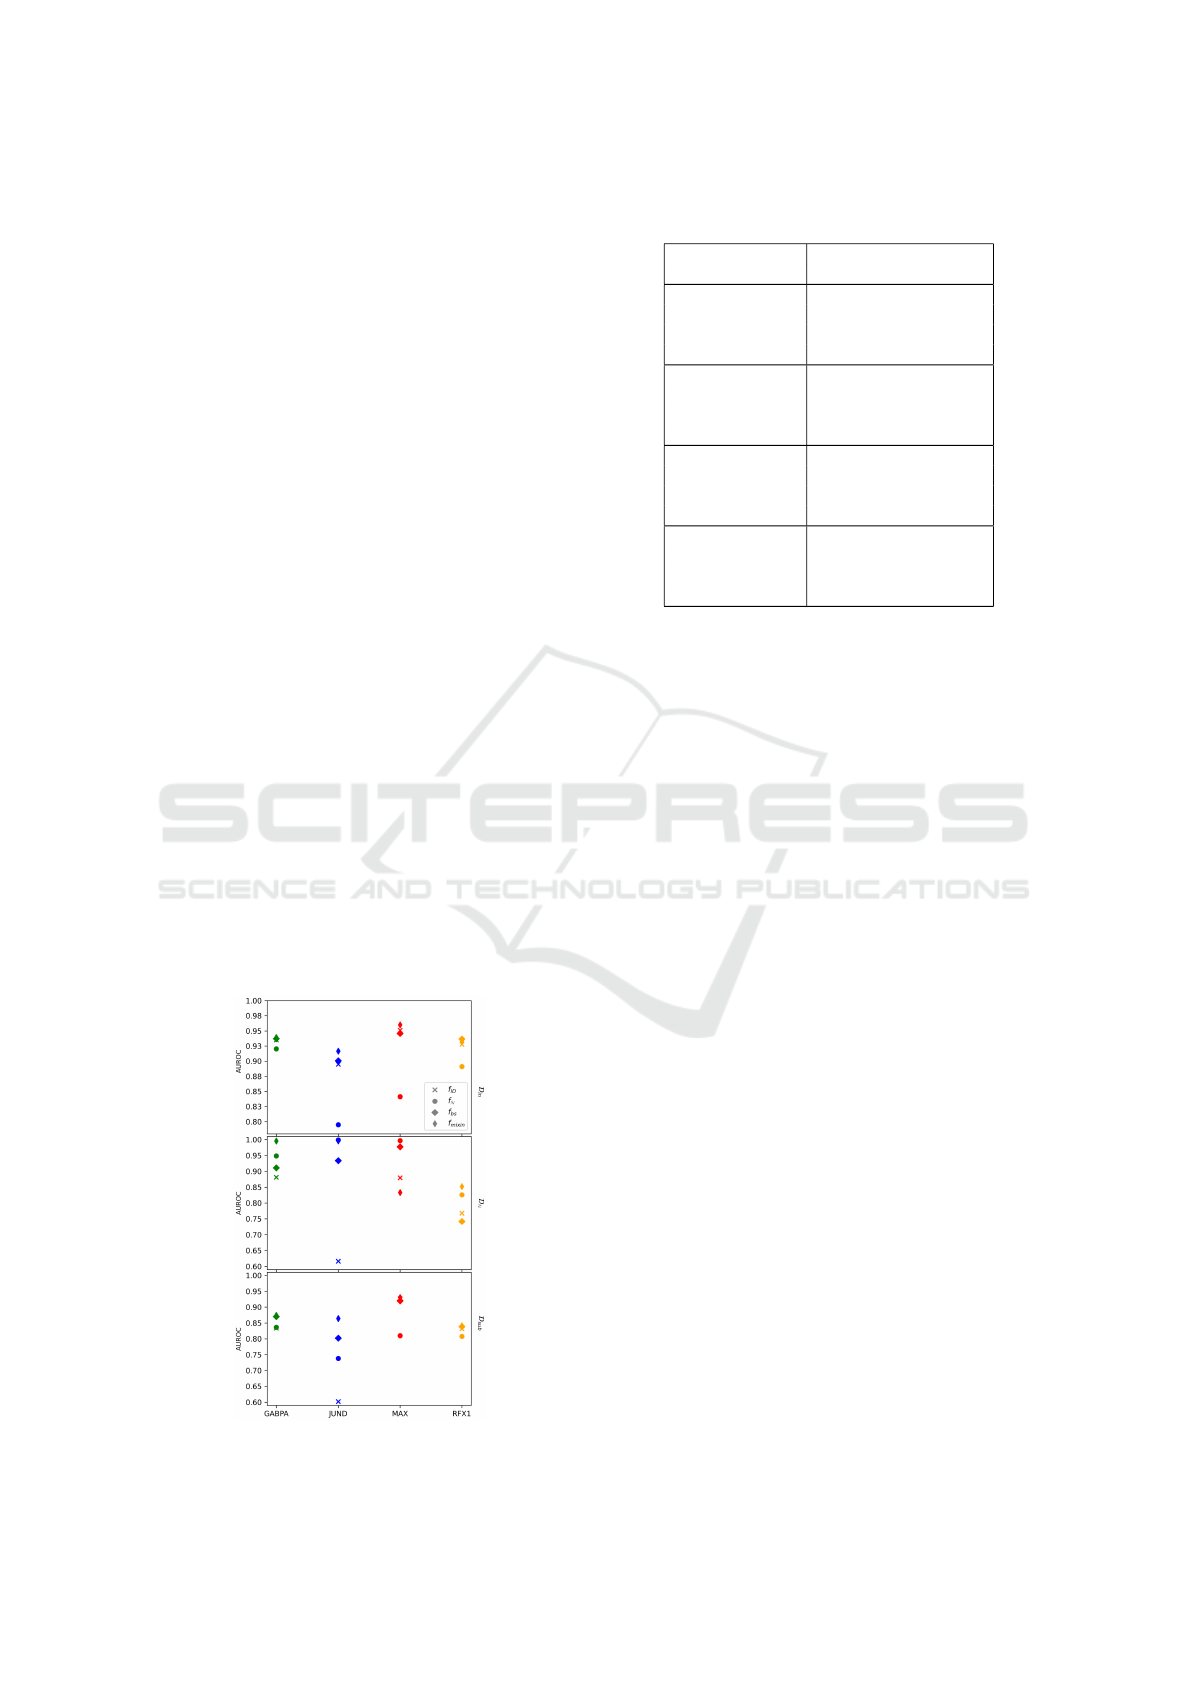
Figure 3: HAMPLE evaluated on ID and OOD examples.
Table 2: Test performance and robustness when evaluating
on ID and OOD sets for multi-modal networks.
TF Network
Evaluation data
D
in
D
N
D
sub
GABPA
f
ID
0.9352 0.8811 0.8337
f
N
0.9204 0.9487 0.8366
f
bs
0.9372 0.9109 0.8704
f
mixin
0.9391 0.9957 0.8740
JUND
f
ID
0.8949 0.6163 0.6022
f
N
0.7951 0.9988 0.7382
f
bs
0.9006 0.9336 0.8023
f
mixin
0.9167 0.9962 0.8639
MAX
f
ID
0.9510 0.8796 0.9265
f
N
0.8414 0.9970 0.8099
f
bs
0.9458 0.9777 0.9200
f
mixin
0.9601 0.8333 0.9306
RFX5
f
ID
0.9278 0.7679 0.8313
f
N
0.8910 0.8258 0.8079
f
bs
0.9365 0.7418 0.8385
f
mixin
0.9336 0.8522 0.8417
class in every case - similarly to f
bs
.
For the TF GABPA in Table 2 the original net-
work’s test AUROC is 0.9352. Although the train-
ing method f
N
fails to outperform this, both the f
mixin
’mixin’ and f
bs
’batchswitch’ networks achieve more
(0.9391 and 0.9372, respectively). In terms of ro-
bustness all modified learners manage to handle out-
of-distribution entities better (AUROC for f
mixin
is
0.9957 compared to the 0.8811 observed for the f
ID
unmodified net - which results in a difference of
0.1146). Regarding D
sub
evaluation, f
mixin
and f
bs
was
better by about 0.04 AUROC score compared to f
ID
and f
N
learners. In summary f
mixin
training proves to
be the best in all categories. For MAX and JUND
f
mixin
shows better performance in D
in
and D
sub
eval-
uation, meanwhile for random histone marks the f
N
training augmentation produced almost 100% separa-
tion. For RFX1 the f
bs
network outperform in terms
of ID, but f
mixin
is observed to be more robust.
Fig. 3 shows evaluations using the different sets
(top: D
in
: in-distribution test AUROC, middle: D
sub
:
ID-OOD separation AUROC for histone values gener-
ated from a Gaussian distribution, bottom: D
sub
: ID-
OOD separation AUROC for histone values sampled
from a class different from the original). In terms of
ID performance, the addition of extra OOD entities
while increasing the network size provides better AU-
ROC values. Moreover when measuring robustness,
in almost every case the ID learner is outperformed
by the augmented models.
5 CONCLUSIONS
The performance of DL for predicting transcription
factor binding sites has improved in recent years.
ICAART 2025 - 17th International Conference on Agents and Artificial Intelligence
46

However, the issue of robustness and generalization
ability to handle OOD entities deserves further in-
vestigation. Here we provide two examples for two
classification tasks, where the models fail to general-
ize well to OOD samples. We propose robust train-
ing techniques where we introduce OOD entities dur-
ing fitting, and train multi-task models. We find that
the performance with OOD examples increases. Fu-
ture directions include examining other OOD scenar-
ios and making comparisons with different adversar-
ial training settings.
ACKNOWLEDGEMENTS
The authors were supported by the
´
UNKP-23-4 New
National Excellence Program of the Ministry for Cul-
ture and Innovation from the source of the National
Research, Development and Innovation fund. Both
authors contributed equally. GP was also supported
by Project no TKP2021-NVA-09, implemented with
the support provided by the Ministry of Culture and
Innovation of Hungary from the National Research,
Development and Innovation Fund, financed under
the TKP2021-NVA funding scheme.
REFERENCES
Alipanahi, B., Delong, A., Weirauch, M. T., and Frey, B. J.
(2015). Predicting the sequence specificities of dna-
and rna-binding proteins by deep learning. Nature
Biotechnology, 33(8):831–838.
Chiu, T.-P., Rao, S., and Rohs, R. (2023). Physicochemi-
cal models of protein–dna binding with standard and
modified base pairs. Proceedings of the National
Academy of Sciences, 120(4):e2205796120.
Geirhos, R., Rubisch, P., Michaelis, C., Bethge, M., Wich-
mann, F. A., and Brendel, W. (2019). Imagenet-
trained CNNs are biased towards texture; increasing
shape bias improves accuracy and robustness. In In-
ternational Conference on Learning Representations.
Han, K., Shen, L.-C., Zhu, Y.-H., Xu, J., Song, J., and Yu,
D.-J. (2021). MAResNet: predicting transcription fac-
tor binding sites by combining multi-scale bottom-up
and top-down attention and residual network. Brief-
ings in Bioinformatics, 23(1):bbab445.
Hassanzadeh, H. and Wang, M. D. (2016). Deeperbind:
Enhancing prediction of sequence specificities of dna
binding proteins. In 2016 IEEE International Con-
ference on Bioinformatics and Biomedicine (BIBM),
pages 178–183, Los Alamitos, CA, USA. IEEE Com-
puter Society.
Karimzadeh, M. and Hoffman, M. M. (2022). Virtual
chip-seq: predicting transcription factor binding by
learning from the transcriptome. Genome Biology,
23(1):126.
Koo, P. K. and Eddy, S. R. (2019). Representation learning
of genomic sequence motifs with convolutional neural
networks. PLOS Computational Biology, 15(12):1–
17.
Lambert, M., Jambon, S., Depauw, S., and David-
Cordonnier, M.-H. (2018). Targeting transcription
factors for cancer treatment. Molecules, 23(6).
Lee, H., Ozbulak, U., Park, H., Depuydt, S., De Neve, W.,
and Vankerschaver, J. (2024). Assessing the reliabil-
ity of point mutation as data augmentation for deep
learning with genomic data. BMC Bioinformatics,
25(1):170.
Loshchilov, I. and Hutter, F. (2017). SGDR: Stochastic
gradient descent with warm restarts. In International
Conference on Learning Representations.
Pap., G. and Megyeri., I. (2022). Translational robustness of
neural networks trained for transcription factor bind-
ing site classification. In Proceedings of the 14th In-
ternational Conference on Agents and Artificial Intel-
ligence - Volume 3: ICAART, pages 39–45. INSTICC,
SciTePress.
Park, S., Koh, Y., Jeon, H., Kim, H., Yeo, Y., and Kang, J.
(2020). Enhancing the interpretability of transcription
factor binding site prediction using attention mecha-
nism. Scientific Reports, 10(1):13413.
Qin, Q. and Feng, J. (2017). Imputation for transcrip-
tion factor binding predictions based on deep learning.
PLOS Computational Biology, 13(2):1–20.
Schreiber, J., Singh, R., Bilmes, J., and Noble, W. S. (2020).
A pitfall for machine learning methods aiming to pre-
dict across cell types. Genome Biology, 21(1):282.
Shen, L.-C., Liu, Y., Song, J., and Yu, D.-J. (2021). SARes-
Net: self-attention residual network for predicting
DNA-protein binding. Briefings in Bioinformatics,
22(5):bbab101.
Smith, L. N. (2017). Cyclical learning rates for training
neural networks. In 2017 IEEE Winter Conference on
Applications of Computer Vision (WACV), pages 464–
472.
Vishnoi, K., Viswakarma, N., Rana, A., and Rana, B.
(2020). Transcription factors in cancer development
and therapy. Cancers (Basel), 12(8).
Wang, Z., Xiong, S., Yu, Y., Zhou, J., and Zhang, Y. (2023).
HAMPLE: deciphering TF-DNA binding mechanism
in different cellular environments by characterizing
higher-order nucleotide dependency. Bioinformatics,
39(5):btad299.
Wu, X., Hou, W., Zhao, Z., Huang, L., Sheng, N., Yang,
Q., Zhang, S., and Wang, Y. (2024). Mmgat: a graph
attention network framework for atac-seq motifs find-
ing. BMC Bioinformatics, 25(1):158.
Zagoruyko, S. and Komodakis, N. (2016). Wide residual
networks. In Wilson, R. C., Hancock, E. R., and
Smith, W. A. P., editors, Proceedings of the British
Machine Vision Conference 2016, BMVC 2016, York,
UK, September 19-22, 2016. BMVA Press.
Zeng, H., Edwards, M., Liu, G., and Gifford, D. (2016).
Convolutional neural network architectures for pre-
dicting dna–protein binding. Bioinformatics, 32:i121–
i127.
Zhou, J. and Troyanskaya, O. G. (2015). Predicting ef-
fects of noncoding variants with deep learning–based
sequence model. Nature Methods, 12(10):931–934.
Towards More Robust Transcription Factor Binding Site Classifiers Using Out-of-Distribution Data
47
