Navigating Dimensionality Through State Machines in Automotive
System Validation
Laurenz Adolph
1 a
, Barbara Sch
¨
utt
1 b
, David Kraus
2 c
and Eric Sax
2 d
1
FZI Research Center for Information Technology, Karlsruhe, Germany
2
Institut f
¨
ur Technik der Informationsverarbeitung, Karlsruhe Institute of Technology, Karlsruhe, Germany
Keywords:
State Machine, Scenario-Based Testing, Automated Driving.
Abstract:
The increasing automation of vehicles is resulting in the integration of more extensive in-vehicle sensor sys-
tems, electronic control units, and software. Additionally, vehicle-to-everything communication is seen as
an opportunity to extend automated driving capabilities through information from a source outside the ego
vehicle. However, the validation and verification of automated driving functions already pose a challenge
due to the number of possible scenarios that can occur for a driving function, which makes it difficult to
achieve comprehensive test coverage. Currently, the establishment of Safety Of The Intended Functional-
ity (SOTIF) mandates the implementation of scenario-based testing. The introduction of additional external
systems through vehicle-to-everything further complicates the problem and increases the scenario space. In
this paper, a methodology based on state charts is proposed for modeling the interaction with external systems,
which may remain as black boxes. This approach leverages the testability and coverage analysis inherent in
state charts by combining them with scenario-based testing. The overall objective is to reduce the space of
scenarios necessary for testing a networked driving function and to streamline validation and verification. The
utilization of this approach is demonstrated using a simulated, signalized intersection with a roadside unit that
detects vulnerable road users.
1 INTRODUCTION
In the fast-changing field of automated and au-
tonomous driving, the development of Advanced
Driver Assistance Systems (ADAS) and Autonomous
Driving (AD) capabilities is being driven by the
emergence of connected systems that use Vehicle-to-
Everything (V2X) communication and edge applica-
tions. The implementation of higher levels of automa-
tion necessitates the secure detection of other traffic
participants. Additional information from sensors ex-
ternal to the vehicle expands the field of view, thereby
aiding in the detection of objects within various situ-
ations. The challenging verification and validation of
this cyber-physical ADAS and AD systems, includ-
ing sensors, is a significant bottleneck in achieving
Level 4 automation. Degrees of freedom of Level 4
automation make it impractical to comprehensively
model and test the entire driving function across all
a
https://orcid.org/0009-0006-1454-9792
b
https://orcid.org/0000-0001-8439-0322
c
https://orcid.org/0009-0006-7329-7070
d
https://orcid.org/0000-0003-2567-2340
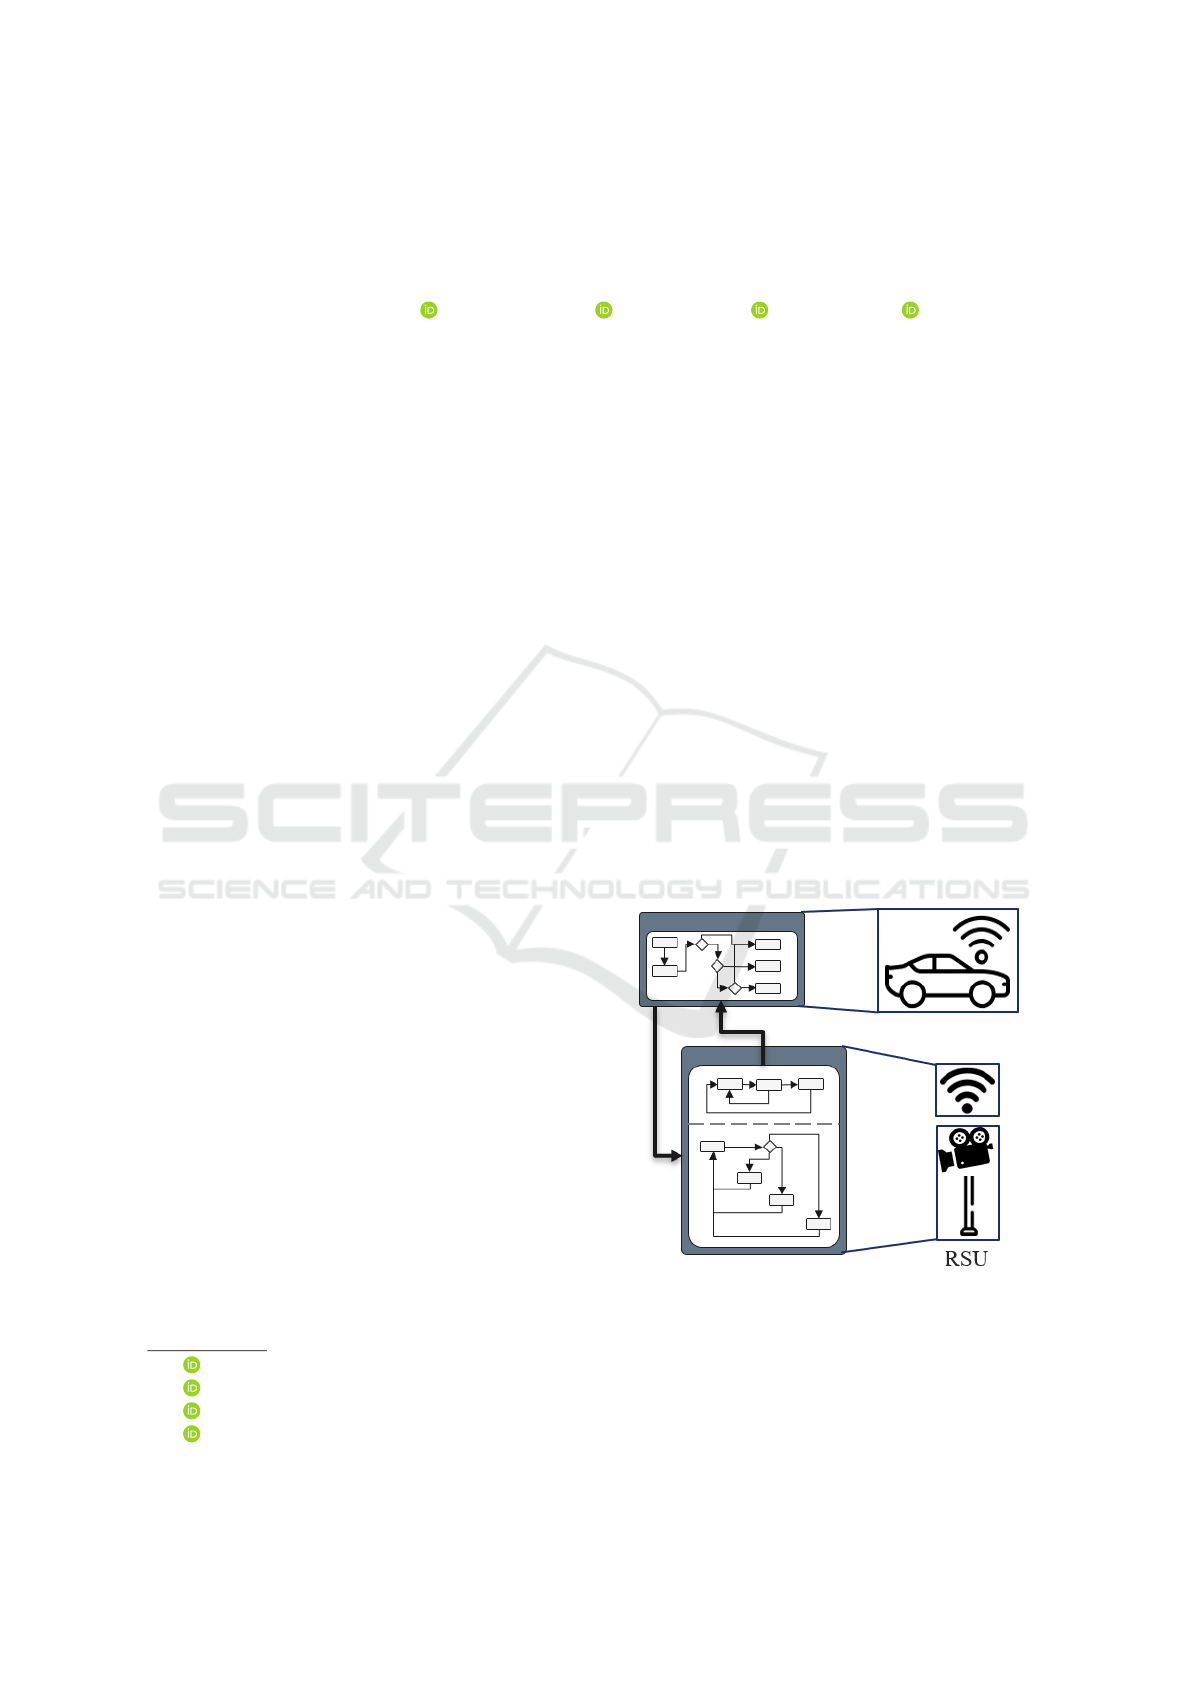
Figure 1: Connected systems as state charts.
possible situations and systems. Scenario-based ap-
proaches have been introduced to address this chal-
lenge, exemplified by concepts such as SOTIF.
Despite the usefulness of scenario-based testing,
the number of potential scenarios the driving func-
Adolph, L., Schütt, B., Kraus, D. and Sax, E.
Navigating Dimensionality Through State Machines in Automotive System Validation.
DOI: 10.5220/0013080800003896
In Proceedings of the 13th International Conference on Model-Based Software and Systems Engineering (MODELSWARD 2025), pages 125-132
ISBN: 978-989-758-729-0; ISSN: 2184-4348
Copyright © 2025 by Paper published under CC license (CC BY-NC-ND 4.0)
125

tion could encounter remains an unsolved challenge,
as exhaustive testing on the road is implausible, as
shown by Wachenfeld and Winner (2015). Kaur et al.
(2020) use formal methods for the validation of V2X
systems. These, however, require specialized knowl-
edge about all involved systems and are not easily ap-
plicable to the predominant, scenario-based approach
to Validation and Verification (V&V). Breaking down
the cyber-physical system into smaller, more man-
ageable subsystems allows for more effective test-
ing. This approach requires comprehensive model-
ing of the interactions of connected sensor systems,
even when only partial knowledge of third-party sys-
tems like Roadside Units (RSUs) is available. This
work proposes modeling the interaction of the driving
function with other systems in a connected environ-
ment using state machines. The methodology aims
to provide a more efficient and manageable path for
V&V by focusing on the states and interactions of in-
dividual subsystems rather than attempting to model
the entire function. A combined approach, integrating
state charts with scenario-based methods, provides a
solution to reconcile testability with dimensionality.
State charts can facilitate the selection, search, and
definition of specific test cases for the cyber-physical
system. The methodology will be examined using a
simulated intersection with a modeled RSU locating
other traffic participants and a traffic light broadcast-
ing its current state as shown in fig. 1.
Contribution: The paper aims to contribute to the on-
going discourse on the advancement of V&V and test-
ing methodologies in the context of connected auto-
motive technologies by:
• Modeling interactions in connected driving func-
tions using state charts
• Utilization of state chart combinatorics for test
coverage analysis
• Leveraging the testability of state charts to derive
test cases for the V&V of highly automated driv-
ing
2 STATE OF THE ART
2.1 Scenario-Based Testing and SOTIF
To ensure that the function under development meets
the Dynamic Driving Task (DDT) in the specified
Operational Design Domain (ODD) for a high level
of automation, a structured and thoughtful process
for V&V is required. In Europe, the most common
approach to V&V is SOTIF, which is described in
general through ISO 26262 ISO (2018) and in an
automotive-specific context through ISO/PAS 21448
ISO (2022). It aims to describe the interaction be-
tween a vehicle and other participants through sce-
narios. These scenarios may include multiple snap-
shots of dynamic events, environmental information,
or other relevant details. The PEGASUS-Project Con-
sortium (2023) proposes a standardized method of de-
scribing scenarios. The scenario-based method de-
signs and organizes potential situations the vehicle
may encounter during operation into scenarios. This
condensed set of scenarios can then be tested regard-
ing the DDT. One alternative is to field-test the au-
tomated driving function to determine if a vehicle
can meet the requirements of the DDT in a particu-
lar ODD. This, however, requires an already existing
driving function and 2-11 billion kilometers of real-
world testing, as proposed by Wachenfeld and Winner
(2015) and Kalra and Paddock (2016).
Although there are several definitions for the
terms scene and scenario, this paper follows the def-
initions of Ulbrich et al. (2015). Their definition
states that a scene is delineated in terms of all static
and dynamic elements and the associated properties
at a specific point in time. Consequently, a sce-
nario is defined as a temporal sequence of successive
scenes. As stated by M. Wood et al. (2019, pp. 83),
scenario-based testing represents a suitable approach
to supplementing the distance-based approach of real-
world driving, thus reducing the necessary mileage.
The scenario-based approach encompasses a series of
techniques and strategies employed during the testing
process, which collectively facilitate the acquisition
of information and the formulation of statements re-
garding the quality of the system under test.
The identification of novel scenarios is a manda-
tory step in the process of defining new test cases de-
signed to assess the safety of an automated driving
system. It is suggested by several standards and reg-
ulations ISO (2022) as well as the Council of the Eu-
ropean Union (2018, 2022). There are many ways
to generate, extract, or find new or critical scenarios
from recorded data or already existing scenarios, ac-
cording to Sch
¨
utt et al. (2023).
Scenario coverage addresses the question of
whether concrete scenarios are suitable for represent-
ing logical scenarios, and it is a crucial component
when exploring scenarios. One approach to measure
scenario coverage was proposed by OpenSCENARIO
DSL ASAM OpenSCENARIO (2020) and Foretellix
Foretellix (2020), is related to the grid search and de-
fines concrete scenarios stepwise for a given param-
eter range as in an approach by Mori et al. (2022).
In this work, the authors state that grids with defined
step sizes may overlook critical scenarios even when
MODELSWARD 2025 - 13th International Conference on Model-Based Software and Systems Engineering
126

approaching a relatively narrow coverage.
Hauer et al. (2019) proposed an alternative ap-
proach that compares the problem of Have all sce-
nario types been tested? with the Coupon Collector’s
Problem (CCP), a model from probability theory and
related to the urn problem. The idea behind this is that
there is a given set of N coupons, baseball cards, or
similar items, and a collector has to draw each type of
card with a constant probability. There are two varia-
tions of the classical CCP: (1) the probability differs
for some types (e.g., McDonald’s Monopoly); or (2)
the number of types N is not known a priori. Unfortu-
nately, no analytical solution for the CCP exists Hauer
et al. (2019), and Monte Carlo approaches are used.
2.2 State Chart
State charts can be used to model objects and their
possible states and transitions. They are formalized
using the Unified Modeling Language (UML) as de-
scribed by Kecher (2007). State charts provide the
ability to model conditional transitions, orthogonal
states, and the behavior of the state machine at run-
time for modeling the behavior of networked systems.
In contrast to Markov and Hidden Markov models,
where transitions between states occur with a given
probability and the transition depends only on the cur-
rent state of the model, the transitions of state charts
are event-based and can contain guards that act as
conditional transitions. This allows interactions be-
tween subsystems to be modeled without the need to
model each subsystem in its entirety. State machines
are easy to test because of their finite states and de-
terministic behavior and can therefore be a way of
reducing the effort required to V&V interconnected
systems.
2.3 Current State V2X
In order to enable seamless V2X communication, ve-
hicles, RSU, and other devices that need to inter-
act within the V2X domain have to agree on a well-
defined communication standard. Within the range
of possibilities, 3GPP Cellular V2X (C-V2X) - a
cellular based application based on 4G/5G by Euro-
pean Telecommunications Standards Institute (ETSI)
(2013) and WLAN IEEE 802.11p by 802 (2010) (also
Dedicated Short Range Communication (DSRC)),
which uses wireless transmission via 5.9 GHz - are
the two main emerging technologies used for V2X
communication. To increase widespread adaption,
ventures from the EU, the USA, and China are being
made to define the contents of V2X data transmission.
As for the EU, the European Telecommunications
Standards Institute (ETSI) has made efforts defining a
European communication standard, which is based on
either IEEE 802.11p or C-V2X. ETSI also defined a
V2X application called Cooperative Awareness Mes-
sage (CAM), which includes message contents and
sending trigger conditions. However, the USA and
China are adapting the Basic Safety Message (BSM)
as introduced by the Society of Automotive Engineers
(SAE). Through the versatility of V2X-networks, se-
curity becomes a major concern. With the integration
of external devices, new, unforeseen attack patterns
can emerge. To protect the intended AD functional-
ities as well as ensuring data-privacy, efficient mea-
sures after Start of Production (SOP) have to be es-
tablished. This can be achieved through the extension
of Threat Analysis and Risk Assessment (TARA) as
shown in Grimm et al. (2023), where a more efficient
incident handling is proposed. Through a triage pro-
cess, cybersecurity incidents are prioritized based on
the risk assessment of the attack incident.
2.4 Current State RSU
In the development of Intelligent Transportation Sys-
tems (ITS), a RSU is an integral component of the
communication network. As they can be placed care-
fully at places needed, they support a more effi-
cient exchange of information between vehicles and
smart infrastructure, as shown by Maglogiannis et al.
(2022). Current research mostly focuses on opti-
mizing the deployment of RSU, e.g., how they can
be evenly distributed in an area while still be cost-
efficient. A graph based approximation algorithm
which includes different RSU types based on static
as well as mobile RSU attached to public transporta-
tion and specifically controlled vehicles to assist was
introduced for Vehicular Ad Hoc Network (VANET)
systems.
3 CONCEPT
The development of driving functions that incorpo-
rate different subsystems, such as external sensors,
presents a challenge due to the increase in the com-
binatorics of different states of interaction between
those systems, also known as the curse of dimension-
ality. In addition to an increase in dimensionality, the
information from systems outside the ego vehicle can
be unreliable, incomplete, or unknown. Connected
systems for AD can involve RSUs and traffic lights,
for which complete system information may not be
available. The necessary V&V of such networked
systems represents a bottleneck. Modeling the flow
Navigating Dimensionality Through State Machines in Automotive System Validation
127
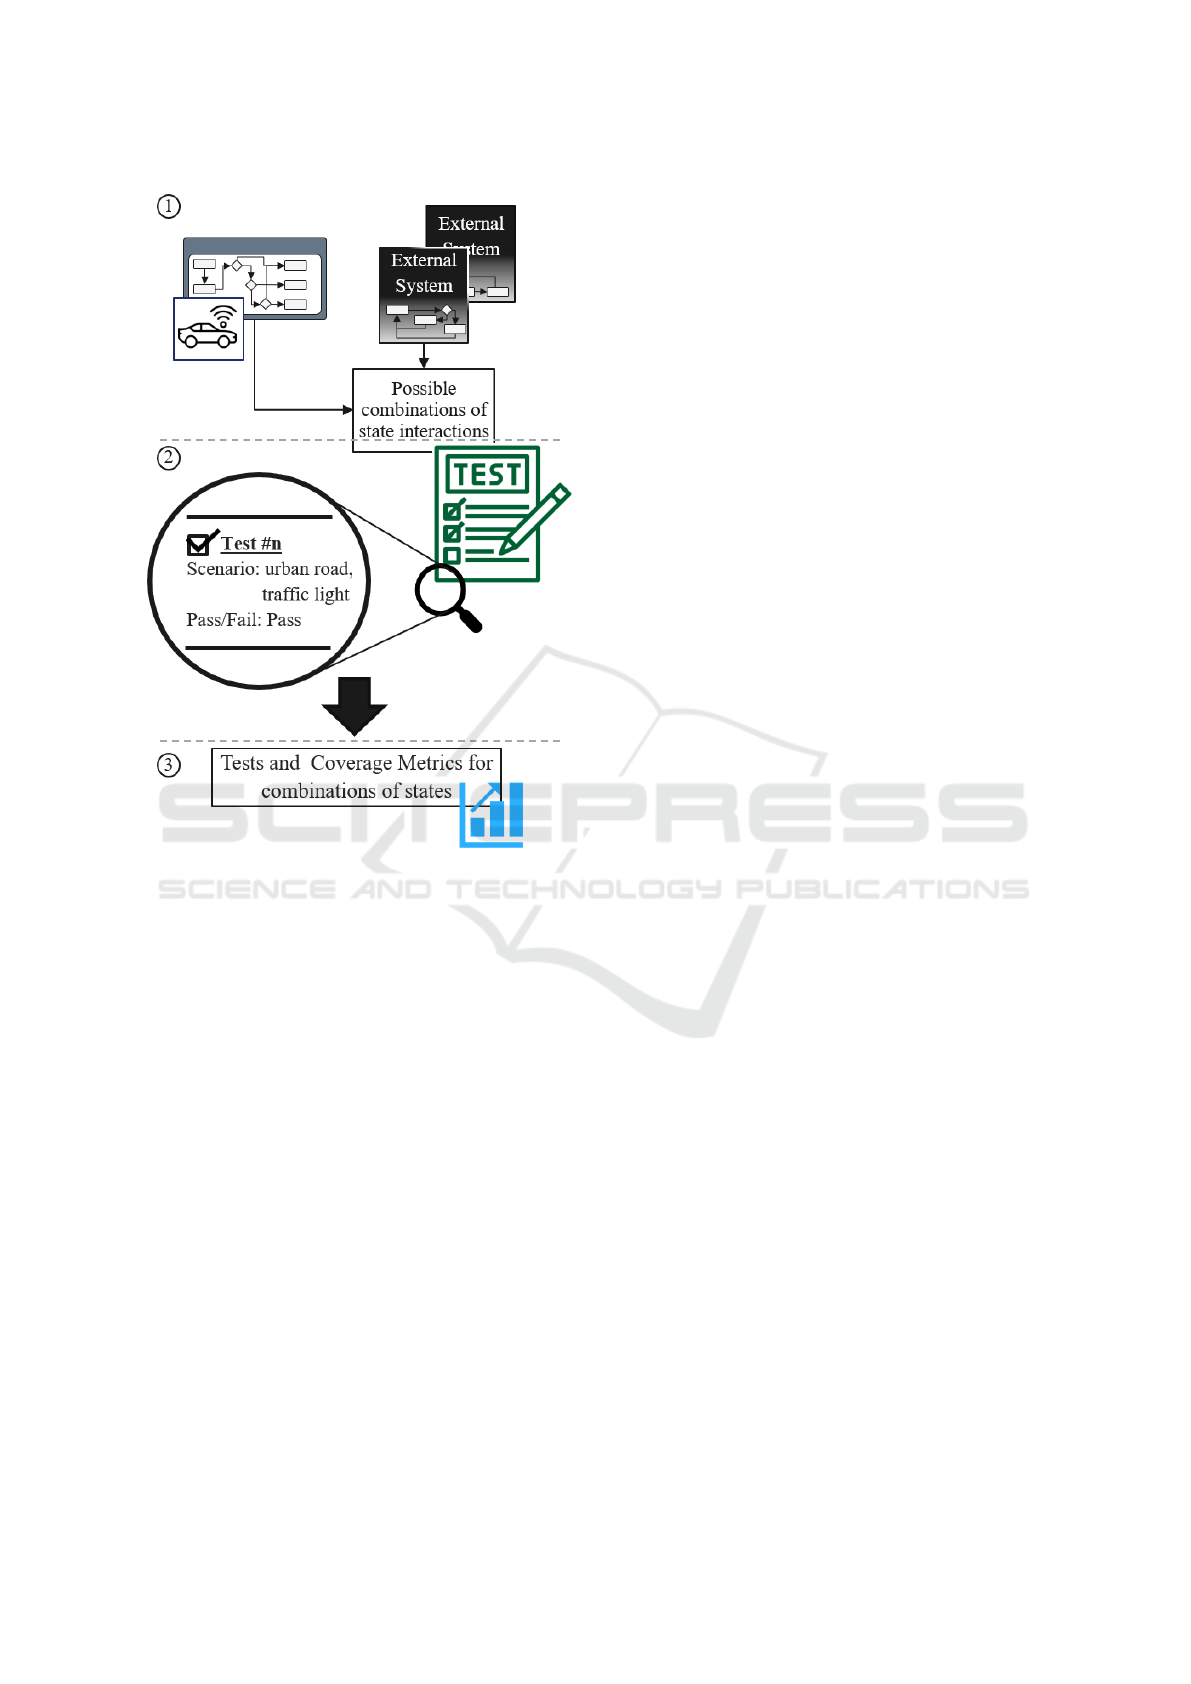
Figure 2: Concept of the state chart method.
of information from external systems and focusing
on the possible states of the overall driving function
in these interactions mitigates some of the challenges
posed by the dimensionality of the system. The pro-
posed method consists of three distinct steps, shown
as circled numbers in fig. 2.
Step 1 - All involved systems, internal and external
to the vehicle and relevant to the driving function un-
der development, are identified. Only the interaction
between the vehicle and these subsystems is specified
and modeled. This allows developers to model exter-
nal systems as a gray box, see fig. 2, where the in-
teraction with the vehicle system is known and can
be defined, but the inner workings of each external
system can be simplified or omitted. Focusing on the
flow of information and not the individual messages
between subsystems enables developers to incorpo-
rate different external systems. State charts offer a
way to model the interaction in such systems. The
flow of information and the different states of interac-
tion for each subsystem can be defined by excluding
states that are not directly involved in the interaction
between an external system and the ego vehicle. As
transitions between states in a state chart are based on
events and the previous state, it is possible to place
greater emphasis on the flow of information, rather
than the overall system itself. Through this modeling,
all possible interactions between subsystems and their
corresponding states in each state chart can be identi-
fied. This enables the definition of the scenario space
of potential driving scenarios. Verifying and validat-
ing such systems requires assessing the interactions
between subsystems and their impact on the driving
function as a whole.
Step 2 - By linking the established scenario-based
testing with the interaction between subsystems,
modeled as state charts, the V&V effort can be re-
duced due to the simplification of external systems
and the focus on the effect of different information
on the ego vehicle. Even with these reduced sub-
system models, the overall number of possible state
combinations is increasing rapidly. State charts are
capable of being subjected to unit tests thereby allow-
ing for their verification. Scenarios and the involved
states for each subsystem can be linked to those unit
tests. This enables tests that focus only on the in-
volved states for a given scenario. Conversely, it is
possible to identify the states of the individual subsys-
tems in observed scenarios and link them with corre-
sponding unit tests.
Step 3 - This allows the space of possible state com-
binations to be tested and statements to be made
whether enough of these scenarios have been ob-
served to pass this test. This approach can be ex-
tended with new edge devices and other services, as
only the interaction between the new edge system and
the existing state chart must be defined and modeled.
The structuring of the interaction in connected
systems with state charts and the linking of those state
charts to scenarios enables the straightforward def-
inition of driving function tests. The specification
of which states are involved in a given scenario al-
lows the coverage of test cases and scenarios to be
determined. By focusing on the flow of information
and the interaction between subsystems, new systems
can be modeled as gray boxes and incorporated with
relative ease. This work demonstrates the proposed
methodology using an inner-city crossing equipped
with a RSU which is capable of detecting and locat-
ing other Vulnerable Road Users (VRUs) and a traf-
fic light broadcasting its current state. Two exem-
plary use cases are analyzed in this work. In use case
1, observed driving scenarios are matched to possi-
ble combinations of different states of the model, al-
lowing for the identification of areas with inadequate
scenario coverage. In use case 2, the testability of
state charts is demonstrated using unit tests. For this
use case, the occurrence of jaywalking pedestrians
MODELSWARD 2025 - 13th International Conference on Model-Based Software and Systems Engineering
128
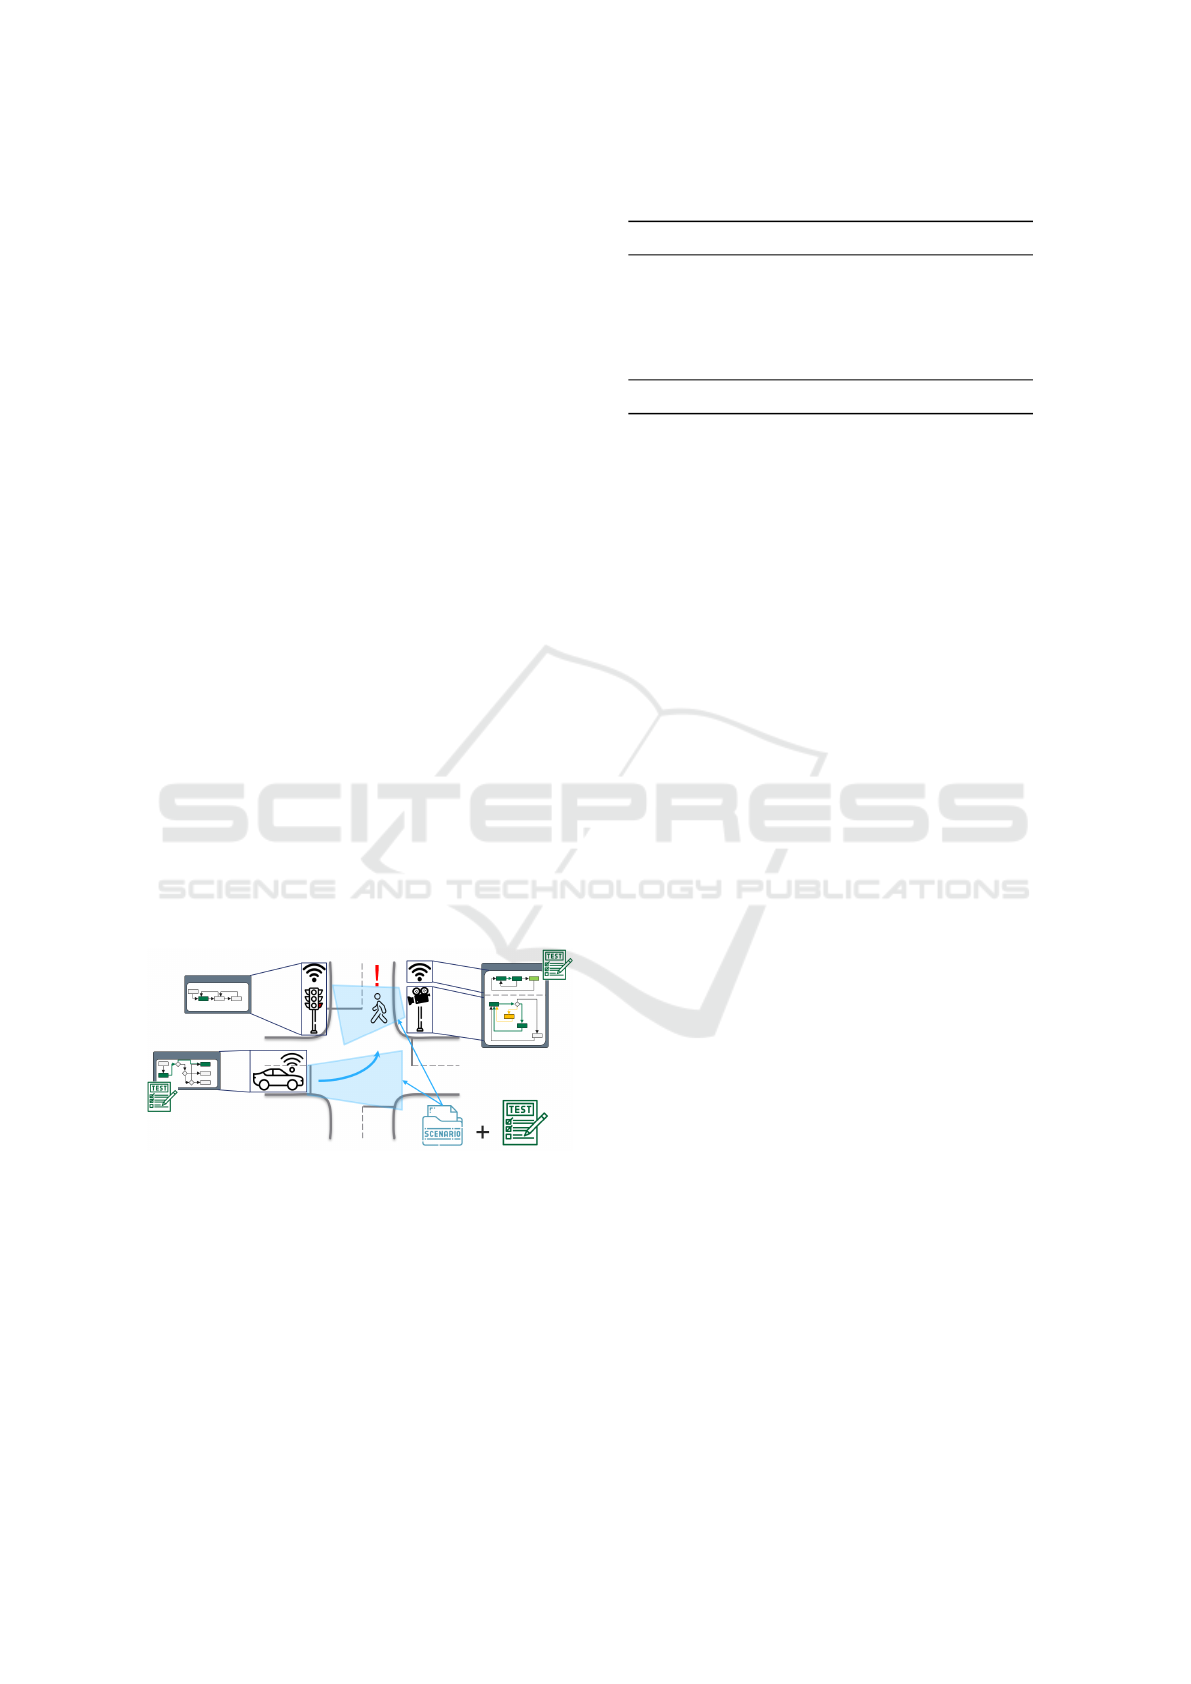
and the RSU-based detection and localization of these
pedestrians are formulated as tests and evaluated us-
ing the recorded scenarios.
4 IMPLEMENTATION
The objective of this implementation is to demon-
strate the testability and reduction in dimensionality
for connected systems using the proposed state chart-
based method. To this end, an exemplary traffic sit-
uation at an intersection is examined. An automated
vehicle requests information from external sensors in
the form of a RSU detecting VRUs. Additional in-
formation about the traffic situation is provided by
a traffic light broadcasting its current signal state.
The three simplified subsystems (vehicle, VRU, traf-
fic light) are simulated as interacting and exchanging
information. A structured approach using scenario
mapping and unit tests is employed to manage this
dimensionality. Scenario mapping can provide infor-
mation about the coverage of system behavior. Unit
testing helps verify that each component works cor-
rectly in isolation. The applicability of the proposed
approach will be evaluated using scenarios generated
in the CARLA simulation platform. The scenarios
take place at a signalized four-way junction and en-
compass the trajectories of all participants, including
vehicles and pedestrians. This approach allows for a
detailed analysis of how different elements interact in
a controlled traffic environment. Figure 3 shows the
involved systems.
Figure 3: Connected Systems as state charts with unit tests.
4.1 Scenario Generation
Scenarios for this implementation were generated us-
ing CARLA 0.9.15. A two-lane, four-way junction
equipped with pedestrian crossings and traffic signals
was chosen as the location of the scenario generation.
CARLAs inbuilt traffic generation was used to spawn
vehicles of various types and pedestrians. Among the
pedestrians, some were designated as jaywalkers, in-
troducing unpredictable elements into the simulation
Table 1: Hyperparameters for scenario generation.
Hyperparameter Value
CARLA Version v0.9.15
Number of vehicles 80
Number of pedestrians 50
Percentage of jaywalking pedestrians 10%
Number of generated Scenarios 27,709
Number of ego-scenarios 9,484
(see Table 1). Each scenario describes the trajectory
of an object (vehicle or pedestrian) within the inter-
section. All participants active at a given time are in-
cluded in a scenario, providing a comprehensive view
of the interactions occurring for the whole intersec-
tion. Of these, 9,484 scenarios specifically involve
cars navigating through the intersection. The specific
routes taken by these cars were identified. They serve
as ego vehicles and are the main actors in each sce-
nario. The RSU information and traffic signal states
are emulated with regard to these 9,484 ego vehicles.
4.2 Roadside Unit and Traffic Light
Modeling
Both systems serve to add dimensionality to the sim-
ulation, and therefore are emulated in a highly sim-
plified manner using the following assumptions. It
is assumed that the RSU can see and potentially de-
tect all VRUs at the crossing. The RSU is assumed
to either detect a VRUs presence or locate it in the
next step. The detection process is emulated with a
90% success rate, while the localization of the ex-
act position is emulated with a 75% success rate af-
ter detecting the VRUs. These values have been cho-
sen intentionally low in order to reduce the necessary
number of scenarios needed to evaluate the approach.
Figure 4 in the appendix illustrates the detailed state
chart of the localization. Furthermore, traffic signals
are emulated as continuously broadcasting their state
to all participants. Signals relevant to the ego vehi-
cle are extracted and time-based state changes (e.g.,
from red to green) are considered. This simplification
facilitates the evaluation process while still providing
meaningful insights into performance of a system.
4.3 State Charts for Each Subsystem
The interaction between the RSU, the ego vehicle and
the traffic lights are modeled as state charts. Figure 4
shows the individual state charts and each individual
subsystem is described in the text below.
Vehicle State Chart - The vehicle approaches the
Navigating Dimensionality Through State Machines in Automotive System Validation
129
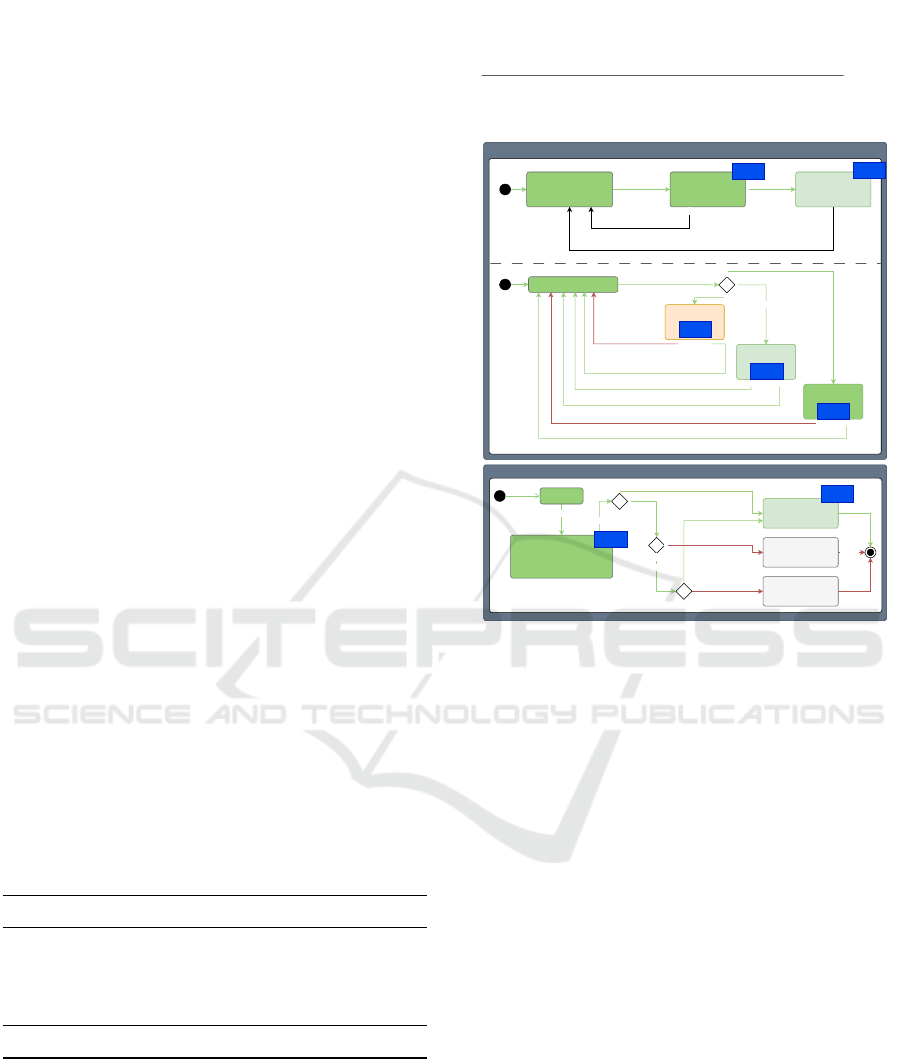
crossing and communicates with the RSU requesting
information about all participants at the crossing. In-
formation about the state of the traffic light is con-
stantly received. Depending on the return signal and
the success of the transmission between RSU and the
vehicle, different driving profiles, e.g., free turn, cau-
tion or stop, are selected.
RSU State Chart - The functionality of the RSU is
divided into two parts: localization and Vehicle-to-
Infrastructure (V2I) communication. The behavior of
the RSU is modeled as follows: when a VRU enters
the area of the RSU, the RSU detects the VRU with
an unknown percentage of accuracy. The RSU can
then either locate the position of the VRU or fail to
do so. When the RSU is requested for information,
it sends the current list of detected and/or localized
VRUs to the approaching vehicle. The transmission
can be successful or unsuccessful.
Traffic Light State Chart - The traffic light is mod-
eled as a simple transition between each signal phase
and can be easily specified in more detail by adding
the times of each individual phase. In this example,
it is assumed that the signal state is constantly broad-
casted and received by the vehicle.
Table 2 shows the number of possible states in
each subsystem and the total number of possible state
combinations for the whole system. The RSU Com-
munication can transmit each state either successfully
or unsuccessfully, resulting in seven possible out-
comes of this communication. Scenarios span mul-
tiple seconds, leading to multiple states of the traffic
light occurring during a scenario. Therefore, the tran-
sitions between states of the traffic light are consid-
ered as additional, combined states of the state chart.
They are red to yellow, yellow to red, yellow to green
and green to yellow.
Table 2: Combination of possible states.
Subsystem number of possible states
Traffic light 4 + 4
RSU localization 3
RSU communication 3 · 2 + 1
vehicle 5
overall number of states 840
5 EVALUATION
5.1 Use Case 1: Coverage Analysis
Use case 1 describes a situation in which observations
are made at an intersection (here, simulated scenarios)
Road-Side Unit (RSU)
Vehicle
approach
V2X-idle
Car at intersection
entry /raise request RSU info
leaving
Possible VRU present
entry driving profile 1
leaving
VRU located
entry driving profile 3
leaving
No VRU present
entry driving profile 2
Localisation
V2I Communication
VRU detected
Localisation idle
entry VRU present = False
entry VRU located = False
VRU located
VRU left
VRU detected
entry
VRU present = True
VRU left
VRU located
entry
VRU located = True
1
2
request RSU info
V2I Communication Idle
[VRU present== True]
[VRU located== True]
sending no VRU
1 2
sending VRU
present
1 2
sending VRU
location
sending /raise RSU info /transmission succesful = True
1 2
1
2
else
3
sending /raise RSU info /transmission succesful = False
sending /raise RSU info /transmission succesful = True
sending /raise RSU info /transmission succesful = False
sending /raise RSU info
/transmission succesful = True
[transmission succesful == True]
[transmission succesful == False]
1
2
[VRU present == True]
[VRU present == False]
[VRU located == True]
[VRU located == False]
1
2
RSU info
sending /raise RSU info /transmission succesful = False
2511
scenarios
1563
VRU
2149
VRU
6423
VRU
8572 VRU
6423
VRU
9484
scenarios
Unit test 1 | 2,053 Scenarios: VRU detected = True, VRU located = False, transmission successful = True
Unit test 2 | 96 Scenarios: VRU detected = True, VRU located = False, transmission successful = False
Unit test 3 | 41 Scenarios: VRU detected = False, VRU located = False, transmission successful = False
Unit test 4 | 321 Scenarios: VRU detected = True, VRU located = True, transmission successful = False
Unit test 4.1 | 121 Scenarios: VRU detected = True, VRU located = True, transmission successful = False,
traffic light = Red --> Green
Unit test 4.2 | 6 Scenarios: VRU detected = True, VRU located = True, transmission successful = False,
traffic light = Green--> Red
Figure 4: Statecharts of each subsystem.
to determine whether scenarios covering all relevant
combinations of states of the connected driving func-
tion are observed. To achieve this, the states of the
traffic light and the transitions between the traffic light
phases were considered for all ego scenarios. Figure 5
shows the number of scenarios that match the respec-
tive combinations. The color of the bars indicate the
state of the traffic light, as well as the first number
in the numerical code below the bars. Additionally,
the states VRU detected, VRU located and transmis-
sion successful, see Figure 4, are noted in boolean no-
tation in the numerical code below the bars. In this
reduced space of possibilities, there are 64 combina-
tions. Figure 5 clearly shows that the observed scenar-
ios are not equally distributed across all combinations
of states. Rather than observing scenarios until all
possible combinations of states are sufficiently cov-
ered, it is necessary to inquire into specific combina-
tions of states. As an example, it would be beneficial
to determine the circumstances under which uncertain
information prompts the driving function to transition
to driving profile 1 in the state chart. The objective
is to identify the instances when and how often these
situations occur and the system states involved. For
example, when the states are traffic light = red, VRU
detected = True, VRU located = False, and transmis-
MODELSWARD 2025 - 13th International Conference on Model-Based Software and Systems Engineering
130

sion successful = True (numerical code 0-1-0-1 in fig-
ure 5), it leads to Driving Profile 1. This scenario, in
which information about present but not exactly lo-
cated VRUs is transmitted successfully, occurs 567
times. Conversely, the issue where a VRU is detected
but the transmission fails is rare, occurring only 24
times in the observed scenarios (numerical code 0-1-
0-0). These combinations of VRU states do not occur
at all while the traffic light is yellow and only occur
in small numbers while the traffic light is transitioning
from or to a yellow signal. Although it is possible to
make coverage statements (e.g., more scenarios from
yellow traffic light phases are necessary), it becomes
evident that a more targeted selection of scenarios and
state combinations is necessary.
Figure 5: Coverage of possible state combinations.
5.2 Use Case 2: Test Case Generation
Testing every possible combination of states in a con-
nected, automated system, as shown in fig. 5, is not
feasible. Even with simplified subsystems the possi-
ble combination of states ranges in the hundreds as
shown in table 2. For the interaction modeled in a
set of state charts unit tests can be defined. Figure 3
shows a unit test suite and the corresponding scenario.
For use case 2, the combination of states that lead
to unclear information (Possible VRU present, driving
profile 1) is examined. Observed scenarios can then
be assigned to each of these tests. State chart tools
(Itemis CREATE was employed in this work) were
utilized to identify which states are included within
the scope of the defined tests. This process enables
determining the coverage of interactions defined in
unit tests between these subsystems, see fig. 4. By
allocating scenarios to these tests, statements can be
made about the coverage of the scenarios within the
individual tests. First, a set of four unit tests with state
combinations leading to the vehicle entering driving
profile 1 is defined. All combinations of states leading
to the vehicle state Possible VRU present are covered
by this set. The states of the traffic light do not di-
rectly lead to this state and are not considered for this
use case. Through these tests the number of relevant
states of the state charts for this use case is reduced.
In 2511 of 9484 scenarios selected for the use case
the interaction with the RSU leads to unclear informa-
tion about possible VRUs at the crossing. Unit tests
2, 3, and 4 represent situations where the informa-
tion from the RSU is not conclusive. These scenarios
were observed less frequently than normal RSU be-
havior. If more scenarios are required for testing, the
scenario generation or observation can be guided by
the scenario coverage for each test. The traffic light
and the information it provides do not directly impact
the decision of the ego vehicle to enter different driv-
ing profiles. For unit tests 4.1 and 4.2, the phases
of the traffic light were also considered. A total of
321 scenarios were assigned to unit test 4. Of these,
only six occurred while the traffic light switched from
green to red (for the ego vehicle), while 121 scenar-
ios occurred when the traffic light switched from red
to green. The incorporation of data from subsystems,
such as traffic lights, enables the refinement of unit
tests and facilitates the targeted testing of functions
and the targeted recording of scenarios.
6 CONCLUSION
This paper introduces a novel method for modeling
interactions within connected, automated systems us-
ing state charts, with a particular focus on the flow
of information between the ego-vehicle and external
systems and sensors. The approach integrates state
charts into established scenario-based testing method-
ologies. By combining state charts and their inher-
ent testability with scenario-based testing, it can be
demonstrated that the curse of dimensionality in con-
nected systems can be managed more effectively. The
methodology was explored through two distinct use
cases, demonstrating the capability of the method for
statements on scenario coverage. Use case 1 demon-
strated the underlying issue of scenario coverage for
all possible interactions between connected subsys-
tems. The second use case demonstrated the appli-
cation of unit tests for state charts for interactions and
the mapping of scenarios to these tests. This illus-
trated how the method supports a more targeted val-
idation and verification process. Additionally, it di-
rects data collection efforts within connected systems
to areas with inadequate scenario coverage. Future
work will involve applying this method to real-world
data rather than relying on simulated probabilities for
RSUs, with the aim of further validating and refining
the approach in practical environments.
Navigating Dimensionality Through State Machines in Automotive System Validation
131

ACKNOWLEDGEMENT
The research leading to these results is funded by
the German Federal Ministry for Economic Affairs
and Climate Action within the project “NXT GEN AI
METHODS – Generative Methoden f
¨
ur Perzeption,
Pr
¨
adiktion und Planung”. The authors would like to
thank the consortium for the successful cooperation.
REFERENCES
(2010). IEEE Standard for Information technology– Lo-
cal and metropolitan area networks– Specific require-
ments– Part 11: Wireless LAN Medium Access Con-
trol (MAC) and Physical Layer (PHY) Specifica-
tions Amendment 6: Wireless Access in Vehicu-
lar Environments. IEEE Std 802.11p-2010 (Amend-
ment to IEEE Std 802.11-2007 as amended by IEEE
Std 802.11k-2008, IEEE Std 802.11r-2008, IEEE Std
802.11y-2008, IEEE Std 802.11n-2009, and IEEE Std
802.11w-2009), pages 1–51.
ASAM OpenSCENARIO (2020). ASAM OpenSCE-
NARIO.
Consortium, P. (2023). PEGASUS METHOD-An
Overview. Technical report.
Council of the European Union (2018). Regulation (EU)
no. 2018/858. https://eur-lex.europa.eu/legal-content/
en/TXT/?uri=CELEX%3A32018R0858.
Council of the European Union (2022). Council Regu-
lation (EU) no. 2022/1426. https://eur-lex.europa.
eu/legal-content/EN/TXT/HTML/?uri=CELEX:
32022R1426#d1e41-20-1.
European Telecommunications Standards Institute (ETSI)
(2013). Lte; evolved universal terrestrial radio access
(e-utra) and evolved universal terrestrial radio access
network (e-utran); overall description; stage 2 (3gpp
ts 36.300 version 11.6.0 release 11). ETSI TS 136 300
V11.6.0.
Foretellix (2020). Measurable Scenario Description Lan-
guage Reference.
Grimm, D., Lautenbach, A., Almgren, M., Olovsson, T.,
and Sax, E. (2023). Gap Analysis of ISO/SAE 21434
– Improving the Automotive Cybersecurity Engineer-
ing Life Cycle. In 2023 IEEE 26th International Con-
ference on Intelligent Transportation Systems (ITSC),
pages 1904–1911. ISSN: 2153-0017.
Hauer, F., Schmidt, T., Holzm
¨
uller, B., and Pretschner, A.
(2019). Did we test all scenarios for automated and
autonomous driving systems? In Proc. 22st Int. Conf.
Intell. Transp. Syst. (ITSC), pages 2950–2955.
ISO (2018). ISO 26262-2:2018: Road Vehicles - Functional
safety.
ISO (2022). ISO/PAS 21448:2022(en) Road vehicles —
Safety of the intended functionality.
Kalra, N. and Paddock, S. M. (2016). Driving to safety:
How many miles of driving would it take to demon-
strate autonomous vehicle reliability? Transportation
Research Part A: Policy and Practice, 94:182–193.
Publisher: Elsevier.
Kaur, R., Kim, J., Sokolsky, O., Sarkar, S., Ivanov, R., and
Lee, I. (2020). Towards formalization of wireless ve-
hicular networking. In 2020 IEEE Workshop on De-
sign Automation for CPS and IoT (DESTION), pages
23–31, Sydney, Australia. IEEE.
Kecher, C. (2007). UML 2.0: das umfassende Handbuch ;
[aktuell zum UML-Standard 2.0, alle Diagramme und
Notationselemente, Praxisbeispiele in C# und Java].
Galileo computing. Galileo Press, Bonn, 2., aktual-
isierte und erw. aufl., 1. nachdr edition.
M. Wood et al. (2019). Safety first for automated driving.
Accessed: Jan. 26, 2022.
Maglogiannis, V., Naudts, D., Hadiwardoyo, S., van den
Akker, D., Marquez-Barja, J., and Moerman, I.
(2022). Experimental V2X Evaluation for C-V2X and
ITS-G5 Technologies in a Real-Life Highway Envi-
ronment. IEEE Transactions on Network and Service
Management, 19(2):1521–1538.
Mori, K. T., Liang, X., Elster, L., and Peters, S. (2022).
The inadequacy of discrete scenarios in assessing deep
neural networks. IEEE Access.
Sch
¨
utt, B., Ransiek, J., Braun, T., and Sax, E. (2023). 1001
ways of scenario generation for testing of self-driving
cars: A survey. In 2023 IEEE Intelligent Vehicles Sym-
posium (IV), pages 1–8. IEEE.
Ulbrich, S., Menzel, T., Reschka, A., Schuldt, F., and Mau-
rer, M. (2015). Defining and Substantiating the Terms
Scene, Situation, and Scenario for Automated Driv-
ing. In 2015 IEEE 18th International Conference on
Intelligent Transportation Systems, pages 982–988,
Gran Canaria, Spain. IEEE.
Wachenfeld, W. and Winner, H. (2015). Die Freigabe des
autonomen Fahrens. In Maurer, M., Gerdes, J. C.,
Lenz, B., and Winner, H., editors, Autonomes Fahren,
pages 439–464. Springer Berlin Heidelberg, Berlin,
Heidelberg.
MODELSWARD 2025 - 13th International Conference on Model-Based Software and Systems Engineering
132
