
Electroencephalography Analysis Frameworks for the Driver Fatigue
Problem: A Benchmarking Study
Kemalcan Kucuk, Efe Ismet Yurteri and Beren Semiz
a
Department of Electrical and Electronics Engineering, Koc¸ University, Istanbul, Turkey
Keywords:
Driver Fatigue, Electroencephalography, Channel Selection, Feature Extraction, Classification.
Abstract:
Driver fatigue problem is a major factor contributing to traffic accidents globally, making its analysis and
detection crucial for early prevention. Among various approaches for detecting driver fatigue, electroen-
cephalography (EEG) processing is one of the most widely employed techniques. This study investigates
different feature extraction and machine learning methodologies for detecting driver fatigue using EEG sig-
nals, and provides a comparative performance analysis against existing methods. To that aim, we used a
publicly available dataset collected during a simulated driving task and applied our feature extraction methods
to the concurrently recorded EEG signals. Various features from distinct groups were extracted to serve as
the foundation for subsequent analyses. The 30 channels from the original dataset were individually evaluated
based on the performance of machine learning algorithms trained on each channel, allowing for the selection
of the four most optimal channels. Using these selected channels, the different subsets of extracted features
were then compared based on their accuracy values. For further analysis, the features were ranked using both
ANOVA and Chi-Squared feature selection methods to examine the impact of the number of features on model
performance. Each model was first trained using a standard training-testing split, where the highest-scoring
model was a Support Vector Machine (SVM) achieving a test accuracy of 90.73%. Additionally, using a
Leave-One-Out Cross-Validation (LOOCV) approach, the highest performing model was found to be the k-
Nearest Neighbors (K-NN) classifier with an average test accuracy of 70.45%. The analyses and comparisons
presented in this study may serve as a basis for developing real-time applications and for further in-depth
investigations.
1 INTRODUCTION
Driver fatigue is commonly characterized by a state of
reduced physical and cognitive alertness and is recog-
nized as a major contributor to traffic accidents. It
impairs the individual’s ability to accurately perceive
and respond to stimuli, thereby compromising driv-
ing performance and increasing the risk of accidents
(Lal and Craig, 2001; May and Baldwin, 2009; Con-
nor et al., 2002; Philip et al., 2005). The condition is
amplified by various factors such as prolonged driv-
ing durations, inadequate rest, and monotonous road
conditions (May and Baldwin, 2009). In addition to
the countermeasures taken by the drivers, efforts to
mitigate the risks associated with driver fatigue span
across multiple disciplines. These approaches range
from vehicle and road monitoring systems—such as
collision avoidance and lane departure warning sys-
tems—to driver monitoring systems that utilize vari-
a
https://orcid.org/0000-0002-7544-5974
ous physiological signals to infer the driver’s level of
fatigue.
The most common types of physiology-based de-
tection mechanisms include heart rate monitoring,
blood pressure monitoring, electroencephalography
(EEG) processing, facial landmarking, eye-tracking,
head-posture estimation and respiration estimation
(N
ˇ
emcov
´
a et al., 2021). These detection methods typ-
ically rely on preprocessing the signal data via differ-
ent techniques, extracting features from the data, and
utilizing varying modelling techniques to make infer-
ences about the driver. Recently, machine learning
and deep learning models have become predominant
among these detection methods, as they offer robust
and adaptable pipelines that can be applied across di-
verse scenarios.
Among the aforementioned methods, EEG sig-
nals have been utilized in various applications as they
directly reflect the brain activity and functionality.
These applications range from diagnosing neurode-
Kucuk, K., Yurteri, E. I. and Semiz, B.
Electroencephalography Analysis Frameworks for the Driver Fatigue Problem: A Benchmarking Study.
DOI: 10.5220/0013086900003911
Paper published under CC license (CC BY-NC-ND 4.0)
In Proceedings of the 18th International Joint Conference on Biomedical Engineering Systems and Technologies (BIOSTEC 2025) - Volume 1, pages 829-836
ISBN: 978-989-758-731-3; ISSN: 2184-4305
Proceedings Copyright © 2025 by SCITEPRESS – Science and Technology Publications, Lda.
829

generative diseases to developing brain-computer in-
terfaces (BCIs) (Singh and Krishnan, 2023). Clinical
neuroscience heavily relies on the assessment and di-
agnosis of brain disorders using EEG signal analysis.
The purpose of EEG is to identify irregular brain ac-
tivity patterns linked to a range of neurological con-
ditions, including epilepsy, Alzheimer’s disease, and
sleep disorders. By analyzing EEG signals, clinicians
can detect distinct patterns—such as the slowing of
brain waves or the presence of epileptic spikes—that
are indicative of specific neurological disorders. Ad-
ditionally, EEG is valuable for monitoring disease
progression and evaluating the effectiveness of ther-
apeutic interventions.
EEG signals are increasingly employed in every-
day contexts to monitor cognitive states, particularly
attention levels, in diverse scenarios such as educa-
tional settings and driving environments. In driv-
ing, EEG provides real-time neurophysiological feed-
back on a driver’s cognitive load, enabling the de-
tection of mental states associated with distraction
or fatigue. This capability is crucial for developing
driver-assistance systems that can issue alerts when
focus diminishes, thereby potentially reducing the
risk of accidents. Furthermore, EEG-based assess-
ments in educational environments facilitate the mon-
itoring of students’ attention and cognitive engage-
ment during instructional activities, offering educa-
tors insights into cognitive workload and engagement
levels. Researchers and practitioners can develop in-
terventions to improve attention processes in a variety
of real-world settings and gain important insights into
attention dynamics by integrating EEG into everyday
environments.
This research aims to evaluate various feature ex-
traction techniques, assess the significance of optimal
channel selection, and compare the efficacy of differ-
ent machine learning algorithms to develop a more
robust and accurate framework for fatigue detection.
By systematically analyzing the contributions of each
feature extraction method and refining channel selec-
tion, the study seeks to improve model performance
and reliability in detecting cognitive fatigue.
2 METHODS
2.1 Dataset Description
A publicly available EEG dataset was used to com-
pare channel performances and feature extraction
methods. The dataset is based on Cao et al.’s work
(Cao et al., 2019), where subjects (age: 22-28 years)
in a simulated driving task were required to keep the
vehicle in a straight line as random deviations were
introduced to the vehicle’s trajectory. EEG signals
(at 500 Hz sampling rate) consisting of 30 channels
for each subject were recorded in the task. Cao et al.
also published a preprocessed version of the dataset
where the raw signals were filtered with 1 Hz high-
pass and 50 Hz low-pass FIR filters, and ocular and
muscular artifacts were removed. Cui et al. (Cui
et al., 2022) published a labeled version of Cao et
al.’s work in which they extracted 3-second long EEG
samples (downsampled to 128 Hz) prior to onset de-
viation, and these samples were labeled as alert or
drowsy, based on the subjects’ reaction time as it was
described in (Wei et al., 2018). After labeling, Cui et
al. did additional processing to keep the balance in
class labels: In the end, their dataset had 2022 sam-
ples (1011 alert samples, 1011 drowsy samples) from
11 different subjects, and this dataset was chosen for
the purposes of this work.
2.2 Feature Extraction
We extracted features from two main domains: time-
domain features and frequency-domain features. Ex-
traction was done on each of the 30 channels of the
3-second long EEG signals, resulting in 60660 sam-
ples. In total, 49 features were extracted from each
sample, and this 60660 by 49 dataset was set as the
baseline for selecting different subsets of the dataset
going forward.
2.2.1 Time-Domain Features
Time-domain features are less commonly used in
EEG processing with respect to the other feature do-
mains in the literature. However, they can still provide
meaningful information about the data, which we will
compare against frequency domain features.
Statistical Features: To assess the trends seen in
the signals, the following statistical features were ex-
tracted from the EEG signal samples: zero crossing
rate, skewness, kurtosis, mean absolute difference,
root mean square, the exponent factor of the Hurst
exponent obtained via detrended fluctuation analysis
(Jenke et al., 2014; Wang et al., 2022).
Hjorth Parameters: In addition to the temporal
features, Hjorth parameters were also investigated. In
the original work by Hjorth, activity, mobility and
complexity were developed (Hjorth, 1970).
The activity of a signal is essentially its variance
and it can contain information about signal power.
BIOSIGNALS 2025 - 18th International Conference on Bio-inspired Systems and Signal Processing
830

The mobility of the signal quantifies the standard de-
viation of the signal’s first derivative relative to the
standard deviation of the original signal, and it can be
used as an indicator for rapid changes observed in the
signal-of-interest. The complexity refers to the stan-
dard deviation of the signal’s second derivative rela-
tive to the standard deviation of the first derivative,
normalized by the mobility. Overall, complexity rep-
resents any signal’s deviation from a pure sine wave,
and can be used to assess the level of signal complex-
ity.
2.2.2 Frequency-Domain Features
Analysis and classification of EEG signals commonly
include utilization of frequency-domain features. One
of the most popular approaches is to decompose a sig-
nal into different frequency bands, as the respective
bands can carry distinct information about the sub-
ject’s cognitive level (Lal and Craig, 2002; Simon
et al., 2011).
Band Powers: For the extraction of band powers,
the EEG signals were decomposed into gamma (30-
64 Hz), beta (13-30 Hz), alpha (8-13 Hz), theta (4-8
Hz), and delta (1-4 Hz) bands using Welch’s method
on estimated Power Spectral Density. The power of
each frequency band was then stored as an individ-
ual feature. Along with the powers, the ratio be-
tween each band power was also extracted, as the
work by Minhas et al. showed that the increase of the
theta/alpha ratio can indicate increased drowsiness or
fatigue of a driver (Minhas et al., 2024a; Minhas et al.,
2024b).
Spectral Features: In addition to the commonly
used EEG features, we have also incorporated the fol-
lowing features used in speech and audio processing
applications to check whether they could provide use-
ful characterizations in the driver fatigue task:
• Spectral Centroid
• Spectral Roll-Off
• The First 10 Mel-Frequency Cepstral Coefficients
(MFCCs)
• The Mean of the First 6 Mel-Spectrogram Seg-
ments
• The Energy of the First 6 Mel-Spectrogram Seg-
ments
For the last two types of features, the Mel-
Spectrogram of each EEG signal was extracted, and
then the spectrogram was divided into 32 different
horizontal segments, i.e., into different frequency
bins. Of these segments, only the initial segments
were containing the majority of the information for
the spectrogram, and preliminary testing with differ-
ent segments yielded lesser performance. Thus, the
first six segments were chosen to be used in the anal-
ysis.
2.3 Channel Selection
With the initial features extracted from all 30 chan-
nels, we have proceeded to select target channels
to perform feature analysis. This was done both to
reduce the computational load and to eliminate the
channels that can have irrelevant information to be
able to train the models with more concise and rel-
evant data.
For testing the channels, the following procedure
was followed: The data from a given channel was
prepared for model training with a 80/20% train-
ing/testing split. A K-Nearest Neighbor (K-NN) Clas-
sifier and an Extreme Gradient Boosting Classifier
(XGB) were trained on the data for the given chan-
nel, and later, each channel was ranked with respect
to their test accuracies. The K-NN model was cho-
sen due to its ability to provide an overview of chan-
nel performances while maintaining a rather low com-
putational cost for training (Hu, 2017)(Dreißig et al.,
2020). The XGB model was chosen since it is one
of the most well-performing machine learning models
for EEG classification tasks (Choi et al., 2018)(Parui
et al., 2019). While this procedure does not allow in-
depth performance analysis for a given channel, it can
help us discern channels and test channel combina-
tions.
Table 1: XGB Performances of the Top Ranking Channel.
Cz CP3 CPz P3
Test Accuracy 81.23 81.48 80.99 80.00
Sensitivity 77.16 75.13 77.66 74.62
Precision 83.06 85.06 82.26 82.58
F1-Score 80.00 79.78 79.90 78.40
AUC 81.13 81.31 80.90 79.86
We then tested the top-ranking channels with in-
crementing combinations, i.e., we first tested the top
2 channels combined, then the top 3, and so on. The
best-performing trial was the one leveraging the com-
bination of the top 4 channels, which were Cz, CP3,
CPz, and P3, as can be seen from Table 1.
Electroencephalography Analysis Frameworks for the Driver Fatigue Problem: A Benchmarking Study
831

2.4 Feature Analysis
To have a better understanding of the extracted fea-
tures and the dataset as a whole, we tested the per-
formances of feature subsets previously described.
For testing different feature subsets in terms of test
accuracy, a similar setup to channel testing was used
with 80/20% training/testing split for the models in
Table 2.
Table 2: Feature Subset Performances.
K-NN XGB
Statistical 71.26 72.56
Hjorth 73.61 72.62
Time 73.00 77.56
Band Powers 71.08 74.72
Spectral Features 67.31 64.71
Frequency Features 75.28 83.25
Aside from the performance of frequency fea-
tures, which could be attributed to the fact that the
subset had more features, there were minor differ-
ences between the subsets, and no particular feature
subset was dominantly performing across the mod-
els. Moving on from assessing subsets to determine
the significance of a given feature, two feature analy-
sis methods were utilized: ANOVA and Chi-Squared.
After the scores for both methods were computed, all
features were sorted by decreasing scores for further
analysis.
2.5 Model Selection
Table 3: Model Performances.
Test Acc. Recall Precision F1 AUC
K-NN 74.78 75.53 74.24 74.88 74.79
SVM 90.73 93.04 88.85 90.90 90.74
DTC 76.95 75.16 77.76 76.44 76.94
RFC 83.93 85.71 82.63 84.15 83.94
LR 75.11 76.15 75.31 75.73 75.71
NN 83.44 87.33 80.90 83.99 83.46
XGB 86.53 88.07 85.32 86.67 86.65
Using all of the extracted features from the selected
channels (Cz, CP3, CPz, P3), the models in Table 3
were trained on the 80/20% splits. The K value for
the K-NN model was chosen as the square root of the
sample size based on the work done by Hassanat et
al., which showed that the square root value provides
sensitivity to noise and overall better generalization
performance. (Abu Alfeilat et al., 2019). The hyper-
parameters of the SVM and XGB models were chosen
based on the result of a Grid Search Cross Validation
algorithm (Kumar et al., 2016).
2.6 Leave-One-Out Cross Validation
In biomedical signal processing applications using
machine learning, it is common to see the use of
leave-one-out cross validation (LOOCV) algorithms
to ensure that the models have overall better general-
ization, which can lead to less susceptibility to inter-
subject variability (Kunjan et al., 2021). Again, using
all of the extracted features from the selected chan-
nels, we implemented a LOOCV algorithm as it had
the previously discussed benefits compared to a reg-
ular training-test split. The selected models for the
LOOCV were the same models in the regular train-
ing/test split to make comparisons between their per-
formances.
3 RESULTS AND DISCUSSION
3.1 Feature Performances
The results for the rankings of top-performing fea-
tures can be seen in Table 4. The rankings gener-
ated by both the ANOVA and Chi-Squared feature se-
lection methods are largely similar, with the highest-
performing features appearing in roughly the same
positions, although there are minor variations. This
suggests that both methods prioritize similar features
for model performance, despite slight differences in
their respective rankings.
Following the descending order from Table 4, the
test accuracy of each model was plotted against the
number of features in Figure 1, with the feature count
increasing incrementally based on this sorted rank-
ing. The decision to use a decreasing order was based
on the assumption that higher-ranked features would
contribute the most to the model’s performance, en-
abling early gains in accuracy. As the remaining,
lower-ranked features are added, the expectation was
to observe a plateau in performance, indicating the
point at which additional features no longer signifi-
cantly enhance model accuracy.
From Fig. 1, it can be seen that around the 30-
feature mark, most of the model performance either
began to stagnate or fluctuated between a relatively
low percentile range. This confirms our findings in
the preliminary analysis, which suggested that in-
creasing the number of features does not necessarily
result in higher model performance. Given this and
the fact that the feature amount is already relatively
low for most algorithms, we decided not to implement
BIOSIGNALS 2025 - 18th International Conference on Bio-inspired Systems and Signal Processing
832
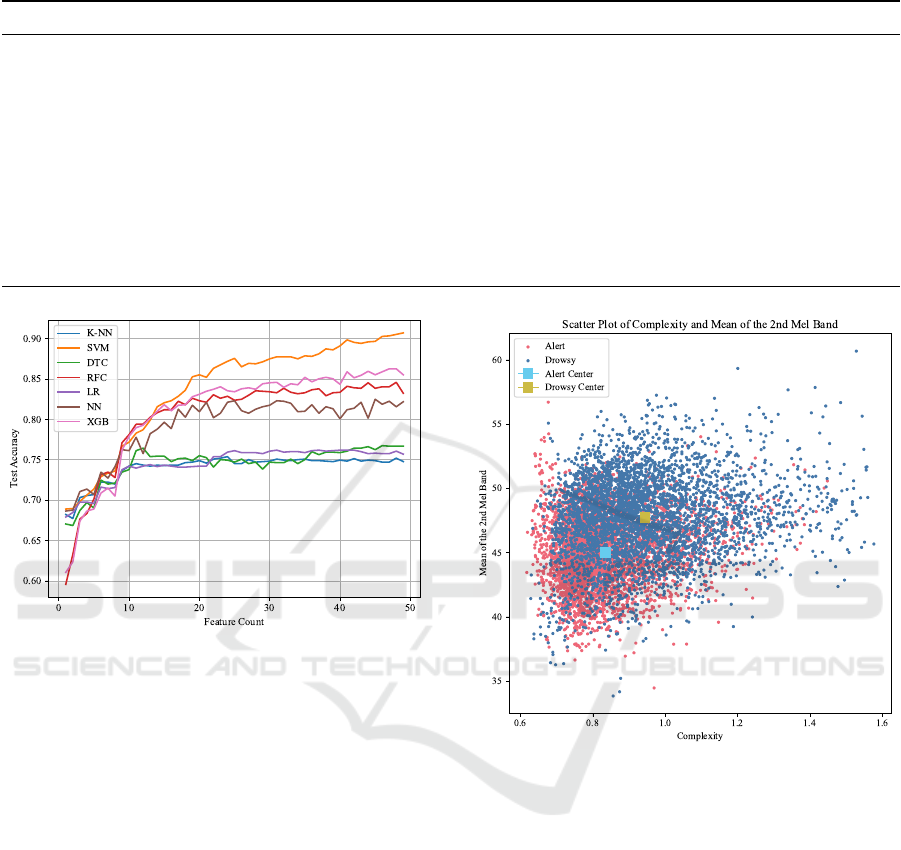
Table 4: Chi-Squared and ANOVA Feature Rankings.
Rank Chi-Squared Feature ANOVA Feature Rank Chi-Squared Feature ANOVA Feature
1 Complexity Energy 3
rd
Mel Band 11 Energy 2
nd
Mel Band Energy 6
th
Mel Band
2 Alpha Power Mean 3
rd
Mel Band 12 Mean 6
th
Mel Band Mean 6
th
Mel Band
3 Energy 5
th
Mel Band Mean 4
th
Mel Band 13 Spectral Centroid Root Mean Square
4 Energy 3
rd
Mel Band Energy 2
nd
Mel Band 14 Gamma Pow / Beta Pow Spectral Centroid
5 Energy 6
th
Mel Band Energy 4
th
Mel Band 15 Mean 2
nd
Mel Band Alpha Pow
6 Spectral Roll-Off Energy 5
th
Mel Band 16 Theta Pow Theta Pow
7 Mean 5
th
Mel Band Mean 2
nd
Mel Band 17 Root Mean Square 9
th
MFCC
8 Energy 4
th
Mel Band Mean 5
th
Mel Band 18 Beta Pow / Alpha Pow 3
rd
MFCC
9 Mean 3
rd
Mel Band Spectral Roll-Off 19 Gamma Pow / Alpha Pow Gamma Pow / Beta Pow
10 Mean 4
th
Mel Band Complexity 20 Alpha Pow / Delta Pow Mean 1
st
Mel Band
Figure 1: Figure of the model performances with an incre-
mental feature subset according to the ANOVA sorted fea-
ture list.
any feature selection methods based on the result of
ANOVA and the Chi-Squared analysis.
As a sample plot, the mean of the 2nd mel-band
and complexity are plotted in Fig. 2, where alert
and drowsy states are represented in red and blue col-
ors, respectively. The center of mass for each state is
shown with square markers. The features are arbitrar-
ily chosen from the top 20 ranking features according
to the sorted list represented in Table 4, and the scatter
plot can be seen as an indication of the intertwined na-
ture between the different states. Even still, the center
of mass for each state is distinct enough, which makes
a suitable ground for inferences.
The results show that Mel-spectrogram features,
spectral roll-off and complexity from Hjorth fea-
tures deemed effective. For the features related to
frequency bands, features involving the alpha band
were prominent, as discussed in the previous sections.
Along with the alpha band, features involving the
delta, beta, and gamma bands were also high-scoring
features, in alignment with (Minhas et al., 2024b).
Figure 2: Scatter plot of the complexity vs. the mean of the
2nd Mel-band.
3.2 Model Performances
The SVM and XGB models consistently emerged
as top performers across various evaluation metrics.
However, it is important to note that these models
were specifically fine-tuned to this dataset. As a
result, their performance might not generalize well
to other datasets, potentially leading to suboptimal
results when applied to different data distributions.
This highlights the need for further testing and val-
idation on diverse datasets to ensure the robustness
and adaptability of these models beyond the current
study. However, these models can also serve as ef-
ficient candidates for subject-specific classification
tasks where prediction accuracy takes precedence. In
scenarios where capturing individual differences and
intra-subject variability is crucial, SVM and XGB can
Electroencephalography Analysis Frameworks for the Driver Fatigue Problem: A Benchmarking Study
833

Table 5: Leave-One-Subject-Out Cross Validation Performances.
Subject ID K-NN SVM DTC RFC LR NN XGB Mean
1 79.65 80.45 77.26 81.12 84.57 78.72 78.59 80.05
2 55.11 57.01 56.44 57.39 61.36 57.58 57.95 57.55
3 63.83 64.17 67.67 68.33 69.50 50.17 68.33 64.57
4 71.79 67.74 59.63 61.32 57.60 57.43 61.66 62.45
5 67.75 69.87 67.08 67.75 62.05 73.33 67.75 67.94
6 79.22 73.34 70.78 62.50 72.44 50.45 71.08 68.54
7 58.09 62.01 64.95 68.00 66.91 53.68 63.24 62.41
8 67.14 67.05 64.20 68.00 68.94 51.61 67.61
64.94
9 86.15 85.67 77.00 83.28 84.16 69.38 80.73 80.91
10 80.09 77.31 78.93 75.23 72.92 78.47 72.92 76.55
11 66.15 65.71 67.59 67.92 68.47 50.00 65.27 64.44
Mean 70.45 69.80 68.15 69.49 69.90 60.98 69.16 68.65
deliver effective results. Their ability to adapt to per-
sonalized data makes them particularly suitable when
generalizing across subjects is not the primary goal,
but rather the fine-tuning of models to individual char-
acteristics to optimize accuracy is prioritized.
3.3 Leave-One-Out Cross Validation
(LOOCV) Accuracy
Table 5 shows the test accuracy of each model with
their respective subject and model means. The means
of the overall subject performances vary on a rela-
tively large range, which can be caused by many fac-
tors such as the method of experimentation, any ag-
gravating movement during measurement, noise and
inconsistencies in the sensor data.
The highest-performing subject was subject 9,
with the highest overall performing model being the
SVM (as well as being the highest-performing model
in the previous section). Whereas the lowest-scoring
subject was subject 2, and the lowest-scoring model
on average was the Decision Tree Classifier. As ex-
pected, the mean performance of the models trained
using LOOCV was lower compared to the results
from the previous section. This outcome can be at-
tributed to the fact that some models were fine-tuned
for specific data splits, leading to reduced general-
ization capability when applied to new, unseen sam-
ples. Despite the lower performance, LOOCV results
may still be appropriate for applications that prioritize
inter-subject generalization, as LOOCV rigorously
tests the model’s ability to generalize across different
individuals. Such results can be valuable for imple-
mentations where accommodating variations between
subjects is critical.
4 CONCLUSION
In this paper, we investigated various feature ex-
traction techniques and machine learning models ap-
plied to EEG signals for the detection of driver fa-
tigue. Leveraging the extracted features, we con-
ducted a comparative analysis of different EEG chan-
nels within the dataset to identify the most relevant
channels for this application. By doing so, we aimed
to determine which channels contribute most signif-
icantly to the detection of fatigue, enabling a more
targeted and effective approach to improving model
performance for this specific use case.
Using the selected EEG channels, we evaluated
various feature subsets and analyzed their perfor-
mance across different machine learning algorithms.
These comparisons highlighted the most impactful
features and frequency bands for the driver fatigue
detection task. Additionally, we employed feature
ranking methods to assess the individual contribu-
tion of each feature, providing insight into their rel-
ative effectiveness for solving the problem. The ma-
chine learning models demonstrated promising per-
formance depending on the context; both regular
train-test split and LOOCV approaches were applied
to the dataset, and their respective results were dis-
cussed to assess the robustness and generalizability
of the models for different use cases.
Our findings on the channel analysis and feature
extraction methods align with the existing literature,
and they show the availability of different methods
for practical applications. The methods gathered from
this research can be quite swiftly translated into a real-
time embedded application for a driver fatigue detec-
tion system. Our contribution to the literature is cen-
tered on a focus towards high-yield, low-cost feature
BIOSIGNALS 2025 - 18th International Conference on Bio-inspired Systems and Signal Processing
834

and channel analysis for EEG-based driver fatigue de-
tection. We also implemented different feature ex-
traction methods from different disciplines (such as
speech processing problems), which are not com-
monly used in EEG processing, and they returned
comparable results to what was currently available
in the literature. These unconventional approaches
yielded results that were comparable to existing meth-
ods in the field, demonstrating their potential to en-
hance EEG analysis without adding significant com-
putational or financial overhead.
This work broadens the scope of feature extraction
in EEG studies by incorporating diverse methodolo-
gies, while maintaining a focus on practical and cost-
effective solutions. To further extend this research, a
key focus for future work could be the development of
real-time applications based on these findings. These
real-time systems could provide instant feedback to
drivers, improving road safety by mitigating the risk
of fatigue-induced accidents. Additionally, some of
the available features and extraction methods were
preliminarily excluded from the scope of this paper
due to their high computational cost and low impact
on performance. However, conducting more compre-
hensive studies to evaluate the viability of these meth-
ods in various EEG applications could prove benefi-
cial for the literature.
REFERENCES
Abu Alfeilat, H. A., Hassanat, A. B., Lasassmeh, O.,
Tarawneh, A. S., Alhasanat, M. B., Eyal Salman,
H. S., and Prasath, V. S. (2019). Effects of distance
measure choice on k-nearest neighbor classifier per-
formance: A review. Big Data, 7(4):221–248.
Cao, Z., Chuang, C.-H., King, J.-K., and Lin, C.-T. (2019).
Multi-channel eeg recordings during a sustained-
attention driving task. Scientific Data, 6(1).
Choi, H.-S., Kim, S., Oh, J. E., Yoon, J. E., Park, J. A.,
Yun, C.-H., and Yoon, S. (2018). Xgboost-based
instantaneous drowsiness detection framework using
multitaper spectral information of electroencephalog-
raphy. In Proceedings of the 2018 ACM International
Conference on Bioinformatics, Computational Biol-
ogy, and Health Informatics, pages 111–121.
Connor, J., Norton, R., Ameratunga, S., Robinson, E.,
Civil, I., Dunn, R., Bailey, J., and Jackson, R. (2002).
Driver sleepiness and risk of serious injury to car oc-
cupants: population based case control study. BMJ,
324(7346):1125.
Cui, J., Lan, Z., Liu, Y., Li, R., Li, F., Sourina,
O., and M
¨
uller-Wittig, W. (2022). A compact
and interpretable convolutional neural network for
cross-subject driver drowsiness detection from single-
channel eeg. Methods, 202:173–184. Machine Learn-
ing Methods for Bio-Medical Image and Signal Pro-
cessing: Recent Advances.
Dreißig, M., Baccour, M. H., Sch
¨
ack, T., and Kasneci, E.
(2020). Driver drowsiness classification based on eye
blink and head movement features using the k-nn al-
gorithm. In 2020 IEEE Symposium Series on Compu-
tational Intelligence (SSCI), pages 889–896. IEEE.
Hjorth, B. (1970). Eeg analysis based on time domain prop-
erties. Electroencephalography and Clinical Neuro-
physiology, 29(3):306–310.
Hu, J. (2017). Comparison of different features and classi-
fiers for driver fatigue detection based on a single eeg
channel. Computational and Mathematical Methods
in Medicine, 2017:1–9.
Jenke, R., Peer, A., and Buss, M. (2014). Feature extraction
and selection for emotion recognition from eeg. IEEE
Transactions on Affective Computing, 5(3):327–339.
Kumar, N., Khaund, K., and Hazarika, S. M. (2016). Bis-
pectral analysis of eeg for emotion recognition. Pro-
cedia Computer Science, 84:31–35.
Kunjan, S., Grummett, T. S., Pope, K. J., Powers, D. M. W.,
Fitzgibbon, S. P., Bastiampillai, T., Battersby, M., and
Lewis, T. W. (2021). The necessity of leave one sub-
ject out (loso) cross validation for eeg disease diagno-
sis. In Mahmud, M., Kaiser, M. S., Vassanelli, S., Dai,
Q., and Zhong, N., editors, Brain Informatics, pages
558–567, Cham. Springer International Publishing.
Lal, S. K. and Craig, A. (2001). A critical review of the
psychophysiology of driver fatigue. Biological Psy-
chology, 55(3):173–194.
Lal, S. K. and Craig, A. (2002). Driver fatigue: Electroen-
cephalography and psychological assessment. Psy-
chophysiology, 39(3):313–321.
May, J. F. and Baldwin, C. L. (2009). Driver fatigue:
The importance of identifying causal factors of fatigue
when considering detection and countermeasure tech-
nologies. Transportation Research Part F: Traffic Psy-
chology and Behaviour, 12(3):218–224.
Minhas, R., Arbatli, S., Celik, Y., Peker, Y., and Semiz,
B. (2024a). A novel approach to quantify microsleep
in drivers with obstructive sleep apnea by concurrent
analysis of eeg patterns and driving attributes. IEEE
Journal of Biomedical and Health Informatics.
Minhas, R., Peker, N. Y., Hakkoz, M. A., Arbatli, S., Celik,
Y., Erdem, C. E., Semiz, B., and Peker, Y. (2024b).
Association of visual-based signals with electroen-
cephalography patterns in enhancing the drowsiness
detection in drivers with obstructive sleep apnea. Sen-
sors, 24(8).
N
ˇ
emcov
´
a, A., Svozilov
´
a, V., Bucsuh
´
azy, K., Sm
´
ı
ˇ
sek, R.,
M
´
ezl, M., Hesko, B., Bel
´
ak, M., Bil
´
ık, M., Maxera,
P., Seitl, M., Dominik, T., Semela, M.,
ˇ
Sucha, M.,
and Kol
´
a
ˇ
r, R. (2021). Multimodal features for de-
tection of driver stress and fatigue: Review. IEEE
Transactions on Intelligent Transportation Systems,
22(6):3214–3233.
Parui, S., Bajiya, A. K. R., Samanta, D., and Chakravorty,
N. (2019). Emotion recognition from eeg signal using
xgboost algorithm. In 2019 IEEE 16th India Coun-
Electroencephalography Analysis Frameworks for the Driver Fatigue Problem: A Benchmarking Study
835

cil International Conference (INDICON), pages 1–4.
IEEE.
Philip, P., Sagaspe, P., Moore, N., Taillard, J., Charles, A.,
Guilleminault, C., and Bioulac, B. (2005). Fatigue,
sleep restriction and driving performance. Accident
Analysis & Prevention, 37(3):473–478.
Simon, M., Schmidt, E. A., Kincses, W. E., Fritzsche, M.,
Bruns, A., Aufmuth, C., Bogdan, M., Rosenstiel, W.,
and Schrauf, M. (2011). Eeg alpha spindle measures
as indicators of driver fatigue under real traffic condi-
tions. Clinical Neurophysiology, 122(6):1168–1178.
Singh, A. K. and Krishnan, S. (2023). Trends in eeg signal
feature extraction applications. Frontiers in Artificial
Intelligence, 5.
Wang, F., Wang, H., Zhou, X., and Fu, R. (2022). A driving
fatigue feature detection method based on multifractal
theory. IEEE Sensors Journal, 22(19):19046–19059.
Wei, C.-S., Wang, Y.-T., Lin, C.-T., and Jung, T.-P. (2018).
Toward drowsiness detection using non-hair-bearing
eeg-based brain-computer interfaces. IEEE Transac-
tions on Neural Systems and Rehabilitation Engineer-
ing, 26(2):400–406.
BIOSIGNALS 2025 - 18th International Conference on Bio-inspired Systems and Signal Processing
836
