
A Discrete Event Simulation Tool for Conducting a Fleet Mix Study
Mikayla Holmes and Lise Arseneau
Defence Research and Development Canada (DRDC), Centre for Operational Research and Development (CORA),
60 Moodie Drive, Ottawa, ON, K1A 0K2, Canada
Keywords: Discrete Event Simulation, Navy, Fleet Mix Study.
Abstract: A fleet mix study is currently being undertaken by the Royal Canadian Navy (RCN) to determine the optimal
composition of its future fleet to meet operational requirements. We introduce a Discrete Event Simulation
(DES) model developed within the Operational Research Integrated Graphical Analysis and Modelling
Environment (ORIGAME), called the ORIGAME Fleet Capacity Evaluation Tool (OFCET) that will be used
to examine how well a proposed future fleet (number and types of naval platforms) meets the desired
operational requirements to fulfill the Navy’s mandate. This paper describes the OFCET in terms of inputs,
outputs and assumptions and presents a case study with notional data to demonstrate how the tool can be used
as part of a fleet mix analysis to answer “what if” type questions. Furthermore, extensions of OFCET and
other problems that can be solved using this model will be provided.
1 INTRODUCTION
The Royal Canadian Navy (RCN) is currently
undergoing the largest recapitalization of its fleet
since the Second World War. To determine the
optimal composition of its fleet to meet future
operational requirements, a fleet mix study is being
undertaken. Fleet mix studies are essentially a
question of supply and demand: how well does a
supply meet an operational demand? For the RCN,
the supply consists of the type and number of
platforms in the proposed fleet and the demand
consists of several tasks and/or scenarios where the
RCN would be expected to provide a response. In
recent years, there have been comprehensive surveys
and literature reviews on modelling and solving fleet
mix-related problems (Wojtaszek and Wesolkowski
2012, Ali 2023). Due to potentially conflicting
objectives, such as performance, deployability,
availability, cost, and risk (Baykasoğlu et al. 2019),
military fleet mix problems can be extremely difficult
to solve.
Defence Research and Development Canada
(DRDC)’s Centre for Operational Research and
Analysis (CORA) has developed a fleet capacity
evaluation tool to conduct the latest fleet mix study
for the RCN. The tool was implemented in the
Operational Research Integrated Graphical Analysis
and Modelling Environment (ORIGAME), a Python-
based open-source discrete event simulation (DES)
interface available on a github repository (DRDC
2023). The model, named the ORIGAME Fleet
Capacity Evaluation Tool (OFCET), builds on
previous work, most notably Tyche (Eisler and Allen
2012) and the Platform Capacity Tool (Fee and Caron
2021). The OFCET is less computationally intensive
than Tyche, where a single simulation run can take
hours to complete (Eisler et al. 2014). Furthermore,
OFCET is based on an open-source programming
language, unlike the Platform Capacity Tool
developed in Arena® software (Rockwell
Automation 2024), and as a result the OFCET is less
expensive and more flexible to modify. The OFCET
has been designed to be flexible and adaptable, where
the supply and demand are modelled as a
deterministic and a stochastic process, respectively.
Following an overview of related work in Section
2, we will describe the OFCET in terms of the main
inputs required to run the simulation, the outputs
produced, as well as the assumptions and limitations
of the tool in Section 3. A case study is provided in
Section 4 using notional data to illustrate the type of
“what if” questions that can be answered as part of the
fleet mix analysis. Concluding comments including
areas of future work are provided in Section 5.
Holmes, M. and Arseneau, L.
A Discrete Event Simulation Tool for Conducting a Fleet Mix Study.
DOI: 10.5220/0013090100003893
In Proceedings of the 14th International Conference on Operations Research and Enterprise Systems (ICORES 2025), pages 207-214
ISBN: 978-989-758-732-0; ISSN: 2184-4372
Copyright © 2025 by Paper copyright by his Majesty the King in Right of Canada as represented by the Minister of National Defence
207

2 RELATED WORK
Fleet mix problems can be categorized as follows:
determining the best fleet for a given interval of time;
scheduling the acquisition and retirement of fleet
platforms; or evaluating a particular fleet on a set of
tasks or scenarios (Wojtaszek and Wesolkowski
2012). The latter problem is representative of the fleet
mix study being undertaken by the RCN, where the
scope involves performing multiple tasks using
multiple types of platforms (increasing the
complexity from a fleet mix study where a single task
and/or a single platform is being assessed).
The determination of operational requirements
(i.e., the demand) can be modeled as being
deterministic or stochastic in nature (Fee and Caron
2021). When the demand is fixed based on wanting
to achieve a certain level of ambition or by examining
specific scenarios, the demand is deterministic. For
example, a planning scenario for a conflict occurring
on the Korean Peninsula was used to determine the
effective mix of the US destroyer fleet (Crary et al.
2002) and a specified number of tasks to assign to
different vehicle types was the demand to determine
an Australian military vehicle fleet (Abbass and
Sarker 2006). While operational requirements
defined using a deterministic approach are concrete,
it fails to consider the inherent uncertainty of
international relations and potential threats (Lane et
al. 2022). Furthermore, the RCN requested that the
fleet mix be assessed against a wide range of tasks,
including combat, patrol, search and rescue, and
surveillance, each requiring the use of a variety of
assets to provide a response.
In this paper, we will use stochastic simulation to
determine demand where RCN operational
requirements are represented by possible future
timelines of vignettes (or scenarios), which can occur
concurrently. The list of hypothetical vignettes
represents the full scale of activities that would
require the use of a naval platform, where each
vignette can be characterized by type (e.g., peacetime
or wartime), frequency, and duration, where all
vignettes are distinct from one another. Several
studies have estimated operational demand using a
stochastic approach. As mentioned earlier, previous
RCN fleet mix structure analyses were conducted
using Tyche, where the demand is constructed
stochastically from scenarios using frequency, start
date, and duration inputs. The scenarios were
randomly generated using a Poisson process or
scheduled at known intervals (Eisler and Allen 2012).
In another study, the RCN requested DRDC CORA
determine the optimal number and types of platform
modules to meet its mandate. A Monte Carlo discrete
event simulation is used to generate the operational
demand from 54 vignettes and a mixed-integer linear
programming (MILP) model is used to determine the
optimal mix of modules (Caron et al. 2019).
Other military applications where demand has
been modeled stochastically include exploring
ammunition stockpiles based on vignettes describing
activities from several types of training and military
missions that require ammunition (Caron et al. 2023),
determining the fleet configuration of types of aircraft
by modeling air mobility requirements from 127
different tasks over a one-year period (Wesolkowski
and Billyard 2008, Wesolkowski and Wojtaszek
2012), and estimating operational demand from a set
of 17 scenarios covering a full range of missions
mandated by Canadian defense policy, with
approximately 80 variants developed specifically to
determine the force mix of personnel (Dobias et al.
2019).
Even though multiple platform types are being
included in the RCN fleet mix study, the number of
platforms in the proposed fleet to assess has been
specified, making the supply deterministic. Each
platform type has an operational cycle (OPCYCLE)
which specifies when the platform is available to
respond to tasks and when the platform requires
maintenance. In order to maximize the number of
platforms of a certain type available and minimize the
number simultaneously in maintenance, the start of
each OPCYCLE from asset-to-asset is offset to
generate a schedule to accomplish these objectives.
However, since the OPCYCLE for the proposed fleet
are not known, the platform availability will be varied
by examining a few different cases of maintenance
profiles for each platform type.
3 OFCET
3.1 Overview
In its simplest terms, OFCET is a supply and demand
model built within the DRDC developed DES
environment named ORIGAME. The OFCET model,
like its predecessor the PCT, attempts to allocate
naval platforms (supply) to a stochastic operational
demand which is generated over a specified timeline
(Fee, 2024). The OFCET is written using an object-
oriented programming (OOP) framework which
gives rise to the model structure wherein objects of
demand (vignettes) interact with objects of supply
(platforms) based on various conditions and
constraints. Figure 1 presents the steps that OFCET
ICORES 2025 - 14th International Conference on Operations Research and Enterprise Systems
208
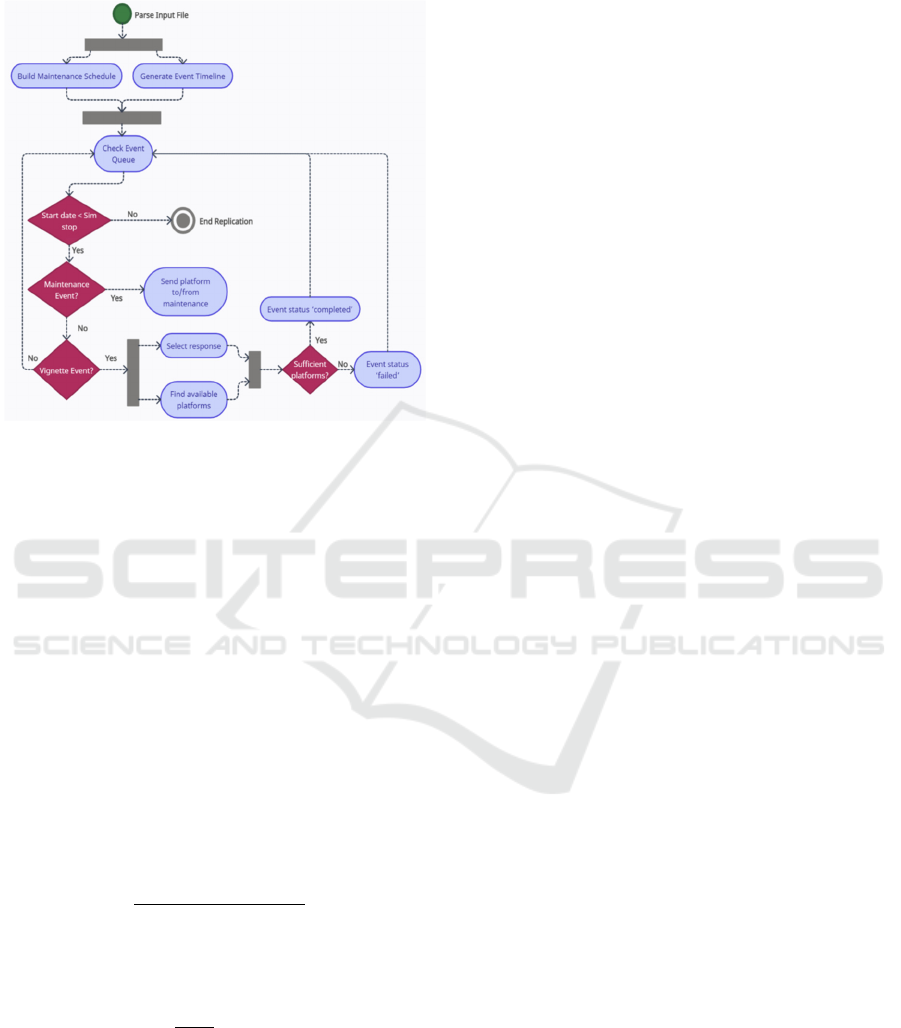
takes to progress from operational demand generation
to platform assignment.
Figure 1: OFCET activity diagram.
The first step in the OFCET algorithm after the
input data has been imported is to generate
operational demand using vignette characteristics.
The number of times an event occurs over the
simulation timeline as well as its start date(s),
depends on event type (random or scheduled) and
frequency. For random events, a Poisson distribution
is used to determine the number of events of that
vignette type to be scheduled across the simulation
timeline. A uniform distribution is then used to
schedule the start date for each event. By default, this
is set to assume equal probability of an event starting
on each day of the simulation, however, it can be
modified to only include a certain timeframe within
the simulation (Fee, 2024). Equations 1 and 2 display
the distributions and their respective parameters for
random event scheduling.
𝒇
𝒌
𝒆
𝒇𝒓𝒆𝒒∗𝑳
𝒔𝒊𝒎
𝒇𝒓𝒆𝒒 ∗ 𝑳
𝒔𝒊𝒎
𝒌
𝒌!
𝒇
𝒌 probability that k events occur across simulation
𝒇
𝒓𝒆𝒒 historical frequency of vignette per year
𝑳
𝒔𝒊𝒎
length of simulation
(1)
𝒇
𝒍
𝟏
𝒃𝒂
,𝒂𝒃
𝒇
𝒍 probability of start date on day 𝒍
𝒂 first day event can occur Defaultfirst day of simulation
𝒃 last day event can occur Defaultlast day of simulation
(2)
For scheduled event types, the number of events
is determined for each year of the simulation using
historical data. If the event occurs an even number of
times per year it is scheduled accordingly. If, for
example, an event occurs on average 3.2 times per
year the model will schedule the vignette three times
a year, 80% of the time and four times in a year, 20%
of the time (Fee, 2024). Moreover, one can prespecify
an interval of time in which a vignette is scheduled if
the event must occur during timeframes throughout
the simulation. For example, exercises in the Arctic
may only be scheduled during the summer.
Duration and location of events are determined
the same way for both event types. Duration of events
is calculated using a triangular or uniform distribution
depending on whether the minimum, mode
(sometimes unavailable) and maximum parameters
are known (Fee, 2024). The location of an event is
chosen using a prespecified probability matrix that is
based on historical data and subject matter expertise.
Maintenance schedules for each platform are
generated concurrently to operational demand, but
before the assignment process. All platforms have an
OPCYCLE which specifies the timelines and
sequence in which a platform is prepared to do certain
tasks. During high readiness (HR) a platform can
conduct the full spectrum of combat operations, while
during normal readiness (NR) a platform is capable
of employment to operations in permissive
environments. The platform also goes into
maintenance periods called docking or short work
period (DWP or SWP) (Royal Canadian Navy, 2017).
In terms of platform availability, DWPs have the
largest impact, as some platform types are scheduled
to be in maintenance for 18 months within a 6-year
OPCYCLE, therefore the OFCET builds a schedule
specifically for each platform class based on the
DWPs only (but SWPs can be added if desired).
To minimize overlapping of unavailability
amongst platforms of the same class, a staggered
scheduling approach is taken following the
methodology seen in previous fleet mix studies. The
duration for which a DWP is shifted depends on the
length of the OPCYCLE and how many assets the
fleet contains of that class type. The maintenance
module can also incorporate varying numbers of
platforms by coast if desired.
For each replication, the simulation begins its
assignment pipeline after demand and maintenance
generation is complete. Since the OFCET is a DES,
the state of the system is assumed to be constant
between days in which an event appears on the event
queue. Within the OFCET there are two types of
demand which arise on the event queue – vignette
A Discrete Event Simulation Tool for Conducting a Fleet Mix Study
209

events or maintenance events. Vignette events are
prioritized within the event queue according to their
consequence of failure. This measure goes from 1 –
‘very low’ to 5 – ‘high’ and is a prespecified input.
Maintenance events have a priority value of 1000 so
that all platforms go to or return from maintenance on
a given day before a response is assigned to any
operational demand. After each platform’s
availability is fixed for a given day, the OFCET looks
at a variety of conditions to determine whether a
response is possible for each vignette event.
The current version of the model does not
consider platforms for assignment if they are on
another event or in maintenance when a new event
appears in the queue. For each platform available on
day x, the OFCET assesses whether the platform:
i. Can get to the location of the event
within the desired response time.
ii. Can complete the event and get back to
home port before the next DWP.
iii. Has enough days left at HR if the event
requires that level of readiness.
The platforms which satisfy these conditions are
then compared to the vignette’s chosen response
option.
If the list of available platforms does not meet the
requirements of the randomly chosen vignette
response option, the event’s completeness attribute is
set to ‘Failed’ and the simulation proceeds to the next
event. If, however, the available platforms meet or
exceed the required response, they are then ranked
based on the number of days the platform has left at
HR as well as its respective travel time to the vignette
location. If platforms within a certain class have
different values for HR days and travel time, then the
order of priority depends on whether the event
requires HR. If a vignette requires HR, the
platform(s) with the fewest days remaining at HR are
assigned to maximize the utility of the platforms
before they go down to NR. If the HR days are tied in
ranking the platform with the shortest response time
is assigned and vice versa. Lastly, the prioritized
platforms are assigned, and their status becomes
unavailable for the duration of the event plus two
times their specific travel time. This process
continues until an event appears on the queue which
has a duration and response time which extends
beyond the last simulation day, at which time the
model replication is complete.
The four OFCET model output files and input file
details are discussed below in Section 3.2 and 3.3.
3.2 Inputs
As mentioned above, the OFCET relies on several
input parameters to generate the operational demand
and platform maintenance schedules. Simulation
specific parameters and platform attributes are also
contained in the input file. One input file is required
for OFCET which contains 6 mandatory worksheets.
The worksheets are named Vignette Information,
Distance Matrix, Ship Information, OPCYCLE
Parameters, Response List, and Simulation
Parameters. The following list provides a summary
of what information is contained in each worksheet as
well as the primary use of that information during the
modelling process.
1. Vignette Information: contains type, annual
frequency, duration parameters, response
time, consequence of failure (1-5), HR
(boolean) and location for each vignette and
is used to generate operational demand.
2. Distance Matrix: Contains location names
and IDs for all vignettes and the nautical
miles from each location to the west and east
coast RCN home ports – used to calculate
platform travel time.
3. Ship Information: Contains ship class ID,
name, home port, cruising speed and length
of time at HR – used to allocate appropriate
platform and time spent at HR.
4. OPCYCLE Parameters: Contains ship class,
ID and number of assets, length of DWP and
OPCYCLE – used to generate platform
maintenance schedules.
5. Response List: Contains vignette ID and
name, platform classes as columns and all
combinations of allowed response options –
used to assign platforms to vignette events.
6. Simulation Parameters: Contains length of
simulation (years) and event run on length –
used to define model and event lengths.
3.3 Outputs and Post-Analysis
Modifying output specifics to the OFCET is a simple
task due to the user-friendly and flexible nature of
ORIGAME. The current iteration of the OFCET is
built to output four files which provide information
on: the operational demand generated, platform
allocation, response option distribution and a history
log that documents reason for failure of any event.
The structure of the output files depends on which
mode the simulation was run inside ORIGAME.
Since all simulations use the batch mode, it will be
discussed here. When running a batch mode,
ICORES 2025 - 14th International Conference on Operations Research and Enterprise Systems
210

simulation averaged metrics can be obtained, and the
stochastic nature of event generation is exemplified.
As such, ORIGAME builds a SQL database file for
batch runs which has four tables named History,
RespData, eventData and shipData. The database
files must be processed using an integrated
development environment (IDE) to calculate
averaged metrics. Some of these could include event
completion rate by vignette or overall, distribution of
platform demand generated by the random response
options, and the average number of HR events on any
given simulation day. These metrics (among others)
provide useful insight into how well the fleet is
meeting its operational demand.
The following case study aims to provide clarity
on the benefits of these output types and the overall
flexibility of the OFCET as a naval planning tool.
4 CASE STUDY
4.1 Assumptions
Before outlining the case study details and results,
some assumptions and caveats will be presented. It is
important to note that unlike previous fleet capacity
tools, these caveats are not necessarily permanent.
Modifications of the OFCET can be implemented as
required since it is based in an open-source
programming language (Python) and not hindered by
any licensing or software restrictions.
The OFCET caveats which are discussed below:
i. No re-assignment of platforms when
away from home port.
ii. Time at HR for all platforms modelled
optimistically.
iii. No SWPs incorporated into
maintenance schedule.
Re-assignment pertains to the functionality where
a platform can be re-tasked to a higher priority event
while currently assigned to an event. This capability
may represent reality more accurately, however, the
output files which keep track of why events have
failed do not indicate a pressing need to add this into
the current version of the model.
Platform readiness levels for the RCN, both
duration, time frame and type, are defined in each
platform’s OPCYCLE. For this case study, the
platform availability has been modelled
optimistically because we have not included SWPs in
the maintenance profiles. Furthermore, platform
readiness levels have been modelled optimistically as
well. The platform goes to HR for the first time when
an HR event occurs after the platform has finished a
DWP. The platform then remains at HR for a set
number of days (can be different for each platform or
class) regardless of whether it is assigned to HR or
NR events during that time. After those days have
lapsed, the platform must come out of a DWP before
it can go back to HR which accurately represents the
real-life platform readiness cycle.
The last assumption to be discussed relates to the
way response options are decided on. A vignette can
have many acceptable combinations of platforms that
can complete it. Whether an assignment is possible or
not requires comparing the platforms available to
those acceptable response options. The OFCET
currently selects a response option randomly with
equal probability across options since running batch
simulations with many replications allows for all
options to be selected and compared. The following
subsections will outline a fleet mix study conducted
using OFCET with notional data.
4.2 Inputs
The notional fleet mix study presented here
exemplifies the primary use case for the OFCET
model. Specifically, the OFCET was used to assess
how one RCN fleet composition meets three different
cases of demand. For each of these cases (outlined
below), the operational demand is generated, and
platforms are assigned the same way; however, each
scenario has a different (not mutually exclusive) set
of maritime events for which the fleet is assessed
against. It is important to note that the OFCET can
also be generalized to solve workforce supply and
demand problems for army and air force as well as
assist in decision making processes regarding impact
of maintenance period times or demand requirements.
Recall, from Section 3.1, that all operational
demand is generated according to vignette
characteristics. Historical data and discussions with
subject matter experts (SMEs) can also provide
qualitative information which enhances the
modelling approach taken here (Dobias et al, 2019).
The historical data can also provide information about
the realistic concurrency between vignettes.
Concurrency of events is a challenge to consider
within fleet capacity tools. It is imperative to assess
naval capability based on future timelines of
operational demand that are as realistic as possible;
however, this is difficult to emulate when the demand
includes all events the fleet could undertake. For
example, day-to-day operations like a public
engagement event would be quickly halted if a search
A Discrete Event Simulation Tool for Conducting a Fleet Mix Study
211
and rescue or full spectrum operations event occurred
requiring a naval response.
One way to limit the impact of demand
concurrency is to define categories: wartime (WT),
peacetime (PT), discretionary (D) and non-
discretionary (ND) for each vignette based on the
type of operation it involves. Categorization allows
for input files to be scoped down into wartime or
peacetime scenarios and thus minimize unrealistic
concurrency of operational demand. Ideally, this
scoping will also allow the overall fleet capacity
metrics to more accurately express how well the
demand is met.
Three demand cases are explored here using the
OFCET model. They are the full, peacetime (excludes
WT) and wartime (excludes PT and D) scenarios. The
total number of vignettes are 63, 44 and 26,
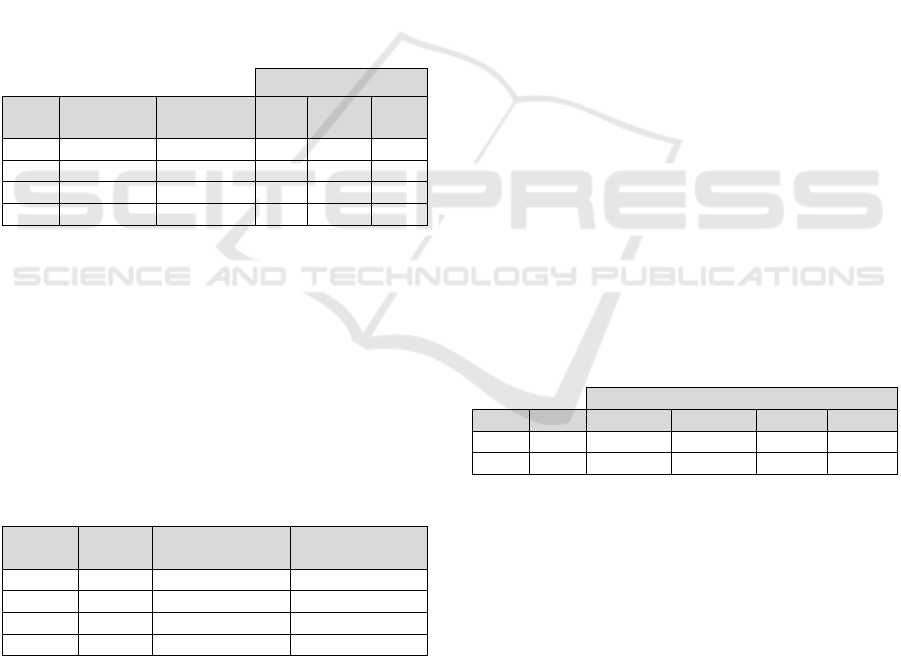
respectively. Table 2 contains a subset of 4 notional
vignettes with their input format for reference.
Table 2: Subset of 4 notional vignettes and characteristics.
Duration (days)
ID Category Frequency
(annual)
Min Mode Max
2 WT 0.5 30 227 730
5 PT 6 7 NA 50
11 ND 0.07 10 35 60
40 D 1 30 NA 30
The supply for the notional fleet mix study is
predetermined and consists of four classes of
platforms with a different number of assets within
each class. Additionally, each class has a specific
OPCYCLE and predetermined length of time in
maintenance which impacts the overall supply. These
details are presented in Table 3, followed by Section
4.3 which goes over various metrics used to assess
how well our supply met the operational demands for
all three cases.
Table 3: Supply for notional fleet mix study.
Class No. of
Assets
Length of
OPCYCLE
Months in
DWP
A 10 5 yrs. 12
B 5 5
y
rs. 15
C 7 6
y
rs. 18
D 2 6 yrs. 6
4.3 Results
All results are derived from the OFCET model
running over 80 replications with a simulation length
of 13 years. One year burn-in and cool-down periods
are used and therefore all metrics presented come
from data across 11-year timelines. These
adjustments are necessary as platforms are not
prepositioned on events or in maintenance when the
simulation begins and similarly platforms will not be
assigned to an event if the end of that event surpasses
the simulation timeframe. For the case study 80
replications was sufficient and takes less than 15
minutes to complete for the full demand input file.
The wartime demand case with only 26 vignettes,
completes in six minutes, which highlights
improvement on long computation times seen with
the previous fleet capacity tool Tyche.
Typically, with supply and demand models, the
first metric looked at is overall event completion rate.
Within the framework of fleet capacity and any
defense related capacity model there are multiple
factors and interactions at play which must be
considered in addition to overall event completion.
These factors and their impact are emphasized by an
example, discussed below with aiding information in
Table 4.
To illustrate, consider a randomly generated
timeline that contains an instance of vignette 2 which
requires a multi-platform response, all of which must
be at HR for a duration of 6 to 8 months. The
completion of this event can have a large impact on
whether many occurrences of a shorter, less
demanding vignette, for example 5, gets completed
over that same time frame. In this example, an overall
event completion rate which averages out the failure
of many instances of vignette 5 with one completion
of vignette 2 can miss these nuances entirely.
Table 4: Response options and HR requirements for
vignettes discussed in previous example.
Platform Class
ID HR A B C D
2Yes 3 2 0 1
5 No 0 0 0 1
For the case study being discussed here, a variety
of metrics will be shown to demonstrate the type of
results that can be obtained from the OFCET. First,
the overall event completion rate for all three demand
cases is shown in Table 5. To gain further insights
into how well the supply meets some of our wartime
demand, Figure 2 displays the average event
completion rate for 14 of the 26 vignettes. Figure 2
also illustrates how the overall event completion rate
is unable to capture the large variation in event
completion for individual vignettes and the
importance of investigating vignette specific
completion rates.
ICORES 2025 - 14th International Conference on Operations Research and Enterprise Systems
212
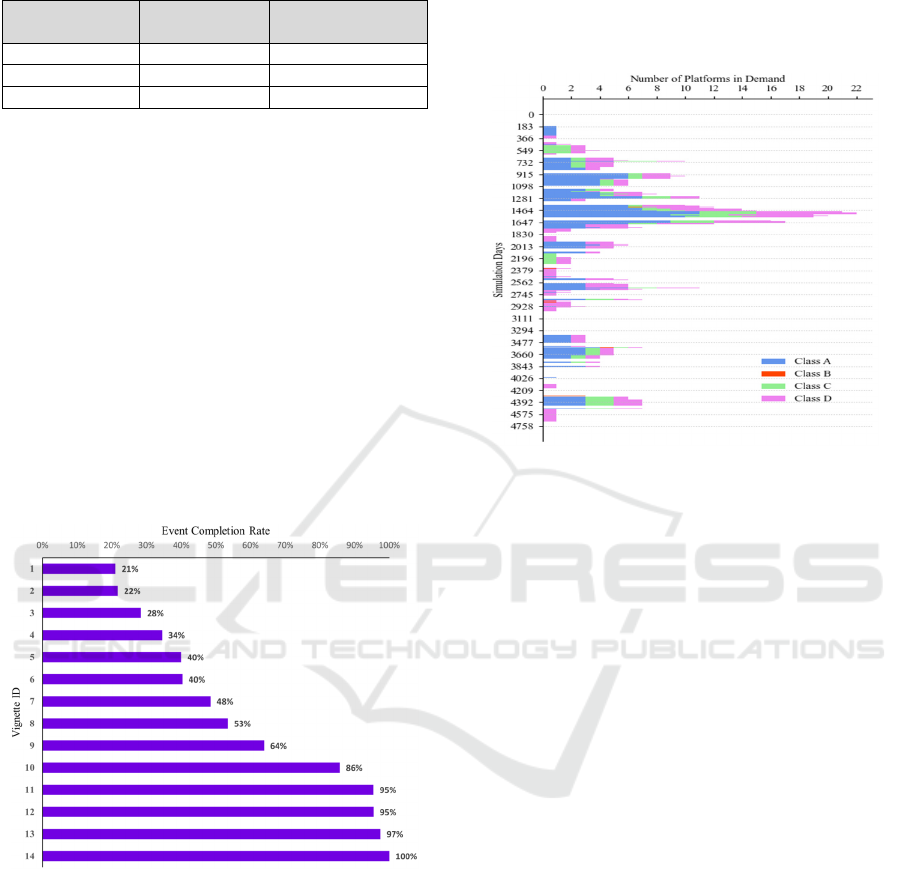
Table 5: Overall event completion rate for three demand
cases.
Demand Case
No. of
Vi
g
nettes
Overall Event
Com
p
letion
Full 63 70%
Peacetime 44 73%
Wartime 26 75%
An additional function of the OFCET model is
that for any demand scenario, the user can specify that
they want only the event timeline to be generated,
which means no assignment phase will occur. Figure
3 displays one possible timeline generated using the
26 vignettes within the wartime demand case.
Although these analyses of the OFCET outputs do not
explore how much of the demand is currently met
with a specified fleet, it can be used to inform naval
planners about the potential requirements for certain
platform classes and/or lengths of time needed at HR.
Additionally, looking at the various platform
response options for certain demand cases can assist
in identifying how commissioning or
decommissioning a platform class will impact the
overall fleet’s ability to meet operational
requirements.
Figure 2: Event completion rate of 14 vignettes from the
wartime demand case.
In summary, the results of the notional fleet mix
study presented above demonstrate useful metrics and
information one can acquire through use of the
OFCET. Overall event completion rates across the
three demand cases increased slightly as the number
of included vignettes decreased, however, careful
consideration is required when looking at one
aggregate metric. Average event completion rate for
individual vignettes provides a greater degree of
certainty towards how well the fleet can meet
operational demands. Additional outputs, such as
event failure logs, also aid in providing naval
personnel with explanations regarding specific
vignettes completion rate. These outputs emphasize
areas where the model can be improved to more
accurately represent naval scenarios.
Figure 3: 13-year operational demand of each platform
class for wartime case.
5 EXTENSIONS
One benefit of the OFCET model being based in a
DRDC tailored, open-source platform is the
opportunities for improving and adding new modules
to the model. Some of these potential modules could:
• Re-task platforms.
• Incorporate an optimization algorithm.
• Build commission and decommission
functionality.
• Incorporate platform attrition.
• Add in crewing and/or training component.
In general, it is valuable to incorporate aspects of
the RCN functionality into fleet capacity tools to
provide the most useful results to decision makers.
Re-tasking platforms would mimic the real-life
scenario in which a platform is originally assigned to
an event but gets re-assigned to a new, higher priority
event in a nearby geographical area – i.e. a search and
rescue mission. These demands are often sporadic in
nature and can be investigated by using the current
OFCET version and assessing information within the
event history output files.
Incorporating previous work done by Widmer
(2024) and Fee (2019) would allow for maintenance
schedules to be optimized and can easily be
incorporated into the OFCET due to its Python
A Discrete Event Simulation Tool for Conducting a Fleet Mix Study
213

framework.
The OFCET could also be extended to deal with
platform transitions and their effect on the RCN fleet
capacity. Moreover, army and air force services could
utilize the platform specific approach of the OFCET to
assist in understanding how their resources meet
operational demands. The general workforce
modelling approach within the OFCET can be adapted
for many problems outside of naval fleet procurement.
6 CONCLUSION
This paper presents a new fleet capacity evaluation
tool along with a notional fleet mix study to display
the OFCET’s functionality. The OFCET model is not
computationally taxing and is flexible, which
improves upon the limitations of previous fleet
capacity tools such as PCT and Tyche. It is based in
the DES framework of ORIGAME which improves
its longevity due to having fewer licensing and
software constraints. The OFCET provides various
outputs that can be used to investigate questions
asked by stakeholders, naval planners and other
services alike. This information assists in informing
how certain fleet composition(s) can meet RCN
operational demands. The OFCET is easily adaptable
and can be implemented as required to address
subsequent RCN questions, or more broadly, defence
supply and demand problems.
ACKNOWLEDGEMENTS
The authors would like to acknowledge the work of
Benjamin Baker, previously a student with CORA,
who developed OFCET version one.
REFERENCES
Abbass, H., Sarker, R. (2006). Identifying the fleet mix in a
military setting. In Proceedings of the Second
International Intelligent Logistics Systems Conference
2006. Australian Society for Operations Research.
Baykasoğlu, A., Subulan, K., Taşan, A.S., Dudaklı, N.
(2019). A review of fleet planning problems in
single and multimodal transportation systems.
Transportmetrica A: Transport Science, 15(2):631–697.
Crary, M., Nozick, L.K., Whitaker, L.R. (2002). Sizing the
US destroyer fleet. European Journal of Operational
Research 136: 680-695.
Caron, J.-D., Fong, V., Brion, V. (2019). On the Use of
Simulation and Optimization for Mission Modules
Selection in a Maritime Context. Military Operations
Research Journal 24(1):41–56.
Caron, J.-D., Bryce, R.M., Young, C. (2023). A Simulation
Tool for Exploring Ammunition Stockpile Dynamics.
In Proceedings of the 12th International Conference on
Operations Research and Enterprise Systems
(ICORES), Volume 1:38-49. SCITEPRESS.
Defence Research and Development Canada. (2023).
ORIGAME. https://github.com/DND-DRDC-
RDDC/OS_ORIGAME.
Dobias, P., Hotte, Maj. D., Kampman, J., Laferriere, B.
(2019). Modeling Future Force Demand: Force Mix
Structure Design. In Proceedings from the 36th
International Symposium on Military Operational
Research. ISMOR.
Eisler, C., Allen, D. (2012). A Strategic Simulation Tool for
Capability-Based Joint Force Structure Analysis. In
Proceedings of the 1st International Conference on
Operations Research and Enterprise Systems, pages
21-30. SCITEPRESS.
Eisler, C., Wesolkowski, S., Wojtaszek, D. (2014). The
Tyche and SaFE Models: Comparting Two Military
Force Structure Analysis Simulations. In Proceedings
28th European Conference on Modelling and
Simulation. ECMS.
Fee, M., Caron, J.-D., Fong, V. (2019). Genetic algorithm
for optimization of the replacement schedules for major
surface combatants. In Theory and Practice of Natural
Computing – 8
th
International Conference, pages 161–
172. Springer.
Fee, M., Caron, J.-D. (2021). A simulation model to
evaluate naval force fleet mix. In 2021 Winter
Simulation Conference (WSC), pages 1–12. IEEE.
Fee, M., Baker, B. (2024). ORIGAME Fleet Capacity
Evaluation Tool. Reference Document. DRDC-RDDC-
2024-D019.
Lane, M., Frederick, B., Kavanagh, J., Watts, S., Chandler,
N., Smith, M.L. (2022). Forecasting Demand for U.S.
Ground Forces: Assessing Future Trends in Armed
Conflict and U.S. Military Interventions. RAND
Corporation.
Rockwell Automation. (2024). Arena Simulation Software.
https://www.rockwellautomation.com/en-
ca/products/software/arena-simulation.html.
Royal Canadian Navy, Assistant Chief of the Naval Staff
(2017). CFCD 129 – Royal Canadian Navy Readiness
and Sustaiment, Ottawa.
Wesolkowski, S., Billyard, A. (2008). The Stochastic Fleet
Estimation (SaFE) model. In Proceedings of the 2008
Spring Simulation Multiconference, pages 1-5. Society
for Computer Simulation International.
Wesolkowski, S., Wojtaszek, D. (2012). Multi-objective
optimization of the fleet mix problem using the SaFER
model. In Proceedings of WCCI 2012 IEEE World
Congress on Computational Intelligence, pages 1-8. IEEE.
Widmer, M., Fee, M., Bourque, F.A. (2024). Naval Fleet
Schedule Optimization Using an Integer Linear
Program. In Proceedings of the 13th International
Conference on Operations Research and Enterprise
Systems (ICORES), pages 47-57. SCITEPRESS.
ICORES 2025 - 14th International Conference on Operations Research and Enterprise Systems
214
