
Customized Atrous Spatial Pyramid Pooling with Joint Convolutions for
Urban Tree Segmentation
Danilo Samuel Jodas
1,2 a
, Giuliana Del Nero Velasco
2 b
, Sergio Brazolin
2 c
,
Reinaldo Araujo de Lima
2 d
, Leandro Aparecido Passos
1 e
and Jo
˜
ao Paulo Papa
1 f
1
S˜ao Paulo State University (UNESP), School of Sciences, Bauru, Brazil
2
Institute for Technological Research, University of S˜ao Paulo, S˜ao Paulo, Brazil
{danilojodas, velasco, brazolin, reinaldol}@ipt.br, {danilo.jodas, leandro.passos, joao.papa}@unesp.br
Keywords:
Urban Tree Monitoring, Canopy Segmentation, Trunk Segmentation, Semantic Segmentation, Atrous Spatial
Pyramid Pooling.
Abstract:
Urban trees provide several benefits to the cities, including local climatic regulation and better life quality. As-
sessing the tree conditions is essential to gather important insights related to its biomechanics and the possible
risk of falling. The common strategy is ruled by fieldwork campaigns to collect the tree’s physical mea-
sures like height, the trunk’s diameter, and canopy metrics for a first-glance assessment and further prediction
of the possible risk to the city’s infrastructure. The canopy and trunk of the tree play an important role in
the resistance analysis when exposed to severe windstorm events. However, fieldwork analysis is laborious
and time-expensive because of the massive number of trees. Therefore, strategies based on computational
analysis are highly demanded to promote a rapid assessment of tree conditions. This paper presents a deep
learning-based approach for semantic segmentation of the trunk and canopy of trees in images acquired from
the street-view perspective. The proposed strategy combines convolutional modules, spatial pyramid pooling,
and attention mechanism into a U-Net-based architecture to improve the prediction capacity. Experiments per-
formed over two image datasets showed the proposed model attained competitive results compared to previous
works employing large-sized semantic segmentation models.
1 INTRODUCTION
Machine learning-based solutions are the ever-
growing focus of several companies and research in-
stitutions worldwide as the major state-of-the-art re-
source for solving many problems in different appli-
cation domains. In urban forestry surveillance, espe-
cially in the urban forest and tree analysis, the stan-
dard methods involve the urban forest quality assess-
ment (de Lima Ara
´
ujo et al., 2021), detection and
segmentation of trees in images (Jodas et al., 2022b,
2021, 2023), and tree species classification in images
collected from remote sensing, aerial devices, and im-
ages from the street level (Jodas et al., 2022a). Re-
garding the latter modality, images from the street-
a
https://orcid.org/0000-0002-0370-1211
b
https://orcid.org/0000-0002-7316-196X
c
https://orcid.org/0000-0003-4790-9548
d
https://orcid.org/0000-0002-0193-2518
e
https://orcid.org/0000-0003-3529-3109
f
https://orcid.org/0000-0002-6494-7514
view perspective are gaining increasing prominence
because of the good quality of less-expensive hand-
held cameras and the appearance of new datasets like
Google Street View (GSV) images. Moreover, com-
pared to aerial and remote sensing imaging modal-
ities, one can gather further details from images of
the street level, such as damages on the tree trunk,
the presence of pathogens, and the total area of the
canopy leaves for further structural analysis.
In the context of tree analysis by computer-aided
methods, one of the most important tasks consists
of finding the trunk’s area and the tree’s canopy to
estimate essential metrics like the diameter of the
trunk and the total area covered by the treetop foliage.
Along with other physical aspects, those prominent
metrics play an important role in assessing the force
applied to the tree in severe climatic events, especially
in windstorm conditions, allowing us to determine the
point at which the trunk may break and cause the tree
to fall. Along with object detection and classification
tasks, image segmentation is one of the most impor-
tant steps in image processing and analysis to support
Jodas, D. S., Velasco, G. N., Brazolin, S., Araujo de Lima, R., Passos, L. A. and Papa, J. P.
Customized Atrous Spatial Pyramid Pooling with Joint Convolutions for Urban Tree Segmentation.
DOI: 10.5220/0013090400003912
Paper published under CC license (CC BY-NC-ND 4.0)
In Proceedings of the 20th International Joint Conference on Computer Vision, Imaging and Computer Graphics Theory and Applications (VISIGRAPP 2025) - Volume 3: VISAPP, pages
267-274
ISBN: 978-989-758-728-3; ISSN: 2184-4321
Proceedings Copyright © 2025 by SCITEPRESS – Science and Technology Publications, Lda.
267

limiting the boundaries of the object or region of in-
terest.
In urban tree analysis, image segmentation may
help determine the pixels of the leaves and the trunk
region as a first-glance step for further estimating
the metrics related to those regions using automatic
strategies. In such context, classical image process-
ing algorithms (Zhou et al., 2020), graph-based meth-
ods (Deluzet et al., 2022), and deep learning mod-
els (Zhao et al., 2023) have been the state-of-the-
art for the tree canopy and trunk segmentation using
aerial images. However, the methods have to cope
with difficult scenarios like low-quality images and
dimmed conditions at the time of the image collec-
tion, which may impact the accuracy of the tree struc-
ture segmentation when well-known image process-
ing methods are used. Therefore, modern methods
based on deep learning models arise to effectively
handle those difficult scenarios and extract image fea-
tures that support generalizing the image segmenta-
tion in more complex situations.
In recent years, machine learning and deep learn-
ing have evolved to provide solutions to complex
problems across various domains. Convolutional
Neural Networks (CNNs) excel in object classifica-
tion, detection, and segmentation, including pixel-
level semantic segmentation. U-Net (Ronneberger
et al., 2015), originally proposed for medical im-
age segmentation, is widely used for such tasks.
New strategies like spatial pyramid pooling, trans-
formers (Khan et al., 2021), and attention mecha-
nisms (Guo et al., 2022) have been introduced to ad-
dress its high parameter count, enhancing efficiency
and predictive performance.
In the wake of recent advances in intelligent sys-
tems supported by modern and efficient deep learn-
ing architectures, this paper proposes using semantic
segmentation models for the tree trunk and canopy fo-
liage segmentation in images collected from the street
point-of-view. We propose a novel strategy combin-
ing atrous spatial pyramid polling with dilated con-
volutional kernels to improve the accuracy and seg-
mentation capacity of the model. Therefore, the paper
provides the following contributions:
• To propose the use of the spatial pyramid pooling
into the convolutional layers of the U-Net archi-
tecture to reduce the network size;
• To apply the proposed model to the tree trunk and
canopy foliage segmentation and compare the per-
formance with previous studies;
• To promote the datasets with images of the tree
trunk and canopy foliage acquired from the street-
level perspective.
This article is organized as follows: Section 2 de-
scribes the proposed model and the concepts behind
the semantic segmentation architecture. Section 3
presents the datasets and the description of the exper-
imental setup, while Section 4 discusses the results
obtained from the models. At last, the conclusions
and future works are stated in Section 5.
2 PROPOSED METHOD
This section presents the proposed architecture for the
tree trunk and canopy segmentation, including a brief
description of the U-Net architecture, the Atrous Spa-
tial Pyramid Pooling (ASPP), and the attention mech-
anism.
2.1 Proposed Architecture
The proposed strategy combines spatial pyramid-
based convolutions with multiscale convolutions and
an attention mechanism to improve and gather fea-
tures at different field-of-views provided by multiple
filters applied with different dilation rates. This pro-
cess involves using different setups of the U-Net ar-
chitecture to yield a grayscale image whose pixels of
the trunk and canopy foliage receive higher grayscale
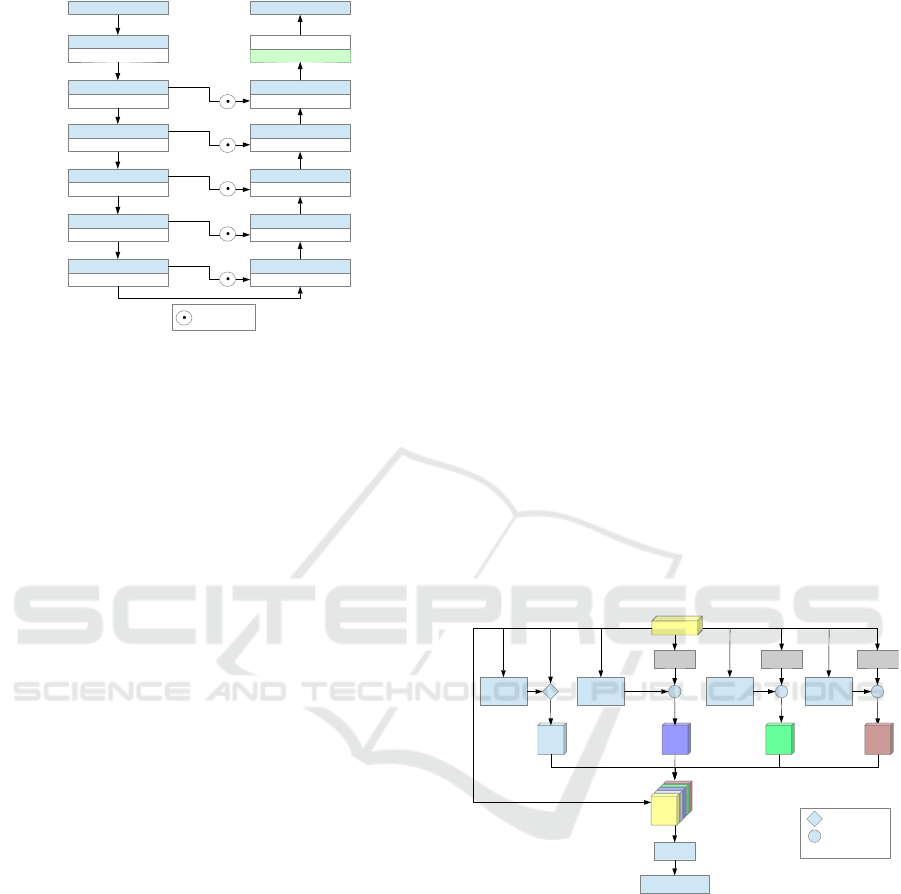
intensity values. The pipeline of the proposed strat-
egy is illustrated in Figure 1. In the encoder layer, a
single 3x3 convolution followed by batch normaliza-
tion and the Rectified Linear Unit (ReLU) activation
function is performed as the first step for the feature
extraction. Afterwards, we applied the ASPP mod-
ule and the max-pooling operation to each convolu-
tional block. We employed depthwise convolutions
and the attention mechanism inside the ASPP block,
followed by the ReLU activation function. The de-
coder layer comprises the upsampling of the feature
map followed by a depthwise convolution. The final
step involves using a point-wise convolution and sig-
moid function to produce the final mask of the tree
elements.
2.1.1 U-Net
The proposed method is based on the U-Net deep-
learning architecture for tree structure segmentation.
The model is a U-shaped architecture with symmet-
ric layers connected level-by-level in encoding and
decoding paths of convolutional operations that per-
form feature extraction and image reconstruction for
object segmentation tasks. The encoder path applies
a sequence of convolutions and max-pooling opera-
tions for image feature extraction. After that, across
VISAPP 2025 - 20th International Conference on Computer Vision Theory and Applications
268
Input image
ASPP block (32)
Max Pooling
ASPP block (64)
Max Pooling
ASPP block (128)
Max Pooling
ASPP block (256)
Max Pooling
ASPP block (512)
Max Pooling
Convolution 3x3 (32)
B.N. + ReLU
(224,224,3)
(224,224,32)
(112,112,32)
(56,56,64)
(28,28,128)
(14,14,256)
(7,7,512)
Convolution (512)
Upsampling
Upsampling
(14,14,512)
Convolution (256)
Upsampling
Convolution (128)
(28,28,256)
Upsampling
Convolution (64)
(56,56,128)
Upsampling
Convolution (32)
(112,112,64)
Pointwise conv. (1)
(224,224,32)
Output mask
(224,224,1)
Sigmoid
Concatenate
Figure 1: Proposed architecture. The first layer employs a
3x3 convolution for the first feature extraction step. Each
subsequent layer employs fixed-size kernels with different
dilation rates defined in the ASPP block.
all layers of the decoder path, the feature map is up-
sampled and combined with the feature map obtained
at the same level of the encoder path.
In semantic segmentation, the U-Net model per-
formed remarkably in different image analysis tasks.
However, reducing the network size has been the tar-
get of several studies that have proposed optimizing
the network size and saving space in memory to de-
ploy the model while preserving efficiency. On this
matter, depthwise convolutions have been proposed
to replace the standard convolutions and support a
less complex network by applying a different kernel
over each spatial dimension, i.e., channel, of the in-
put feature map (Chollet, 2017). This process per-
forms differently from a standard convolution, which
applies a single n-dimensional filter to all channels
of the feature map simultaneously, leading to more
computations and increasing the network parameters.
Since normal convolutions play the role in the original
U-Net architecture, the network parameters increased
even for a few layers of convolutions. Therefore, we
replace the normal convolutions with depthwise con-
volutions on each layer of the ASPP module compos-
ing the U-Net architecture.
2.1.2 Attention Mechanism
Convolutional Block Attention Module
(CBAM) (Woo et al., 2018) is an inspired atten-
tion mechanism conceived to improve the spatial
and channel components of the feature maps by
using convolutional sequences that deliver weighted
vectors whose elements must be stressed in the output
feature map. CBAM includes two distinct modules:
the spatial attention module (SAM) and the channel
attention module (CAM). The spatial attention mod-
ule aims to find and learn important aspects to which
more importance must be given inside the feature
map. The method applies a point-wise convolution
over a two-channel input tensor produced by max
pooling and average pooling applied over the input
feature map. On the other hand, the channel attention
module aims to find and improve the most important
channels in the input feature map. The enhanced
features are merged into the spatial and channel
domains of the feature map.
2.1.3 Atrous Spatial Pyramid Pooling
Atrous Spatial Pyramid Pooling (Chen et al., 2017) is
applied to semantic segmentation models to explore
multiple convolutional filters using different dilation
rates at each layer of image feature extraction. Such
a strategy enables gathering fine and useful details of
the object under analysis at multiple scales provided
by different fields of views captured by different ker-
nels. Instead of simply producing a single feature
map, the layer comprises multiple parallel convolu-
tional operations with different dilated rates that com-
bine multiple feature maps into a single feature repre-
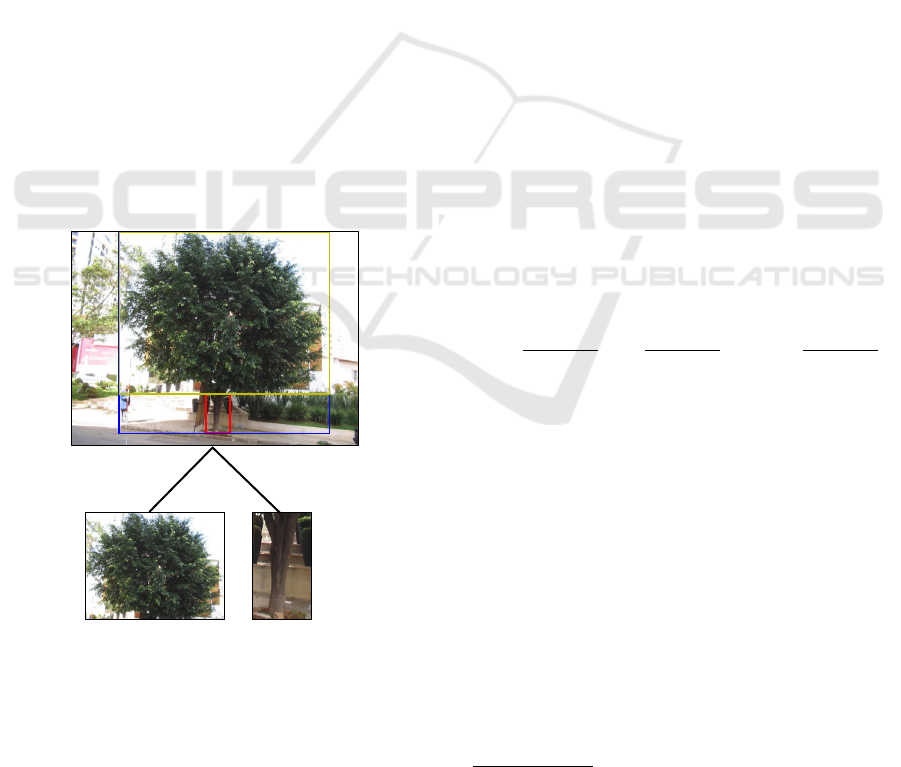
sentation. Figure 2 depicts the proposed ASPP mod-
ule.
O2O1
Input
Conv 1x1
Rate 1
Conv 3x3
Rate 6
Conv 3x3
Rate 12
Conv 3x3
Rate 18
Conv 3x3 Conv 5x5 Conv 7x7
Conv 1x1
Concatenate
Summation
O = Output
O4O3
CBAM+ReLU
Figure 2: Proposed Atrous Spatial Pyramid Pooling block
with joint convolutions.“Rate” stands for the dilation rate of
the kernel.
We also propose a set of convolutional operations
applied to the input feature map to handle small dis-
jointed regions and provide residual information for
the spatial pyramid pooling. The proposed operations
comprise three standard convolutions applied to the
input feature map, as shown by the gray color boxes
illustrated in Figure 2. The results are then added to
each output provided by the multiscale convolutions.
This process is named joint convolutions in the ASPP
block. The three proposed convolutions are applied
over 3x3, 5x5, and 7x7 kernels, which lead to captur-
Customized Atrous Spatial Pyramid Pooling with Joint Convolutions for Urban Tree Segmentation
269
ing small and large connected regions of the feature
map simultaneously. The multiscale convolutional re-
sults are then stacked and fed to a 1x1 standard con-
volution that provides an n-dimensional feature map,
being n the number of convolutional filters. To stress
important aspects at both the channel and spatial lev-
els within the output feature map, we incorporate the
CBAM attention mechanism as the final step within
the ASPP module, followed by the ReLU activation
function.
3 METHODOLOGY
This section describes the datasets and the experimen-
tal setup employed in the proposed study.
3.1 Dataset
Experiments were performed over two datasets con-
taining images of the tree’s trunk and canopy regions.
The tree element regions were cropped from images
collected from streets of S
˜
ao Paulo city, Brazil. The
tested images are cropped from street-view images
using bounding boxes that isolate each tree compo-
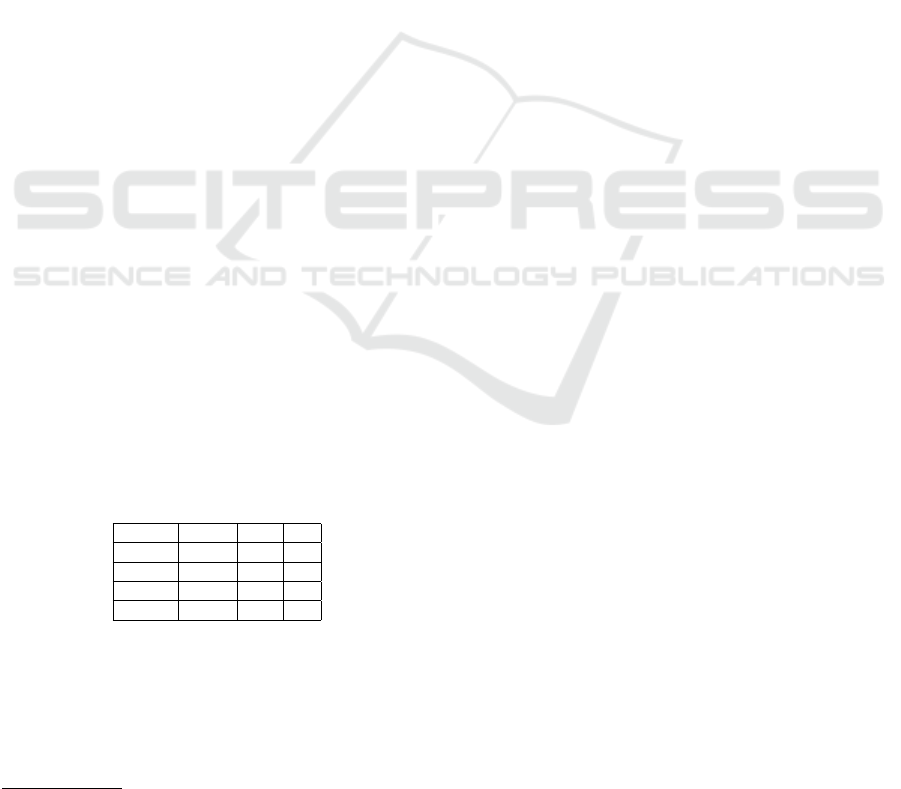
nent. Figure 3 shows an example of the cropping pro-
cess of tree regions from the street-view images.
Figure 3: Illustration of the cropping process of the trunk
and the canopy regions using the bounding boxes defined
in Jodas et al. (2022b). Blue contour: tree; yellow contour:
canopy; red contour: trunk.
The following sections describe the strategy to
produce the binary images used as ground-truth
masks for training and validating the proposed mod-
els.
3.1.1 Tree Trunk
The trunk patches were manually cropped from the
region comprising the trunk base and the point where
the canopy branches began. Afterwards, for each im-
age, we saved the regions inside the limits of the
trunks for the next step of producing the binary im-
ages whose pixels of the trunk are drawn in white
colour. In order to meet the input size of the mod-
els, all images were resized to a 224x224 resolution.
The image set comprises 801 pairs of images contain-
ing the RGB images and the corresponding trunk’s bi-
nary masks created using the LabelMe software
1
. The
image set is publicly available in the GitHub reposi-
tory
2
.
3.1.2 Canopy Foliage
We established a dataset of binary masks for each tree
canopy image produced by the k-means algorithm.
The pixels of the treetop leaves are defined in white,
while the background pixels are depicted in black (Xu
and Wunsch, 2005). This strategy avoids the time-
consuming work of manually setting the pixels be-
longing to the target class. Essentially, the method
groups the pixels of the green channel obtained by
the rg chromaticity model (Loesdau et al., 2017),
which produces a normalized RGB space related to
the colour quality defined by the hue and saturation
of the image. The normalized RGB space is defined
by using the colours’ proportions in the standard RGB
space according to the following equations:
r =
R
R + G + B
, g =
G
R + G + B
, and b =
B
R + G + B
(1)
where r, g and b are the normalized RGB values de-
fined between 0 and 1 according to the ratio of the re-
spective RGB colours in the image, respectively. Fo-
liage areas yield higher values for g and low values
for the r and b in the normalized RGB space. Con-
sequently, the g channel will produce brighter regions
for the tree canopy’s leaves, while the intensity val-
ues of the r and b components will be decreased in
the same region. On this matter, the proposed strat-
egy seeks to yield a binary image with two clusters
of grayscale intensities by applying the k-means clus-
tering algorithm (k = 2) to the rg chromaticity im-
age: the first cluster comprises the pixels related to the
leaves’ color, while the second cluster depicts the pix-
els of the background components - towers, houses,
and light poles, to cite a few.
1
https://github.com/wkentaro/labelme
2
https://github.com/recognalab/datasets/tree/master/
TreeTrunk
VISAPP 2025 - 20th International Conference on Computer Vision Theory and Applications
270
After all masks were produced, we visually in-
spected them to check the quality of the clusters
yielded by the k-means algorithm. This process is re-
quired since the k-means algorithm may behave dif-
ferently after several runtimes on the same dataset. In
total, 152 images were removed from the dataset since
they failed to produce proper binary masks to train
and validate the proposed models. Therefore, we re-
tained 1,173 images to perform the experiments. The
image set is also available in the GitHub repository
3
.
3.2 Experimental Setup
The models were developed in Python 3.6 using Ten-
sorflow 2.3.0. The training step was performed with
no transfer learning procedure since no pre-trained
weights are available to meet the standards of the pro-
posed architecture’s layers. Experiments were per-
formed over a computer equipped with a Nvidia
©
Ti-
tan XP Graphics Processing Unit (GPU) with 12 GB
of RAM, an Intel
©
Xeon processor and 128 GB of
RAM running the Ubuntu 16.04 Linux operational
system.
Experiments using the standard U-Net architec-
ture were also conducted for comparative analysis in
the single split of the entire image datasets. We ap-
plied the same filters’ setup used in the ASPP archi-
tecture. Moreover, we incorporated batch normal-
ization into all convolutional layers. Additionally, a
dropout rate of 0.3 was applied to the last layer of
the encoder path, following the same configuration
adopted by Jodas et al. (2021, 2023).
We set four ablation studies to assess the models’
performance using different setups of the proposed ar-
chitecture (Table 1). In each setup, we progressively
apply the attention mechanism and the dilated convo-
lution to the ASPP module.
Table 1: ASPP variants considering the combination of the
attention mechanism (AM) and the joint convolutions (JC)
with the ASPP module.
Model ASPP AM JC
ASPP
1
X
ASPP
2
X X
ASPP
3
X X X
ASPP
4
X X
In terms of the models’ training, we established
the same experimental setup comprising a maxi-
mum of 1,000 epochs and an initial learning rate
of 0.0001. To prevent overfitting during the train-
ing process, we applied an early stop criterion af-
ter 20 consecutive epochs from which no improve-
3
http://github.com/recognalab/datasets/tree/master/
TreeCrown
ments were achieved in the validation loss. More-
over, we adopted the Adaptive Moment Estimation
(Adam) optimizer (Kingma and Ba, 2014) and a ran-
dom data augmentation comprising the application of
horizontal flip, gaussian noise, histogram matching,
and brightness control to the images of the training
set. Finally, the batch size was set to 4.
For the canopy segmentation, we used five veg-
etation indices to assess the efficacy of the best-
performing segmentation model, namely Excessive
Green (ExG), Excessive Green-Red (ExGR), Visual
Atmospheric Resistance Index (VARI), Normalized
Difference Index (NDI), and Green Leaf Index (GLI).
After that, we apply the Otsu threshold to produce a
binary image whose pixels of the canopy leaves are
depicted in white color. This process produces the
ground-truth dataset to aid in assessing the models’
capacity to detect the pixels of the canopy foliage.
We conducted experiments to assess the models’
performance using two dataset-splitting approaches.
Initially, we analyzed five different splits, each gen-
erated with distinct random seeds. This process pro-
vided initial insights into our models’ behavior under
different training and test set configurations. Subse-
quently, we conducted a single test using a random
split into training, validation, and test sets with pro-
portions of 70%, 15%, and 15%, respectively. This
approach enables a further comparison of the best-
performing model with the baseline methods used
for comparison purposes. Finally, the models’ per-
formance was assessed using precision, recall, F1-
Score, and Intersection over Union (IoU) to compare
the similarity between the model’s results and the cor-
responding ground-truth images.
4 RESULTS AND DISCUSSION
This section presents the results yielded by the ASPP
models and a detailed comparison with the baseline
methods presented in the previous section. Further,
we compare the network size with state-of-the-art
models proposed in previous studies for tree trunk and
canopy leaf segmentation.
4.1 Canopy Segmentation
For a first-glance analysis, Table 2 presents the aver-
age loss, accuracy, F1-Score, and IoU obtained from
the five executions with different seeds.
One can notice the lessening of the loss value as
the attention mechanism and the joint dilated con-
volution were added to the baseline ASPP module
(ASPP
1
). Moreover, the loss value is the lowest for
Customized Atrous Spatial Pyramid Pooling with Joint Convolutions for Urban Tree Segmentation
271
Table 2: Average metrics computed from the five executions
with different seeds for the canopy segmentation.
Model Loss Precision Recall F1-score IoU
ASPP
1
0.016±0.002 0.870±0.024 0.904±0.020 0.882±0.004 0.694±0.027
ASPP
2
0.016±0.001 0.859±0.008 0.905±0.010 0.876±0.004 0.689±0.008
ASPP
3
0.015±0.001 0.872±0.021 0.900±0.034 0.880±0.007 0.707±0.011
ASPP
4
0.015±0.002 0.842±0.041 0.933±0.027 0.880±0.014 0.689±0.027
ASPP
3
compared to the other variants. Furthermore,
the joint convolutions of ASPP
3
yielded the highest
precision and IoU values.
Table 3 shows the average loss, precision, recall,
F1-score, and IoU values yielded from randomly split
images into training, validation, and test sets. Note
that the standard deviation shows zero values across
all models, as each model had a single training ses-
sion.
Table 3: Average metrics for each ASPP variant obtained
from the image test set for the canopy segmentation.
Model Loss
†
Precision Recall F1-score IoU
U-Net 0.014±0.000 0.846±0.106 0.909±0.070 0.871±0.071 0.711±0.114
ASPP
1
0.015±0.000 0.860±0.099 0.908±0.069 0.878±0.069 0.703±0.112
ASPP
2
0.016±0.000 0.831±0.114 0.925±0.055 0.870±0.071 0.693±0.118
ASPP
3
0.015±0.000 0.875±0.097 0.870±0.104 0.865±0.074 0.717±0.106
ASPP
4
0.014±0.000 0.862±0.102 0.905±0.073 0.878±0.067 0.714±0.109
Despite the lower recall and F1-Score, the pro-
posed architecture (ASPP
3
) obtained the highest pre-
cision and IoU against the other ASPP variants, mean-
ing that the model achieved a low frequency of false
positive cases, i.e., pixels not related to the canopy
leaves identified mistakenly as part of the foliage.
Moreover, the models integrating the joint convolu-
tions, specifically ASPP
3
and ASPP
4
, outperformed
the standard U-Net in terms of precision and IoU. No-
tably, ASPP
4
attained better results than U-Net across
all validation metrics except for the average value for
recall.
For comparative purposes, Table 4 shows the
scores obtained by the best-performing model, i.e.,
ASPP
3
, according to the IoU value, with the scores
yielded by the five vegetation indices and the model
(UNAM
*
) proposed in Jodas et al. (2023) using the
same random split as described in Section 3.2. The
GLI attained the highest average values for recall, F1-
Score, and IoU when compared to the baseline veg-
etation indices. However, the model proposed in Jo-
das et al. (2023) (UNAM) achieved the highest recall,
F1-Score and IoU. Regardless, our model attained
the highest precision and F1-Score among all base-
lines used for comparison, especially compared to the
model proposed by Jodas et al. (2023), which used a
similar strategy combining attention mechanism and
residual connections.
Table 4: Average values attained by the vegetation indices
and the best-performing semantic segmentation model for
the canopy segmentation.
Method Precision Recall F1-Score IoU
ExG 0.871±0.094 0.787±0.103 0.821±0.085 0.704±0.110
ExGR 0.779±0.181 0.811±0.107 0.780±0.137 0.656±0.154
VARI 0.521±0.283 0.458±0.299 0.471±0.283 0.352±0.239
NDI 0.578±0.240 0.706±0.229 0.611±0.212 0.471±0.204
GLI 0.856±0.096 0.811±0.107 0.827±0.087 0.713±0.113
UNAM
*
0.813±0.113 0.888±0.060 0.843±0.069 0.734±0.097
ASPP
3
0.875±0.097 0.870±0.104 0.865±0.074 0.717±0.106
4.2 Trunk Segmentation
In a similar approach, trunk segmentation provides
performance and average scores compared to those
presented by the canopy segmentation. For the first
analysis, which considers the average scores com-
puted from the five splits with different seeds, one
can check the average loss, accuracy, F1-Score, and
IoU shown in Table 5. It is worth noticing the lowest
loss value revealed by ASPP
3
and ASPP
4
as attention
mechanism and the joint convolutions are included in
the ASPP module. Similar to the canopy segmenta-
tion, the loss value is the lowest for ASPP
3
, and the
average F1-Score and IoU are the highest for the same
model with the lowest standard deviation.
Table 5: Average metrics computed from the five executions
with different seeds for the stem segmentation.
Model Loss Precision Recall F1-score IoU
ASPP
1
0.007±0.001 0.92±0.008 0.84±0.02 0.87±0.011 0.79±0.014
ASPP
2
0.006±0.001 0.89±0.013 0.89±0.02 0.89±0.007 0.81±0.009
ASPP
3
0.005±0.000 0.92±0.010 0.88±0.01 0.89±0.002 0.82±0.004
ASPP
4
0.006±0.000 0.90±0.015 0.89±0.02 0.88±0.007 0.81±0.009
Table 6 shows the average values for the single
split into training, validation, and test sets. Among the
ASPP variants, ASPP
4
attained more favorable results
with the highest average values and lowest standard
deviations for recall, F1-Score, and IoU in the trunk
segmentation. It shows the difficulty in achieving
better performance when incorporating the attention
mechanism into the model architecture since it makes
the model unstable. However, the joint convolutions
enhance the convergence towards higher scores and
make the model more steady since the standard de-
viation is the lowest for recall, F1-Score, and IoU.
Nevertheless, standard U-Net performed best in this
scenario despite the moderate precision, recall, and
F1-Score increase.
4.3 Visual Quality
Figures 4 and 5 exhibit segmentation results obtained
by each ASPP variant. In the canopy segmentation,
ASPP
4
revealed favorable and more consistent results
in shaded regions of the tree canopy (see Figure 4f in
VISAPP 2025 - 20th International Conference on Computer Vision Theory and Applications
272
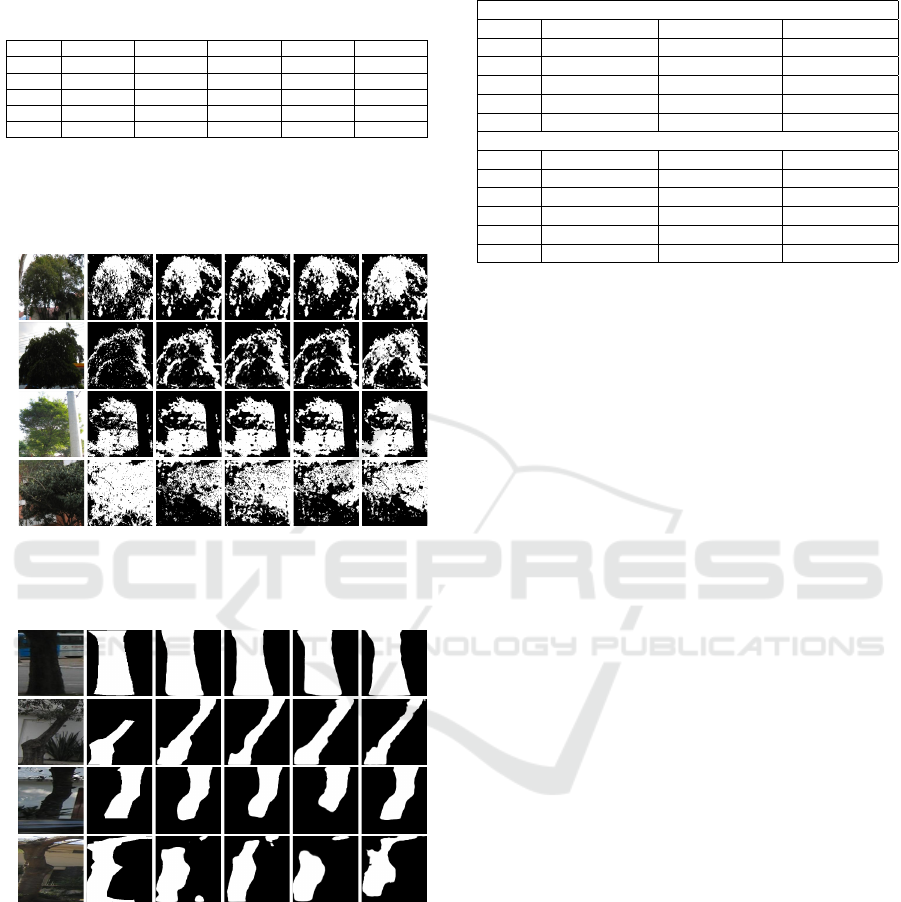
Table 6: Average metrics attained for the test set in the stem
segmentation. Notice that the zero standard deviation val-
ues concerning the loss across all models are due to a single
training session.
Model Loss Precision Recall F1-score IoU
U-Net 0.002±0.0 0.94±0.09 0.93±0.06 0.93±0.06 0.87±0.09
ASPP
1
0.006±0.0 0.89±0.12 0.91±0.08 0.89±0.08 0.82±0.12
ASPP
2
0.006±0.0 0.92±0.10 0.87±0.10 0.89±0.08 0.80±0.12
ASPP
3
0.006±0.0 0.93±0.09 0.85±0.13 0.88±0.11 0.79±0.14
ASPP
4
0.005±0.0 0.90±0.12 0.92±0.07 0.90±0.08 0.83±0.11
rows I, II, and IV). Furthermore, the same model also
yielded superior performance in the trunk segmenta-
tion task, as depicted in Figure 5, closely resembling
the ground-truth images.
(a) (b) (c) (d) (e) (f)
I)
II)
III)
IV)
Figure 4: Segmentation results obtained by each ASPP
model for the canopy segmentation: a) original image; b)
ground-truth; c) ASPP
1
; d) ASPP
2
; e) ASPP
3
; f) ASPP
4
.
(a) (b) (c) (d) (e) (f)
I)
II)
III)
IV)
Figure 5: Segmentation results obtained by each ASPP
model for the trunk segmentation: a) original image; b)
ground-truth; c) ASPP
1
; d) ASPP
2
; e) ASPP
3
; f) ASPP
4
.
4.4 Computational Cost
Table 7 presents the network sizes and correspond-
ing prediction times in seconds for processing images
from the test image set in CPU and GPU devices. No-
tice that the computational time was computed from
predictions on all test set images simultaneously.
As shown in Table 7, the ASPP models achieve
Table 7: Networks’ size and computational time (in sec-
onds) of each model.
Canopy
Model # of parameters CPU time GPU time
U-Net 8,642,273 26.6335±2.4848 1.7089±2.1026
ASPP
1
3,292,991 35.7923±0.6979 3.2288±1.8196
ASPP
2
3,467,813 43.1803±0.9706 2.9729±0.3650
ASPP
3
4,040,133 52.0310±0.6058 3.6166±0.3785
ASPP
4
3,865,311 45.0037±0.9407 3.3707±0.2416
Trunk
Model # of parameters CPU time GPU time
U-Net 8,642,273 17.4686±1.4002 1.4828±2.2188
ASPP
1
3,292,991 24.5734±1.3276 2.4430±1.9886
ASPP
2
3,467,813 29.5044±1.2900 2.0591±0.3595
ASPP
3
4,040,133 36.6795±1.1001 2.5056±0.3594
ASPP
4
3,865,311 30.2430±0.7033 2.3013±0.2326
lower parameter counts when compared to the stan-
dard U-Net architecture. Additionally, the models
have significantly fewer parameters than those pre-
sented by Jodas et al. (2023, 2021) in their works on
tree structure segmentation. For comparative anal-
ysis, Jodas et al. (2023) introduced a model with
13,975,139 parameters for tree canopy segmentation,
which attained 0.7337 of Intersection over Union.
Similarly, their approach in 2021 (Jodas et al., 2021)
resulted in a network containing 12,403,679 parame-
ters and an Intersection over Union of 0.8147 for stem
segmentation. In contrast, our proposed architectures,
ASPP
3
and ASPP
4
, while increasing the network size
slightly with minimal additional time for predictions
due to attention mechanisms and joint convolutions,
still require fewer parameters and yield similar accu-
racy compared to the models of the previous stud-
ies described above. In the context of GPU execu-
tion, ASPP
4
exhibits the most consistent device usage
among the other ASPP variants, notably demonstrated
by the lowest standard deviation. Such results show
the promising use of this model in the trunk segmenta-
tion task despite the superior performance attained by
the standard U-Net architecture, which requires more
than twice the number of parameters as ASPP
4
.
5 CONCLUSIONS
Novel strategies for urban forest monitoring have
focused on optimizing tree identification using ad-
vanced deep-learning techniques across various im-
age modalities. While remote sensing and aerial
imagery are common, street-level perspectives like
Google Street View have gained attention for tree de-
tection and segmentation. Cataloging trees through
street-view analysis has become a promising ap-
proach, with future research expected to target spe-
cific tree components using this imaging modality.
This study proposed a deep-learning strategy for
Customized Atrous Spatial Pyramid Pooling with Joint Convolutions for Urban Tree Segmentation
273

segmenting tree canopies and trunks in street-view
images. The approach integrated attention mecha-
nisms and joint convolutions with atrous spatial pyra-
mid pooling into the U-Net architecture. Joint con-
volutions enhanced convergence, showing competi-
tive semantic segmentation results while significantly
reducing network parameters compared to baseline
methods.
Future studies will be conducted on assembling
larger and richer datasets to capitalize on research in
tree structure segmentation, enhance the model’s ca-
pacity, and further propose a computer-aided method
to aid and accelerate the practices on tree structural
analysis.
ACKNOWLEDGEMENTS
This study was financed, in part, by the S
˜
ao Paulo Re-
search Foundation (FAPESP), Brasil. Process Num-
bers #2013/07375-0, #2014/12236-1, #2019/07665-4,
#2019/18287-0, #2023/10823-6, and #2023/14427-8.
The authors also thank CNPq grants 308529/2021-9
and 400756/2024-2, and Petrobras grant 2023/00466-
1.
This work was jointly supported by the Office of
Naval Research (ONR) with grant No. N62909-24-
1-2012 and by the Air Force Office of Scientific Re-
search (AFOSR).
REFERENCES
Chen, L.-C., Papandreou, G., Kokkinos, I., Murphy, K., and
Yuille, A. L. (2017). Deeplab: Semantic image seg-
mentation with deep convolutional nets, atrous con-
volution, and fully connected CRFs. IEEE transac-
tions on pattern analysis and machine intelligence,
40(4):834–848.
Chollet, F. (2017). Xception: Deep learning with depthwise
separable convolutions. In Proceedings of the IEEE
conference on computer vision and pattern recogni-
tion, pages 1251–1258.
de Lima Ara
´
ujo, H. C., Martins, F. S., Cortese, T. T. P.,
and Locosselli, G. M. (2021). Artificial intelligence in
urban forestry—A systematic review. Urban Forestry
& Urban Greening, 66:127410.
Deluzet, M., Erudel, T., Briottet, X., Sheeren, D., and Fabre,
S. (2022). Individual Tree Crown Delineation Method
Based on Multi-Criteria Graph Using Geometric and
Spectral Information: Application to Several Temper-
ate Forest Sites. Remote Sensing, 14(5):1083.
Guo, M.-H., Xu, T.-X., Liu, J.-J., Liu, Z.-N., Jiang, P.-T.,
Mu, T.-J., Zhang, S.-H., Martin, R. R., Cheng, M.-M.,
and Hu, S.-M. (2022). Attention mechanisms in com-
puter vision: A survey. Computational Visual Media,
pages 1–38.
Jodas, D. S., Brazolin, S., Yojo, T., De Lima, R. A., Velasco,
G. D. N., Machado, A. R., and Papa, J. P. (2021). A
Deep Learning-based Approach for Tree Trunk Seg-
mentation. In 2021 34th SIBGRAPI Conference on
Graphics, Patterns and Images (SIBGRAPI), pages
370–377. IEEE.
Jodas, D. S., Passos, L. A., Velasco, G. D. N., Longo, M.
H. C., Machado, A. R., and Papa, J. P. (2022a). Multi-
class Oversampling via Optimum-Path Forest for Tree
Species Classification from Street-view Perspectives.
In To appear in 35th Conference on Graphics, Pat-
terns and Images (SIBGRAPI), pages 1–6. IEEE.
Jodas, D. S., Velasco, G. D. N., de Lima, R. A., Machado,
A. R., and Papa, J. P. (2023). Deep learning seman-
tic segmentation models for detecting the tree crown
foliage. In Radeva, P., Farinella, G. M., and Boua-
touch, K., editors, Proceedings of the 18th Interna-
tional Joint Conference on Computer Vision, Imag-
ing and Computer Graphics Theory and Applica-
tions, VISIGRAPP 2023, Volume 4: VISAPP, Lis-
bon, Portugal, February 19-21, 2023, pages 143–150.
SCITEPRESS.
Jodas, D. S., Yojo, T., Brazolin, S., Velasco, G. D. N., and
Papa, J. P. (2022b). Detection of Trees on Street-View
Images Using a Convolutional Neural Network. Inter-
national Journal of Neural Systems, 32(01):2150042.
Khan, S., Naseer, M., Hayat, M., Zamir, S. W., Khan, F. S.,
and Shah, M. (2021). Transformers in vision: A sur-
vey. ACM Computing Surveys (CSUR).
Kingma, D. P. and Ba, J. (2014). Adam: A
method for stochastic optimization. arXiv preprint
arXiv:1412.6980.
Loesdau, M., Chabrier, S., and Gabillon, A. (2017). Chro-
matic Indices in the Normalized rgb Color Space.
In 2017 International Conference on Digital Image
Computing: Techniques and Applications (DICTA),
pages 1–8.
Ronneberger, O., Fischer, P., and Brox, T. (2015). U-net:
Convolutional networks for biomedical image seg-
mentation. In International Conference on Medical
image computing and computer-assisted intervention,
pages 234–241. Springer.
Woo, S., Park, J., Lee, J.-Y., and Kweon, I. S. (2018).
CBAM: Convolutional Block Attention Module. In
Proceedings of the European Conference on Com-
puter Vision (ECCV), pages 3–19.
Xu, R. and Wunsch, D. (2005). Survey of clustering al-
gorithms. IEEE Transactions on Neural Networks,
16(3):645–678.
Zhao, H., Morgenroth, J., Pearse, G., and Schindler, J.
(2023). A systematic review of individual tree crown
detection and delineation with convolutional neural
networks (cnn). Current Forestry Reports, pages 1–
22.
Zhou, Y., Wang, L., Jiang, K., Xue, L., An, F., Chen, B.,
and Yun, T. (2020). Individual tree crown segmenta-
tion based on aerial image using superpixel and topo-
logical features. Journal of Applied Remote Sensing,
14(2):022210.
VISAPP 2025 - 20th International Conference on Computer Vision Theory and Applications
274
