
Preliminary Technical Test of Different Physiological
Modalities to Detect Workload in Humans in Microgravity
Judith Bütefür
1
and Elsa Andrea Kirchner
1,2 a
1
Institute of Medical Technology Systems, University of Duisburg-Essen, Duisburg, Germany
2
Robotics Innovation Center, German Research Center for Artificial Intelligence (DFKI GmbH), Bremen, Germany
Keywords: Workload, Multimodal, EEG, ET, ECG, RESP, Microgravity, Parabolic Flight, ZeroG.
Abstract: In this work we aim to investigate whether eye tracking, electrocardiogram and respiration are good measures
to detect workload (WL) of humans in microgravity. To this end, an auditory N-back study was performed
during a parabolic flight in microgravity and during a control condition in the lab under Earth gravity by 3
operators of the experiment. The data were analysed regarding their predictive nature to estimate WL. The
results show that none of the parameters are suitable for WL detection in humans due to the very short
microgravity phases (~22s) and due to scopolamine intake. Nevertheless, some parameters are potentially
suitable for longer stay in microgravity. In addition, the results of this study were compared with the results
of a previously published electroencephalogram (EEG) analysis on the same data set. This comparison shows
that EEG is a more promising predictor modality for WL. In future work, we will conduct another study to
extend the number of operators. Different conditions than short term parabolic flights and measurement with
longer duration are needed to investigate the stability of WL prediction.
1 INTRODUCTION
To be aware of the overall workload (WL) level of a
person during a given task is helpful in different
areas. It is an advantage to know the overall WL level
of a person to prevent mental disorders as, for
example, burnout due to permanent stress and
overload (Greif & Bertino, 2022). The tendency
towards mental disorders increased in the past (World
Health Organization, 2024) and this must be avoided
as much as possible. To protect people working in
safety-critical environments, they must be better
monitored in terms of WL. In space it is important to
know the WL level of each astronaut, since a higher
level of WL is related to a higher risk to make
mistakes (Morris & Leung, 2006). For astronauts it is
important not to make mistakes during complex tasks
outside the ISS, as this can quickly end fatally. During
space missions people experience microgravity, so
gravitational conditions are different from those on
Earth. As people are used to perform their tasks in
Earth gravity, microgravity will likely have an impact
on the overall WL since astronauts are not used to it
in general. The Multiple Resource Model by Wickens
a
https://orcid.org/0000-0002-5370-7443
(2008) shows that many different dimensions have an
influence on the overall WL of a person. The model
shows that spatial activities and visual processing
have an influence on the WL, which can be
transferred to objects in microgravity that behave
significantly differently from those in Earth gravity.
As a result, the astronauts need more resources to
analyse how the objects behave, which implies a
higher WL. Because of all these aspects, the effect of
changing gravitational conditions on the WL is
important. To introduce different gravitational
conditions for short periods of time, especially
microgravity, without going in space, it is possible to
carry out parabolic flights. However, these flights are
very expensive and the time available in microgravity
is comparatively short. For this, an airplane (A310
Zero-G) based at Mérignac International Airport in
Bordeaux, France follows a given flight protocol,
which is shown in Figure 1. Each flight begins with a
test parabola after launch, followed by 30 parabolas
that can be used to conduct experiments. Each
parabola lasts about 70s, starting with about 20-25s
hyper-gravity (1.8G), followed by 21-22 seconds
microgravity (0G), which is highlighted in grey in
Bütefür, J. and Kirchner, E. A.
Preliminary Technical Test of Different Physiological Modalities to Detect Workload in Humans in Microgravity.
DOI: 10.5220/0013092600003911
Paper published under CC license (CC BY-NC-ND 4.0)
In Proceedings of the 18th International Joint Conference on Biomedical Engineering Systems and Technologies (BIOSTEC 2025) - Volume 1, pages 837-845
ISBN: 978-989-758-731-3; ISSN: 2184-4305
Proceedings Copyright © 2025 by SCITEPRESS – Science and Technology Publications, Lda.
837
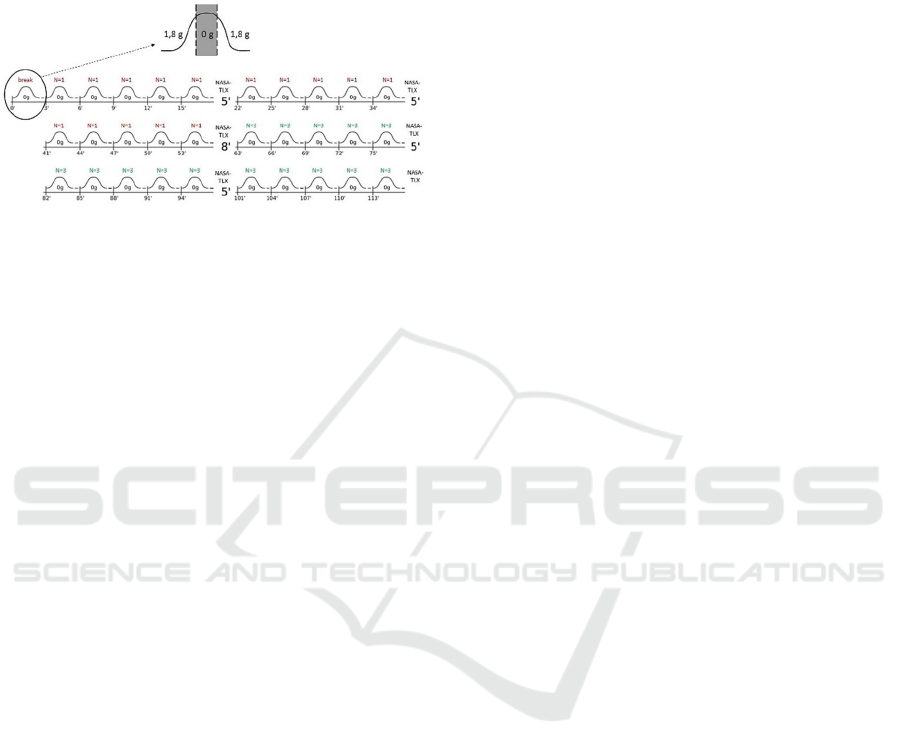
Figure 1, and ends up with again 20-25s hyper-gravity
(1.8G). Before the next parabola begins, there is a
break of 90s under Earth gravity (1G). After each set
of 5 parabolas there is a longer break of 5 or 8 minutes
after 15 parabolas. (Novespace, 2011).
Figure 1: Experimental design (Bütefür, Trampler, &
Kirchner, 2024).
The literature shows that WL can be determined
based on different physiological signals.
In this work we will investigate, if the prediction
of changes in WL in microgravity is possible using
the following modalities:
• Eye Tracking (ET),
• Electrocardiogram (ECG) and
• Respiration (RESP)
ET is a very common modality for WL estimation
in Earth gravity. ECG and RESP are very interesting
to compare for Earth gravity and microgravity, since
different gravity conditions have an impact to the
cardiovascular system of a person (Schlegel, et al.,
1998) as well.
The aim of this paper is to see, if measuring the
three mentioned modalities is possible in
microgravity during a parabolic flight and compare
the results to the results of electroencephalogram
(EEG) measurements recorded in the same study,
which are already analysed (Bütefür, Trampler, &
Kirchner, 2024). Therefore, the data from the
parabolic flight will be analysed in terms of WL and
compared to the analysed data from the control
condition in the lab. A comparison to the results from
the EEG analysis will also be done. It was already
shown in Bütefür et al. (2024) that it is possible to
analyse EEG data to determine WL in microgravity.
Therefore, the change in frequency bands was
analysed.
2 WORKLOAD DETECTION
BASED ON DIFFERENT
MODALITIES
This section provides information about the
modalities ET, ECG and RESP with respect to the
expected changes due to changing levels of WL.
In the following section the levels of WL are
divided into “lower” and “higher” WL. This always
means the distinction between the same task (auditory
N-back) with a lower and higher WL condition.
2.1 Eye Tracking
ET measures the eye movements during an
experiment with use of infrared light. For WL
detection in humans, it is a common modality, if the
experimental setup is designed carefully. If too many
eye movements are caused by the experimental setup,
the ET data can be distorted. Because it is not clear
whether the eye movements are caused by the change
of WL or the experimental setup. The same applies to
changing lightning conditions. Some of the parameters
that can be extracted from ET data to analyse WL are,
for example, the fixation duration, pupil dilation or the
blink frequency in a certain time window (Singh,
Ponzoni Carvalho Chanel, & Roy, 2021; Volden,
Alwis, de Viveka, & Fostervold, 2018).
Some groups reported an increase of the pupil
dilation if the WL is higher in comparison to lower
WL conditions (Grimmer, Simon, & Ehlers, 2021;
Singh, Ponzoni Carvalho Chanel, & Roy, 2021;
Volden, Alwis, de Viveka, & Fostervold, 2018).
Other changes of parameters in higher WL condi-
tions are a higher blink frequency (more eye blinks in
a certain amount of time) and an increase of the peak
blink duration as well as the number of eye blinks
(Volden, Alwis, de Viveka, & Fostervold, 2018).
2.2 Electrocardiogram
The ECG is a modality that is often measured in the
context of physical demanding tasks, as these have a
strong influence on the cardiovascular system.
However, there are also some parameters that change
when the subject performs cognitively demanding
tasks.
Volden et al. (2018) reported a significant higher
ratio of low frequency (LF) parts to high frequency
(HF) parts of the heart rate (HR) for higher WL in
comparison to lower WL conditions.
Singh et al. (2021) reported a significant increase
in the HR and a significant decrease in the heart rate
BIOSIGNALS 2025 - 18th International Conference on Bio-inspired Systems and Signal Processing
838

variability (HRV). Ding et al. (2020) reported an
almost significant increase in the HR for high WL in
comparison to low WL, whereas there was no
significant change in HR between low and medium
WL level.
2.3 Respiration
RESP is also a modality which is often used in the
context of physical demanding tasks as it changes
significantly, in this case, as does the ECG. But there
is also one parameter of respiration reported, that
changes due to changing cognitive WL. Ding et al.
(2020) reported a significant lower respiration rate
(RR) for lower WL in comparison to higher WL.
3 METHODS
In this section the dataset will be presented in general
as well as the experimental setup and procedure. A
detailed description can be found in the main study of
Bütefür et al. (2024). The section also contains
information about the data recording of ET, ECG and
RESP, as well as pre-processing and the data analysis.
3.1 Dataset
The dataset consists of two studies. The first study
took place during a parabolic flight campaign (flight
environment) organized by DLR Space Agency and
Novespace. The experimental setup during the flight
is shown in Figure 2. The second study was used as a
control condition and took place in the laboratories of
the University of Duisburg-Essen (lab environment).
The experimental setup in the lab is similar to the
setup in flight (cf. Figure 2), except the operator is
sitting on a chair and not on the ground and the
response button was a key on the keyboard in front of
the operator.
3.2 Participants
EEG, ECG, RESP and ET data for both studies were
measured from three healthy, native German speaking
team members who were operators of the experiment
(1 male, average age = 43 ± 12,7). The study was a
purely technical test, which is why no ethic statement
was required under French law. For the parabolic flight
all operators took scopolamine (a medication to
prevent motion sickness) on a voluntary basis.
Operator AE41D had to be excluded for the
analysis, as the measurement took place on two days
due to technical problems with the aircraft during the
first flight and was therefore not comparable to the
analysis of the other operators who did the whole
study in one session.
Figure 2: Experimental setup (adapted from (Bütefür,
Trampler, & Kirchner, 2024)).
3.3 Experimental Setting
The operators had to perform an auditory N-back task
during the microgravity phases in the plane (see Figure
1 depicting microgravity phases and experimental
design). The operator must listen to numbers (0, 3, 4,
7, and 9 spoken in German) presented as stimuli via
headphones. During the first 15 parabolas
(15*22sec=5.5min) the operators had to perform an
N=1 or N=2 task, which corresponds to low WL
condition. During the second half of the flight
(parabolas 16-30) operators had to perform an N=3
task to increase the difficulty of the task and
corresponds to high WL condition. The relation of
targets to standards was 1:6 for 135 stimuli in total
under each condition. The stimulus interval was 600ms
and the inter-stimulus interval 1800ms. Each run was
followed by a ~90s break. Each set consisted of 5 runs
followed by a longer break of 5 or 8 minutes, where the
operator had to fill out the NASA-TLX questionnaire.
The operators had to perform 3 sets for each condition.
Each set consists of 5 runs (parabolas).
The flight procedure was replicated for the control
conditions in the lab, but the breaks were shortened
from 90 seconds to 20 seconds and from 5 or 8
minutes to 90 seconds.
3.4 Data Recording and Pre-Processing
In the following paragraphs the data recording of the
different modalities is described as well as the pre-
processing.
ECG and RESP data were recorded synchronously
to EEG data with the same system. Therefore, each
Preliminary Technical Test of Different Physiological Modalities to Detect Workload in Humans in Microgravity
839

operator was prepared with the ANT eego mini
(https://www.ant-neuro.com/products/ eego_24),
which measured ECG and RESP with a sampling
frequency of 500 Hz. ECG was measured with 3
channel lead and RESP with a respiration belt. All
operators were prepared with a 24-channel dry
electrode headset as well. EEG data recording is
described more detailed in Bütefür et al. (2024).
During the experiment the operator was sitting in front
of the Tobii Pro Fusion Eye Tracker
(https://www.tobii.com/products/eye-trackers/screen -
based/tobii-pro-fusion) with a sampling frequency of
250 Hz during the parabolic flight and 120 Hz in the
lab and an accuracy of 0.3°. Data recording took place
using the Tobii Pro SDK (Tobii AB, 2024). During the
parabolic flight a synchronized inertial measurement
unit (IMU) measured the acceleration data.
Pre-processing for ECG and RESP data was done
with the python-library MNE. A bandpass filter
between 0.1 and 45 Hz was applied. Microgravity
phases during the parabolic flight were detected using
an IMU. This was used to mark the microgravity
phases within ECG, RESP, and ET data for evaluation.
3.5 ET Analysis
For ET analysis the data were segmented into single
runs (1 run = 1 parabola). The analysis was done in
python based on the eye position data recorded from
the eye tracker. The validity of the ET data was
checked before the analysis could start. The validity
was calculated based on the detection percentage of
pupil images for each eye during microgravity
phases.
The number of blinks, blink frequency and
maximum blink duration was also calculated from the
validity parameters, as no eye image could
recognized when blinking. A blink was recognized if
the no eye images could be detected for the left and
the right eye for 100-500ms and anything above
500ms was considered as drowsiness (Aksu, Cakit, &
Dagdeviren, 2024). The blink frequency was
calculated using the time between the first and last
blink and the number of blinks. The pupil diameter
was also analysed. This parameter is calculated by the
Tobii Pro SDK (Tobii AB, 2024) during
measurement and can be extracted and analysed from
the data for each eye individually. To analyse the
parameters the median of each run was calculated for
each parameter individually with respect to the
different WL conditions. Also, the median over all
runs for lower and higher WL condition was
calculated for each operator in both environments.
3.6 ECG and RESP Analysis
For ECG and RESP analysis the NeuroKit2 toolbox
(Makowski, et al., 2021) was used.
To analyze the ECG data, the N-back task data
were segmented into epochs of 15s with 10s overlap.
Afterwards, HR was interpolated between R-Peaks
and HRV was calculated using the standard deviation
of RR intervals. LF/HF ratio was also calculated. All
calculations were done using the NeuroKit2 toolbox
(Makowski, et al., 2021).
The median of each parameter and run for lower
WL condition was calculated as well as the median of
each parameter and run for higher WL condition.
Also, the median over all runs for lower and higher
WL condition was calculated for each operator in
both environments.
To analyze the RESP data, the N-back task data
were segmented into epochs of 20s without any
overlap. The inhalation onsets were calculated using
the NeuroKit2 toolbox (Makowski, et al., 2021). The
RR was calculated and the median for each set was
built. An outlier removal was performed, whereby the
90
th
percentile of data was used. Also, the median
over all runs was built for the lower as well as the
higher WL condition.
4 RESULTS
In the following section the results for all modalities
and the different parameters are presented.
4.1 ET Results
The ET data were evaluated with respect to the
validity, number of blinks, blink frequency and the
maximum blink duration.
In Table 1 the percentage of validity is shown for
each operator and for lower and higher WL condition
in both environments (flight and lab).
Table 1: Validity of left and right eye for each operator and
condition in both environments.
Sub
j
ect AC07D BU87D
Validity (%) Left Right Left Right
Lab
Low
WL
81.88 82.44 97.06 96.62
High
WL
82.15 83.94 96.60 96.26
Flight
Low
WL
74.73 71.35 84.46 79.82
High
WL
57.96 52.71 76.00 71.00
BIOSIGNALS 2025 - 18th International Conference on Bio-inspired Systems and Signal Processing
840

The results show an overall validity over 50% for
each WL condition in both environments. The highest
difference between left and right pupil validity is
5.25% for BU87D in flight environment. The smallest
difference is 0.34% for BU87D in lab environment.
The average validity in lab environment is
89.62% ± 7.53%. In flight environment the average
validity is 71.00% ± 10.71%.
The average validity for both eyes for Operator
AC07D is 73.39% ± 12.03% and for BU87D
87.23% ± 10.73%.
For lower WL condition the average validity is
83.55% ± 9.25% and for higher WL condition
77.08% ± 16.12%.
4.1.1 Eye Blinks
In this section the results of all parameters regarding
eye blinks will pe presented. In Figure 4A the
boxplots for the number of eye blinks for all runs and
WL conditions in both environments are shown,
while Figure 4B presents the blink frequency for all
conditions and Figure 4C the maximum blink
duration. The median is marked with a red line. The
absolute number of eye blinks increased for higher
WL condition for each operator in both environments
except for BU87D in the lab environment.
On the contrary the blink frequency decreases for
higher WL condition for each operator in both
condition except for BU87D in the lab environment.
These results are inverted to the number of eye blinks.
Furthermore, for BU87D, the blink frequency in lab
environment for higher WL condition could only be
calculated for one run, as the number of blinks was less
than 2 in all other runs. For this one run the frequency
was higher for higher WL condition in comparison to
lower WL condition. For lower WL condition the
frequency could be calculated for 2 runs.
The pattern of the maximum peak blink duration
is the same as for the number of eye blinks, which
means that the maximum peak blink duration
decreases for higher WL condition in comparison to
lower WL condition for both operators in each
condition except for Operator BU87D in lab
environment, there it remains the same.
4.1.2 Pupil Diameter
The boxplots of the median of pupil diameter per run
for the right eye are illustrated in Figure 4D represent-
tative for both eyes. The median pupil diameter
decreases for higher WL condition in comparison to
lower WL condition for both operators in the flight
environment and increase from lower to higher WL
condition for both operators in the lab environment.
For the right eye the changes were similar.
A)
B)
C)
D)
Figure 3: Eye blink parameters for both operators under
each condition; A) Number of eye blinks; B) Blink
frequency; C) Maximum blink duration.
Preliminary Technical Test of Different Physiological Modalities to Detect Workload in Humans in Microgravity
841
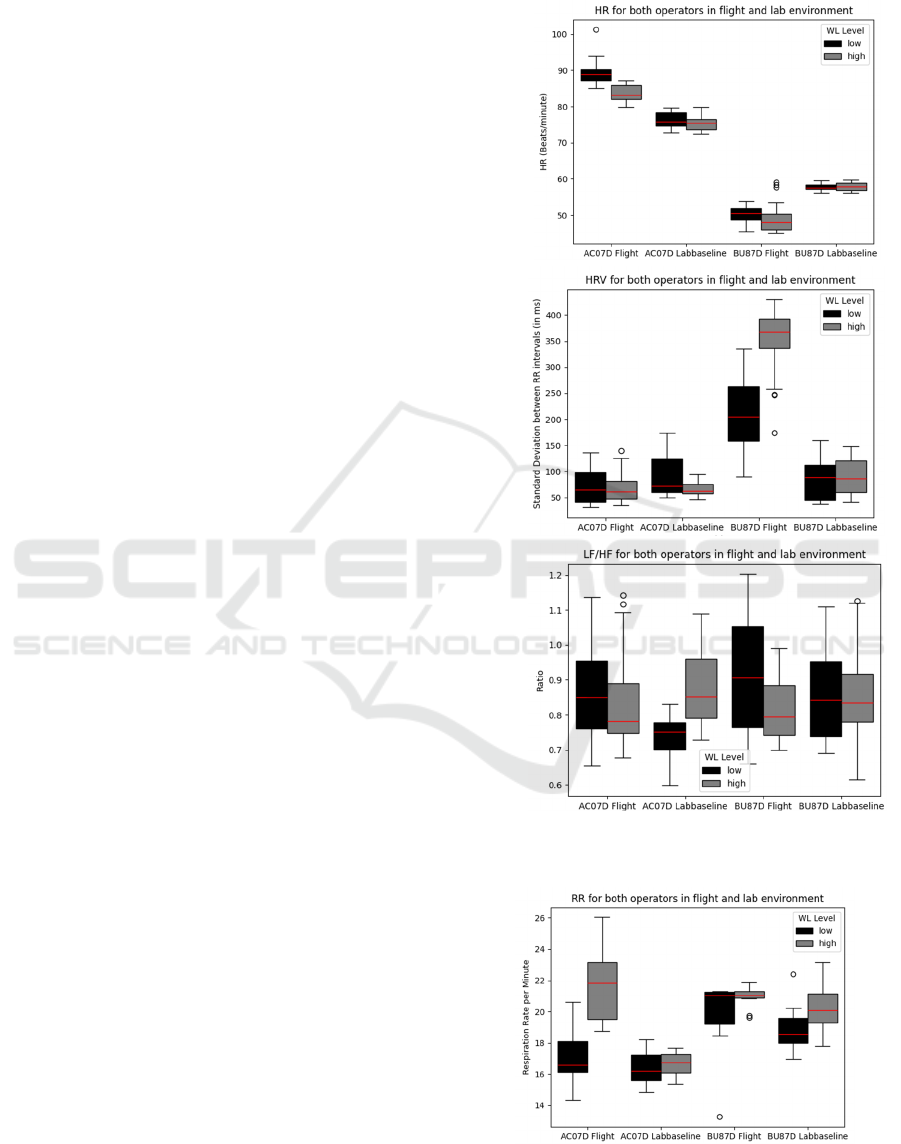
4.2 ECG Results
In the following section the results of the ECG
analysis will be presented.
Figure 4 shows the results for both operators in
each environment. In Figure 4A the boxplots of the
median HR for each run and operator under lower and
higher WL condition is shown. The HR decreases for
both operators in the flight environment and for
AC07D in the lab environment for higher WL
condition in comparison to lower WL condition. For
Operator BU87D in the lab environment the median
HR decreases for higher WL condition in comparison
to lower WL condition (cf. Fig. 4A).
Figure 5B shows the boxplots of the median HRV
of each run for lower and higher WL condition for
each operator in both environments. The median
HRV over all runs decreases for higher WL condition
in comparison to lower WL condition for both
operators in lab environment and for AC07D in flight
environment. For BU87D in flight environment the
median HRV over all sets increased for higher WL
condition in comparison to lower WL condition.
The boxplots of the median of the LF/HF ratio for
each run and operator under lower and higher WL
condition are depicted in Figure 4C. It decreases for
both operators in the flight environment and for
BU87D in the lab environment for higher WL
condition in comparison to lower WL condition. For
Operator AC07D in the lab environment the median
LF/HF ratio decreases for the higher WL condition in
comparison to the lower WL condition.
4.3 RESP Results
In the following section the results of the RESP
analysis will be presented.
The boxplots of the median RR for each run and
operator in both environments are illustrated in Figure
5. The median RR increases for both operators in both
environments for higher in comparison to lower WL
condition.
5 DISCUSSIONS
The main objective of this paper was to investigate, if
measuring the modalities ET, ECG and RESP is
technically possible in microgravity during a parabolic
flight in a quality that it allows to predict WL levels.
Therefore, the data from the parabolic flight were
analysed in terms of WL and compared to the analysed
data from the control condition in the lab. As a subgoal
the results for ET, ECG and RESP will be compared
with the results from the EEG analysis, which are
already published in Bütefür et al. (2024).
A)
B)
C)
Figure 4: ECG parameter for both operators in each
environment; A) HR; B) HRV; C) LF/HF ratio.
Figure 5: Median RR for each run and operator under both
conditions.
BIOSIGNALS 2025 - 18th International Conference on Bio-inspired Systems and Signal Processing
842

The results of the validity of the ET in Table 1
show that the validity of the data measured in lab
environment was higher with an average validity of
89.62% ± 7.53% than in flight environment with
71.00% ± 10.71%. This is due to the fact, that during
microgravity phases in flight environment the
operator starts floating around. With the given
experimental design, it was not possible to fixate the
operator fully on the plane ground, so the operator
floated out of the region of measurement from the ET.
In lab environment, however, it was not the case since
the operator was sitting on a chair in Earth gravity.
The validity was also not expected to have 100%
because for each eye blink pupil images cannot be
detected. If the validity is compared to the number of
eye blinks (Fig. 4A), the validity is lower for
conditions with a higher number of eye blinks and is
also proportional related to the maximum blink
duration (Fig. 4C), which was expected.
The analysis of the number of eye blinks (cf. Sec.
4.1.1) shows an increase of the number of eye blinks
with an increase of WL condition in both
environments except for BU87D in lab environment
(cf. Fig. 4A). An increase of the number of eye blinks
for increasing WL condition was also expected from
literature (Volden, Alwis, de Viveka, & Fostervold,
2018) and is supported in this study by the higher
validity percentage for lower WL condition (see Tab.
1). However, these results must be viewed with
caution, as the duration of each run was only 22s and
the standard number of blinks per minute are between
2 and 50 (Monster, Chan, & O'Connor, 1978). This
means that if the operator blinks less in general, the
number of blinks over a short period of time is not
representative. As a conclusion, it seems like this
parameter is technically measurable in microgravity,
but within this experimental setup it is very limited
due to the short period of time where it is measured.
The blink frequency was analysed as well (cf. Sec.
4.1.1) and results were contrary to the results of the
number of eye blinks. From literature it was expected
that the blink frequency is increasing with increasing
WL condition (Volden, Alwis, de Viveka, &
Fostervold, 2018), but Figure 4B shows a decrease in
three out of four cases. For the fourth case, BU87D in
lab environment, the median blink frequency
increases, but in most of the runs there were less than
two eye blinks, so it was not possible to calculate the
frequency of eye blinks within these runs, which
means that this result is not representative. As already
discussed before, 22s for each run within this
experiment is not sufficient for analysing changes in
the WL levels of the operators based on ET
parameters. Furthermore, the calculation of the blink
frequency is another limiting factor. Due to long
phases of closed eyes at the beginning of single runs,
as well as inaccuracies of measures due to the onset
of hyper-gravity at the end of each run, the blink
frequency was only calculated in the time between the
first and the last recognised blink. This leads to a low
robustness of the calculation for a small sample size,
which becomes clear due to the large variation of the
calculated frequencies, e.g., for Operator BU87D in
the lab environment (cf. Fig. 4B). Operator AC07D
also shows many outliers in the flight environment,
which indicate this. It seems like this parameter is not
suitable for experimental setups with short-term
measurements independent of the prevailing
gravitational conditions.
The results of the maximum blink duration are
shown in Figure 4C, which illustrates an increase of
the overall median of the maximum blink duration for
higher WL condition in comparison to lower WL
condition in all environments except for BU87D in
lab environment. For BU87D in lab environment the
maximum blink duration decreases. The results are
inhomogeneous which could be due to the small
sample size of only two operators within this study.
Volden et al. (2018) had 21 subjects and removed
four outliers to obtain normal distribution. Also, the
definition of the maximum length of a blink varies. In
this work a blink was defined between 100ms and
500ms (cf. Sec. 3.4) regarding the work of Aksu et al.
(2024), because a typical blink lasts between
100ms – 300ms and blinks about 500ms are
considered as drowsiness (Johns, 2003). Volden et al.
(2018) did not define time limits for eye blinks and
had a mean maximum blink duration of
973.21ms ± 637.66ms, which would be drowsiness
instead of eye blinks regarding the definition within
our work. Therefore, this parameter needs to be more
investigated in Earth gravity as well as in
microgravity with longer periods of measurements
and the given limitations.
The last parameter analysed for ET data was the
pupil diameter for both eyes (Sec. 4.1.2). Figure 4D
depicts that the median pupil diameter over all runs of
the right eye decreases for higher WL condition in
comparison to lower WL condition for both operators
in both environments. For flight environment the
decrease seems higher and could be explained by the
use of scopolamine since ophthalmic adverse effects
are expected with that (Merck & Co., Inc., 2024). The
pupil diameter seems also not to be a suitable
parameter in microgravity with scopolamine intake
and also need further tests for Earth gravity.
The HR was analysed from ECG data with respect
to the WL conditions (Fig. 5A). The HR decreased for
Preliminary Technical Test of Different Physiological Modalities to Detect Workload in Humans in Microgravity
843

both operators for higher WL condition in
comparison to lower WL condition, which was not
expected from literature (Ding, Cao, Duffy, Wang, &
Thang, 2020; Singh, Ponzoni Carvalho Chanel, &
Roy, 2021). Due to these results, it is not possible to
decide if the HR is a suitable parameter for WL
detection in microgravity since with the sample size
of two operators it was not even possible to reproduce
the results from Ding et al. (2020) in Earth gravity.
For the HRV the results are very similar to those
for HR. Figure 5B shows that only for Operator
AC07D in the lab environment the HRV slightly
decreases for higher WL condition in comparison to
lower WL condition as it was expected from literature
(Singh, Ponzoni Carvalho Chanel, & Roy, 2021). For
Operator BU87D in the flight environment the HRV
increased for higher in comparison to lower WL
condition, which was not expected. Figure 5B also
illustrates that the median HRV over all runs for
Operator BU87D in flight environment is
unexpectedly high. Therefore, the signal was visually
checked and the calculation was correct. The
unexpected high HRV for BU87D in flight
environment could be affected by use of scopolamine
since one of the adverse reactions are also cardiac
arrhythmias (Merck & Co., Inc., 2024). Due to this
fact, HRV seems not to be suitable for WL detection
in microgravity by use of scopolamine.
The results of the LF/HF ratio analysis, which are
presented in Figure 5C, show also similar results to
HR and HRV. Only for Operator AC07D in the lab
environment the LF/HF ratio is increasing from lower
to higher WL as expected in literature (Volden,
Alwis, de Viveka, & Fostervold, 2018). As already
mentioned before, because of scopolamine intake and
adverse reactions the LF/HF ratio also seems not to
be a suitable parameter for WL detection under
scopolamine.
Figure 5 shows that the RR increases for both
operators in both environments for higher in
comparison to lower WL condition as expected in
literature (Ding, Cao, Duffy, Wang, & Thang, 2020).
But only for Operator AC07D in flight environment
the increase seems relevant, as for the other
conditions the overall median remains almost the
same. Data from a longer period of time is required to
analyse the RR because the frequency of RESP is low
in comparison to the length of one run. It seems like
that RR is not a suitable parameter for short term
measurement in microgravity. Nevertheless, it should
be analysed for longer measurement durations.
After analysing all mentioned parameters, it can
be summarised that none of the parameters would be
suitable for WL detection in humans in the very short
microgravity phases (~22s) and using scopolamine
for the described experimental setting. For the HR
and RR more data would be needed to reproduce the
results from literature also in Earth gravity.
As a subgoal we wanted to compare the results of
this work to the results of the EEG analysis. In the
work of Bütefür et al. (2024) the EEG data of the
study were analysed in the frequency domain. To this
end, the single frequency bands were compared
regarding increasing or decreasing power spectral
density for changing WL conditions. The conclusion
of the analysis was that dry electrode headsets could
be a promising alternative for the detection of WL in
microgravity if the headset fits the subject.
In this work we could not show a suitable
parameter for analysing WL for the mentioned
experimental setup.
In summary, comparing the results of this work
with former results, EEG frequency bands for the
detection of WL in microgravity with scopolamine
intake and short-term measurements is the most
promising approach, as it brings the only reliable
results.
For future work another experimental setting
should be set up where longer measuring durations
are possible so that the HR and RR, as well as the ET
parameter could be analysed more detailed, and the
state of the art could be reproduced to verify the
parameters in microgravity. The measurement period
during parabolic flights is pretty fixed so that another
possibility to introduce microgravity needs to be
found. Also, more operators should be included to
minimize the effect of individuality in humans and a
statistical analysis could be performed. Scopolamine
intake should be avoided as well.
6 CONCLUSIONS
In this study we investigated whether the use of the
modalities ET, ECG and RESP could be a viable way
to detect WL of humans in microgravity. Our results
suggests that under scopolamine and for short-term
measurements only EEG data brings results
comparable to the control condition in Earth gravity.
Therefore, we would suggest using EEG
measurements for WL detection as they bring the
most stable results as shown in an earlier published
work (Bütefür, Trampler, & Kirchner, 2024). As a
next step a larger sample size of operators is needed.
Also, the experimental setup needs to be adapted to
get data from a longer period to investigate ET, ECG
and RESP data more detailed.
BIOSIGNALS 2025 - 18th International Conference on Bio-inspired Systems and Signal Processing
844

ACKNOWLEDGEMENTS
We would like to express our gratitude to all the
operators of the study, as well as Marc Tabie and
Mathias Trampler, who setup the experiment. We
would also like to thank DLR Space Agency for
funding our experiments during the 42
nd
parabolic
flight campaign in Bordeaux, France. The work was
supported by the German Federal Ministry for
Economic Affairs and Climate Action (BMWK)
under the grant number FKZ 50RP2270A (UDE) and
FKZ 50RP2270B (DFKI) in the project GraviMoKo.
REFERENCES
Aksu, S., Cakit, E., & Dagdeviren, M. (2024). Mental
Workload Assessment Using Machine Learning
Techniques Based on EEG and Eye Tracking Data.
Applied Sciences, pp. 2282, doi: https://doi.org/10.33
90/app14062282.
Bütefür, J., Trampler, M., & Kirchner, E. (2024,
Decemeber). Technical Test of a Dry Electrode Headset
for EEG Measurement in Microgravity. In M. Guarino,
Biomedical Engineering Systems and Technologies.
BIOSTEC 2024. Communications in Computer and
Information Science. Springer (to be published).
Ding, Y., Cao, Y., Duffy, V. G., Wang, Y., & Thang, X.
(2020). Measurement and identification of mental
workload during simulated computer tasks with
multimodal methods ans machine learning. Ergonomics
63 (7), pp. 896-908, doi: 10.1080/00140139.2020.17
59699.
Greif, S., & Bertino, M. (2022). Burnout: Characteristics
and Prevention in Coaching. In S. Greif, H. Möller, W.
Scholl, J. Passmore, & F. Müller, International
Handbook of Evidence-Based Coaching. Springer,
Cham. doi: 10.1007/978-3-030-1938-5_9.
Grimmer, J., Simon, L., & Ehlers, J. (2021). The Cognitive
Eye: Indexing Oculomotor Functions for Mental
Workload Assessment in Cognition-Aware Systems.
Extended Abstracts of the 2021 CHI Conference on
Human Factors in Computing Systems, pp. 1-6.
Johns, M. (2003). The amplitude velocity ratio of blinks: A
new method for monitoring drowsiness. Sleep .
Makowski, D., Pham, T., Lau, Z., Brammer JC, Lespinasse
, F., Pham, H., . . . Chen, S. (2021). Neurokit2: A Python
toolbox for neurophysiological signal processing.
Behavior Research Methods, 53(4), pp. 1689-1696,
https://doi.org/10.3758/s13428-020-01516-y.
Merck & Co., Inc. (2024). Merck Manual Professional
Version. Retrieved from https://www.merckmanuals.
com/professional/injuries-poisoning/motion-sickness/
motion-sickness?query=scopolamine#Diagnosis_v111
5169
Monster, A., Chan, H., & O'Connor, D. (1978). Long-term
trends in human eye blink rate. Biotelemetry and
Patient Monitoring, 5(4), pp. 206-222, PMID: 754827.
Morris, C. H., & Leung, Y. K. (2006). Pilot mental
workload: how well do pilots really perform?
Ergonomics 49 (15), pp. 1581-1596, doi: 10.1080/0014
01306008579787.
Novespace. (2011). 42nd DLR parabolic flight campaign
(VP179) - Practical and technical information.
Schlegel, T. T., Benavides, E. W., Barker, D. C., Brown, T.
E., Harm, D. L., DeSilva, S. J., & Low, P. A. (1998).
Cardiovascular and Valsalva responses during
parabolic flight. Journal of applied physiology, pp.
1957-1965, doi: 10.1152/jappl.1998.85.5.1957.
Singh, G., Ponzoni Carvalho Chanel, C., & Roy, R. N.
(2021). Mental Workload Estimation Based on
Physiological Features for Pilot-UAV Teaming
Applications. Frontiers in Human Neuroscience, pp.
22-28, doi: 10.3389/fnhum.2021.692878.
Tobii AB. (2024). Tobii Pro Toolkit tobii_research V2.0.
Retrieved from http://www.tobii.com/
Volden, F., Alwis, E., de Viveka, & Fostervold, K.-I.
(2018). Human Gaze-Parameters as an Indicator of
Mental Workload. Proceedings of the 20th Congress of
the International Ergonomics Association (IEA 2018).
Volume X: Auditory and Vocal Ergonomics, Visual
Erfonomics, Psychophysiology in Ergonomics,
Ergonomics in Advanced Imaging, pp. 209-215.
Wickens, C. D. (2008). Multiple resources and mental
workload.
Human Factors 50 (3), pp. 449-455, doi:
10.1518/001872008X288394.
World Health Organization. (2024, September 26). Mental
disorders. Retrieved from https://www.who.int/news-
room/fact-sheets/detail/mental-disorders
Preliminary Technical Test of Different Physiological Modalities to Detect Workload in Humans in Microgravity
845
