
Mental Wellbeing at Sea: A Prototype to Collect Speech Data
in Maritime Settings
Pascal Hecker
1,2 a
, Monica Gonzalez-Machorro
1,3 b
, Hesam Sagha
1 c
, Saumya Dudeja
1 d
,
Matthias Kahlau
1 e
, Florian Eyben
1 f
, Bj
¨
orn W. Schuller
1,3,4 g
and Bert Arnrich
2 h
1
audEERING GmbH, Gilching, Germany
2
Digital Health – Connected Healthcare, Hasso Plattner Institute, University of Potsdam, Germany
3
CHI – Chair of Health Informatics, MRI, Technische Universit
¨
at M
¨
unchen, Germany
4
GLAM – Group on Language, Audio, & Music, Imperial College, U.K.
{phecker, mgonzalez, hsagha, sdudeja, mkahlau, fe}@audeering.com, schuller@tum.de, bert.arnrich@hpi.de
Keywords:
Mental Wellbeing, Stress, Seafarer, Speech Data Recording, Speech Data Analysis.
Abstract:
The mental wellbeing of seafarers is particularly at risk due to isolation and demanding work conditions.
Speech as a modality has proven to be well-suited for assessing mental health associated with mental well-
being. In this work, we describe our deployment of a speech data collection platform in the noisy and iso-
lated environment of an oil tanker and highlight the associated challenges and our learnings. We collected
speech data consisting of 378 survey sessions from 25 seafarers over nine weeks. Our analysis shows that
self-reported mental wellbeing measures were correlated with speech-derived features and we present initial
modelling approaches. Furthermore, we demonstrate the effectiveness of audio-quality-based filtering and de-
noising approaches in this uncontrolled environment. Our findings encourage a more fine-grained monitoring
of mental wellbeing in the maritime setting and enable future research to develop targeted interventions to
improve seafarers’ mental health.
1 INTRODUCTION
The maritime industry, despite its vital role in global
trade, often overlooks the psychological toll on its
workforce. Seafarers, in particular, are at risk due
to isolation and demanding work conditions (Brooks
and Greenberg, 2022). The numerous occupation-
related factors include long times away from home
and friends and family, heterogeneous crews with sev-
eral cultural backgrounds clashing, and a high work-
load with no conventional leisure time on the week-
ends.
To support this vulnerable occupation group, the
first step would be to understand the factors contribut-
ing to their wellbeing. Due to the long time abroad,
a
https://orcid.org/0000-0001-6604-1671
b
https://orcid.org/0009-0008-9188-058X
c
https://orcid.org/0000-0002-8644-9591
d
https://orcid.org/0009-0003-5397-1759
e
https://orcid.org/0009-0004-7017-541X
f
https://orcid.org/0009-0003-0330-8545
g
https://orcid.org/0000-0002-6478-8699
h
https://orcid.org/0000-0001-8380-7667
direct interaction and interventions are not practica-
ble. Therefore, an automated system could serve as
a powerful tool for enhancing wellbeing on a broad
scale. In particular, the impact of targeted interven-
tions to enhance wellbeing could be readily measured
objectively with such a system.
1.1 Related Work
Given its pronounced impact on wellbeing within
the seafaring occupation, stress serves as a fitting
proxy for monitoring overall wellbeing in this en-
vironment (Brooks and Greenberg, 2022). Stress
can manifest itself in several physiological modali-
ties (Alberdi et al., 2016). In particular, its impact on
speech has been extensively described (Giddens et al.,
2013; Van Puyvelde et al., 2018; Baird et al., 2021).
Using speech to measure stress bears the promise to
impose little strain on the user, while it can be ob-
tained readily (Hecker et al., 2022). Further, speech
data collected via an automated telephone system was
shown to be used as a modality to assess mental health
associated to stress (Higuchi et al., 2020). To col-
Hecker, P., Gonzalez-Machorro, M., Sagha, H., Dudeja, S., Kahlau, M., Eyben, F., Schuller, B. and Arnrich, B.
Mental Wellbeing at Sea: A Prototype to Collect Speech Data in Maritime Settings.
DOI: 10.5220/0013093700003911
Paper published under CC license (CC BY-NC-ND 4.0)
In Proceedings of the 18th International Joint Conference on Biomedical Engineering Systems and Technologies (BIOSTEC 2025) - Volume 2: HEALTHINF, pages 29-40
ISBN: 978-989-758-731-3; ISSN: 2184-4305
Proceedings Copyright © 2025 by SCITEPRESS – Science and Technology Publications, Lda.
29

lect speech data in regular settings, participants can
usually just use their smart devices or data can be
recorded in a controlled environment. In contrast, the
collection of speech data onboard a ship is a very
novel endeavour. Therefore, we set out to explore
how the mental well-being of seafarers through self-
reported stress could be measured by analysing their
speech data.
1.2 Contribution
In this publication, we describe our approach to mon-
itoring a crew’s wellbeing by recording speech data
on board an oil tanker. Collecting data on a ship has
many challenges to cope with, such as limited inter-
net connectivity, accessibility, reliability, and noise.
Therefore, we adapted our data collection platform
to overcome these issues. We perform feature anal-
ysis and basic classification experiments to assess the
correlation of several self-reported mental wellbeing
measures of participants. Further, we explore the im-
pact of data filtering and denoising on the results. We
showcase the successful implementation of data col-
lection efforts on board of an oil tanker and demon-
strate that the data collected from the participants can
serve as a valuable indicator of seafarer’s wellbeing.
To the best of our knowledge, this is the first study to
successfully record and assess speech data in such a
setting.
2 DATA COLLECTION
2.1 Study Setup
This study was done within the scope of a proof-of-
concept (PoC) project sponsored by the “Safetytech
Accelerator Limited incorporated” (a non-profit es-
tablished by the Lloyd’s Register Group Limited,
London, England). The study was conducted with
one of the oil tankers (“vessels”) from the fleet of
the shipping company “TORM” (Copenhagen, Den-
mark). “HiLo Maritime Risk Management” (Milton
Keynes, England) provided general insights on the
journey of the selected oil tanker. Together with the
captain and with the assistance of the human factors
department from the Lloyd’s Register Group Limited
(London, England), we deployed the system on board
and refined the speech data collection surveys to be
conducted. On December 5, 2022, the data collec-
tion was rolled out to the crew and was concluded on
February 8, 2023.
Each crew member was informed about the pro-
cessing procedures involving their data and had to opt
in by giving their explicit informed consent before en-
rolling and participating in the data collection. Data
handling was defined by collaboration and data pro-
cessing agreements that enforced strict adherence to
the EU’s general data protection regulation (GDPR)
guidelines and data privacy protection. Emphasis was
put on the protection of the users’ data and therefore
the other project partners had never access to the raw,
recorded user data.
2.2 Data Collection Platform
On the open water, the internet connection is usually
only available through satellite uplink, which is slow
and costly. To address this major constraint within
this PoC, we concluded that a local deployment of
our AI SoundLab platform would be the sole solu-
tion. AI SoundLab is a web platform developed by
the audEERING GmbH to collect high-quality audio
data actively from users. Data collection is organised
in customisable surveys. Those surveys also allow
the collection of additional metadata in the form of
questionnaires with, for example, checkboxes, radio
buttons, and free text fields. The platform is capa-
ble of running multiple different surveys in a study
and offers the option to unlock surveys to users only
upon completion of previous surveys. We deployed
this platform on a laptop computer, functioning as a
server, on the selected vessel and integrated it into
the intranet on board. This way, the crew members
were able to access the platform from their private
devices when connected to the intranet. To secure the
collected data from unauthorised access, an identity
and access management (IAM) service was deployed
on the laptop to authenticate users. All requests be-
tween services were transport layer security (TLS)-
encrypted.
Figure 1 depicts the data flow from user record-
ings on mobile devices to the network-attached stor-
age (NAS) on audEERING’s premises. Automati-
cally, on a daily basis, audio data were converted to
free lossless audio codec (FLAC) to reduce the size,
and along with other compressed data, they were en-
crypted and incrementally backed up to a folder on
the local server. Once internet connectivity was sta-
ble with a sufficiently high bandwidth (usually when
the vessel was docked in a port), the local incremen-
tal backup was transferred to our servers through an
encrypted connection. Based on interim updates of
the transmitted data, we provided the captain and the
crew with a transparent overview of the ongoing data
acquisition. The entire study was performed in En-
glish language.
HEALTHINF 2025 - 18th International Conference on Health Informatics
30
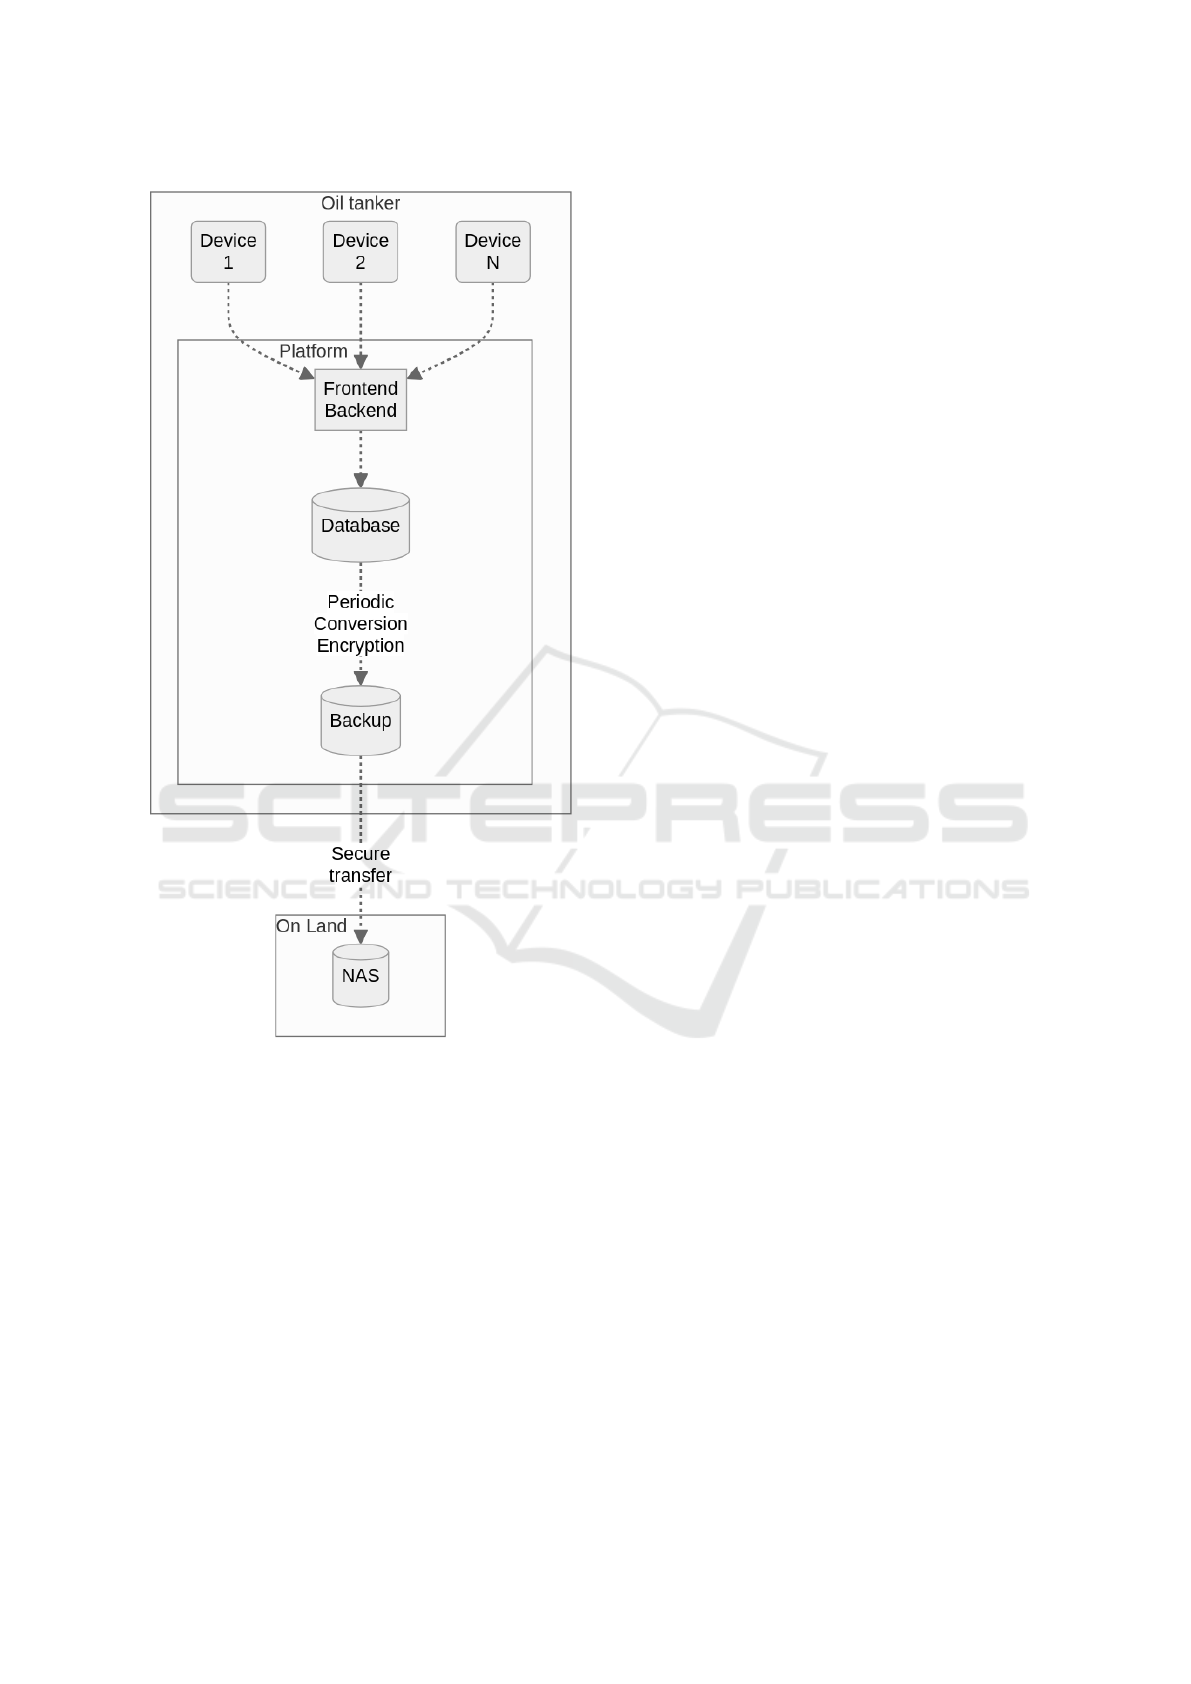
Figure 1: Data flow within the deployment of the
AI SoundLab “platform” on board of the ship.
2.2.1 Audio Recording Library
A software module developed by audEERING was
used to record raw, uncompressed audio in the
web browser. It is integrated with the front end
of the AI SoundLab web platform. This so-called
“Recording Library” is implemented in JavaScript
and is based on the web standard Media Capture and
Streams API, which is related to WebRTC, and which
is generally implemented by all common browsers.
To provide extensive support and the best possible
recording quality, the library has an automatic ad-
justment of certain configurations based on the ex-
ecution environment (browser, platform) as well as
support for the explicit configuration of various set-
Table 1: Recurring survey types and the self-reported men-
tal wellbeing measures addressed at different intervals.
Baseline
Daily
Weekly 1
Weekly 2
Final
Stress - now ✓ ✓ ✓ ✓ ✓
Stress - work ✓ ✓ ✓ ✓ ✓
WHO-5 ✓ ✓ ✓ ✓
PHQ-8 ✓ ✓ ✓ ✓
PSS-10 ✓ ✓ ✓
tings for audio recording and other features. In ad-
dition to audio recording, the library includes partic-
ular client-side, real-time audio assessment features,
such as sound activity and clipping detection, as well
as peak and root mean square (RMS) level meter-
ing. These features can be dynamically configured
and, e. g., prompt users to repeat a recording if cer-
tain quality issues are present. These features can be
used optionally to inform the user, to block the sub-
mission of the recording until it is corrected or for
a certain number of repetitions, if desired, and/or to
log information regarding audio quality and record-
ing issues. Furthermore, depending on the browser
support, the library supports the use of optional au-
dio enhancement features such as noise suppression,
echo cancellation, and auto gain control. In the case
of this PoC however, we decided to disable these gate-
keeper functionalities to prevent user frustration and
simplify recording in that unsupervised and noisy en-
vironment. Instead, we applied audio-quality-related
measures, such as denoising, to the collected data.
The browser-based, installation-free application,
the extensive support of various devices, and the au-
dio quality assessment and level metering features
make the Recording Library a strong solution for au-
dio recording in environments such as the vessel in
this PoC, where participants used their personal de-
vices for the surveys.
2.3 Surveys
We created several different surveys and asked partic-
ipants to complete longer wellbeing-related question-
naires on a weekly basis, as well as very short ques-
tionnaires that were prompted every one to two days.
On a daily basis, we implemented an visual analogue
scale (VAS) (Lesage et al., 2012; Barr
´
e et al., 2017)
to assess the participants’ stress level a) in the mo-
ment of taking the survey (“stress-now”), and b) dur-
ing their recent work tasks (“stress-work”). Partici-
pants saw a horizontal line on their device screen and
were asked to indicate how stressed they felt along
the axis of “not at all” and “very strongly” through
Mental Wellbeing at Sea: A Prototype to Collect Speech Data in Maritime Settings
31

a slider button. On a weekly basis, participants were
asked to fill in more long-term questionnaires on their
mental health and wellbeing: the WHO-five well-
being index (WHO-5) (Topp et al., 2015) and the
patient health questionnaire - eight-item depression
scale (PHQ-8) (Kroenke and Spitzer, 2002). The ten-
item perceived stress scale (PSS-10) (Cohen et al.,
1983; Cohen, 1988) was filled in every two weeks.
Table 1 shows the “surveys”, bundling together
several questionnaires and speech recordings, that
were developed and integrated in AI SoundLab for
this PoC study:
1. Baseline (30-35min): This survey only had to be
completed once. The goal was to create a baseline
for our data analysis and familiarise the partici-
pants with the speech tasks of the following sur-
veys.
2. Daily (3-5min): Very short selection of speech
tasks, prompted every 1-2 days.
3. Weekly 1 (15-20min): Similar to “Daily” plus
some more long-term self-reported mental well-
being measures. Participants were asked to do
this survey and then “Weekly 2” in alteration ev-
ery week.
4. Weekly 2 (15-20min): Similar to “weekly 1” with
the addition of the PSS-10.
5. Final (20-25min): This survey was activated at
the end of the journey and the participants had to
complete it only once. The questions were similar
to “Weekly 2”.
Each survey administered to participants included
several distinct speech prompts. We aimed to cover a
broad variety of different speech elicitation prompts
while keeping the protocol short for the best usabil-
ity. Participants were asked to a) produce sponta-
neous speech by talking for one minute about their
latest work tasks (“spontaneous”), b) to produce the
sustained phonation of the vowel /a/ for as long as
was comfortably possible (“sustained /a/”), c) read
a sentence of pseudowords in a neutral (“read neu-
tral”), as well as “happy” tone (“read happy”), and
d) to perform a small cognitive challenge by counting
downwards from 60 to 40 as fast as possible (“count-
ing”). The read speech task was designed to be ro-
bust against the language it was spoken in since we
expected a diverse crew from several nationalities. It
was composed to cover many different vowels while
keeping a simple syllable structure with consonant-
vowel-chains, inspired by the approach in (Scherer
et al., 1991), and it reads “Nilago me bu leffi, nulato
dupo sam.” To verify that this content-free sentence
of pseudowords was indeed suited, we piloted it with
five colleagues and verified its unambiguous pronun-
ciation. In the “baseline” survey, we asked the partici-
pants to practice that sentence three times to get famil-
iar with its pronunciation and discarded these record-
ings from further analysis.
After study completion, we asked users to fill in
the user experience questionnaire (UEQ) (Laugwitz
et al., 2008). The UEQ is a standardised survey tool
used for assessing subjective aspects of user experi-
ence in human-computer interaction. It evaluates the
dimensions of perceived attractiveness, perspicuity,
efficiency, dependability, stimulation, and novelty of
a product. This provided us with data-driven insights
into the perceived interaction of the seafarers with our
platform.
3 DATA EXPLORATION
After the data collection concluded, we analysed the
full collected data set, which we unfortunately cannot
share with the community due to privacy constraints.
We filtered out two participants, who recorded only
the “baseline” session, but no other session. The de-
mographic information of the included participants is
outlined in table 2.
Of particular notice is that participants completed
378 survey sessions, totalling 3:44 hours of speech
data for the regarded speech tasks. Only 15 ses-
sions (of which twelve were baseline surveys) were
aborted without completion. The baseline surveys
collected further wellbeing-related questionnaires and
demographic information. Their relatively high initial
time investment is likely the reason why participants
started, but did not complete them.
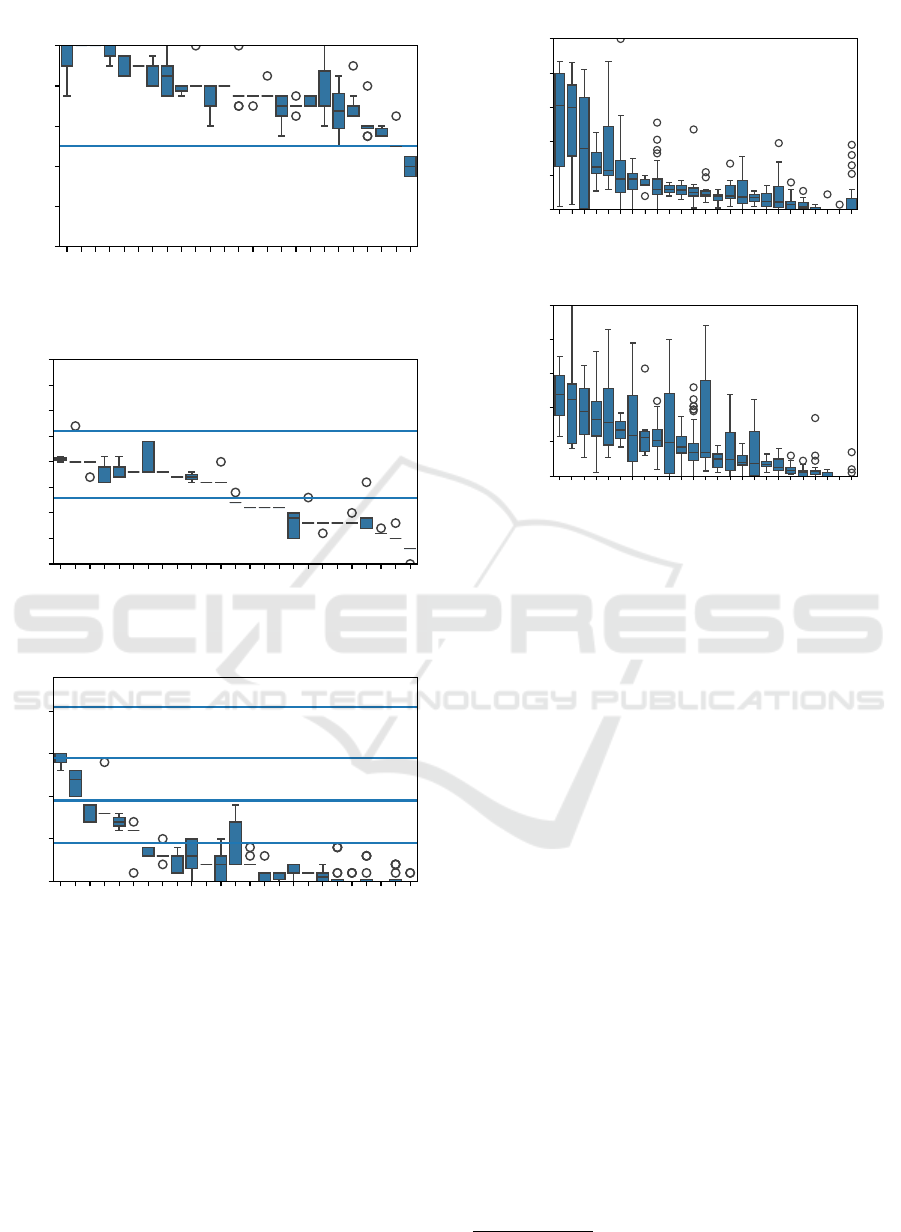
Figures 2 and 3 present the self-reported men-
tal wellbeing measure of each participant for each of
their survey sessions. The axis range is adjusted to the
score range of the respective measure. Figure 2 shows
the psychological assessment tools: WHO-5 (A),
PSS-10 (B), and PHQ-8 (C). The respective cut-off
points from the literature are marked within the plots.
Figure 3 on the other hand portrays the self-rated
stress level on a visual analogue scale (VAS) during
Table 2: Demographic information of the 25 participants.
Age & Gender Summary
Gender 2 Female, 23 Male
Age 37 ± 9.3 years old
Nationality
Filipino 18
Croatian 3
Thai 3
Indian 1
HEALTHINF 2025 - 18th International Conference on Health Informatics
32
b2bb
8606
5036
eab4
9f5e
6054
7624
4315
1247
c7b0
6457
3648
6a84
9bfd
1811
5899
16a6
50f7
438c
7c20
22d4
4c1b
9e5b
9f9a
f87b
Participant
0
20
40
60
80
100
Self-Rated WHO-5 Score
No Potential Depression
Potential Depression
A
WHO-5 Score Distribution per Participant
Across Sessions
7c20
9f9a
9e5b
5899
9bfd
1247
f87b
438c
4c1b
16a6
3648
6457
1811
6054
6a84
50f7
eab4
7624
4315
5036
9f5e
b2bb
22d4
c7b0
8606
Participant
0
5
10
15
20
25
30
35
40
Self-Rated PSS-10 Score
Low Stress
Moderate Stress
High Stress
B
PSS-10 Score Distribution per Participant
Across Sessions
1247
f87b
6457
9f9a
7c20
9e5b
9bfd
16a6
7624
5036
3648
5899
4c1b
438c
c7b0
8606
9f5e
6054
50f7
b2bb
eab4
1811
22d4
4315
6a84
Participant
0
5
10
15
20
Self-Rated PHQ-8 Score
No Depression
Mild Depression
Moderate Depression
Moderate-Severe Depression
Severe Depression
C
PHQ-8 Score Distribution per Participant
Across Sessions
Figure 2: Score distribution of the self-reported mental
wellbeing measures. The scores of every session per partic-
ipant are represented as box plots. The cut-off points from
the literature are marked within the plots. The plots here
focus on the psychological assessment tools A) WHO-five
well-being index (WHO-5); B) ten-item perceived stress
scale (PSS-10); C) patient health questionnaire - eight-item
depression scale (PHQ-8); details in section 2.3; the self-
reported stress measures are portrayed in figure 3.
The box of the box plots marks the first quartile to the third
quartile of the data with a line at the median. Whiskers ex-
tend to 1.5 times of the interquartile range, and outliers are
marked as individual points.
16a6
1247
c7b0
6457
9f9a
f87b
22d4
8606
5899
3648
7c20
4c1b
6a84
50f7
9bfd
9f5e
7624
eab4
9e5b
1811
b2bb
6054
5036
4315
438c
Participant
0
20
40
60
80
100
Self-Rated Current Stress Level
D
Current Stress Level Distribution per Participant
Across Sessions
1247
9f9a
7c20
9f5e
4c1b
3648
c7b0
8606
6457
f87b
22d4
5899
16a6
9bfd
438c
eab4
9e5b
50f7
6a84
7624
1811
b2bb
6054
5036
4315
Participant
0
20
40
60
80
100
Self-Rated Work Task Stress Level
E
Work Tasks Stress Level Distribution per Participant
Across Sessions
Figure 3: Score distribution of the self-reported mental
wellbeing measures. The scores of every session per par-
ticipant are represented as box plots. D) refers to the stress
level perceived during the audio recording and E) refers to
the stress level perceived during the recent work tasks. The
self-reported psychological assessment tools are portrayed
in figure 2.
the recording (D) and during recent work tasks (E).
Some participants show a markedly higher range in
their responses, while for others it is more drawn to-
wards lower values.
We analysed the data from the incremental up-
loads in order to provide the crew feedback on their
participation and to assess the functionality of the de-
ployed system. After the completed observation pe-
riod, we thoroughly investigated the data at hand and
the resulting distribution.
3.1 Feature Analysis and Modelling
with Speech Data
To assess the information contained in the speech
recordings of the crew members, we implemented and
open-sourced a respective feature analysis and ma-
chine learning pipeline
1
. This publication focuses
on collecting audio data in the noisy environment
of a maritime vessel. Respectively, the analysis and
modelling efforts concentrate on handling these noisy
real-life audio data.
1
https://github.com/Pascal-H/mental-wellbeing-at-sea
Mental Wellbeing at Sea: A Prototype to Collect Speech Data in Maritime Settings
33

For pre-processing, audio files were then down-
sampled to 16 kHz and speech segments were ex-
tracted by applying a voice activity detection (VAD)
algorithm. That algorithm used was part of the
devAIce® framework and its underlying architec-
ture is based on the Speech & Music Interpreta-
tion by Large-space Extraction (OPENSMILE) in-
terface. To assess the prevalence of noise in the
data, we predicted the signal-to-noise ratio (SNR) val-
ues of the speech samples through the audio quality
module of the devAIce® framework. devAIce® is
audEERING’s modular audio AI technology frame-
work that enables a wide range of audio-related pro-
cessing tasks. The audio quality model therein con-
sists of a deep neural network (DNN) based on the
CNN10 architecture. It was inspired by (Reddy et al.,
2021), and was trained on clean speech that was being
mixed with seven audio tracks of background noise.
A synthetic impulse response was convolved with that
mix, and finally, speech distortion was applied, such
as metallic/robotic speech. The SNR values are in-
ferred as the mean squared error (MSE) difference be-
tween the clean speech sample and that sample after
adding background noise. It therefore is optimised to
predict the quality of speech itself and performs with
a concordance correlation coefficient (CCC) of 0.94
when predicting the SNR level in the mix. To com-
bat noise in the data, we applied the “causal speech
enhancement model” (D
´
efossez et al., 2020) for our
modelling approaches.
We extracted acoustic speech features with the
OPENSMILE toolkit (Eyben et al., 2013) and utilised
the extended Geneva minimalistic acoustic param-
eter set (EGEMAPS) (Eyben et al., 2016) feature
set. These hand-crafted features are commonly used
in the area of speech analysis for healthcare (Low
et al., 2020; Hecker et al., 2022) and emotion recog-
nition (Christ et al., 2023).
For both the feature analysis and the modelling ap-
proaches, we slice the data based on the speech tasks:
spontaneous, sustained /a/, read-neutral, read-happy,
counting, and “all” tasks combined; see section 2.3).
To examine the relationship between the ex-
tracted EGEMAPS features and the self-reported
mental wellbeing measures (see section 2.3), we em-
ploy the Spearman’s rank-order correlation coeffi-
cient (ρ) since data were not normally distributed.
We account for type I errors by employing the Ben-
jamini–Hochberg procedure to correct resulting p-
values. No denoising approach was applied for the
statistical feature analysis.
Recently, transformer-based deep learning ap-
proaches were largely successful with automatic
speech recognition (ASR) tasks (Baevski et al., 2020).
Additionally, they also have shown great success in
speech emotion recognition (SER) applications (Wag-
ner et al., 2022) and are used as a baseline in the field,
e. g., , the multimodal sentiment analysis (MUSE)
challenge (Amiriparian et al., 2024). Those mod-
els operate on the raw audio waveform, which is
processed by a stack of several convolutional layers
(“feature encoder”). The output of subsequent trans-
former blocks can be averaged through mean pooling
and capture more abstract and high-level features of
the input speech, resulting in so-called “embeddings”.
Since the initial models were trained on large amounts
of speech data, these high-level representations can
be used to perform several different speech tasks. We
respectively extracted the embeddings of the individ-
ual VAD segments and used them similarly to the
EGEMAPS features. We employed specific versions
of the wav2vec 2.0 architecture that were fine-tuned
on several different datasets to increase their robust-
ness for noisy speech. These versions are W2V2-LR-
LIBRI (Hsu et al., 2021)
2
, W2V2-L-XLSR (Conneau
et al., 2020)
3
, and W2V2-LR-MSP (Wagner et al.,
2022)
4
.
The extracted EGEMAPS features, as well as the
wav2vec 2.0 embeddings, were used as input to a
static classification pipeline based on the scikit-learn
Python package (Pedregosa et al., 2011). All self-
reported mental wellbeing measures were continu-
ous scales, therefore we employed regression mod-
els. The scales were normalised between 0 and 1, and
normalisation was done on the whole potential scale
range and not just the scale range covered by the par-
ticipants’ responses. Self-reported mental wellbeing
scores collected in weekly surveys were retrospec-
tively applied to all preceding sessions within the pre-
vious week. Given the size of our dataset, we trained
linear regression (LR), k-nearest neighbours regres-
sor (KNNr), support vector regressor (SVR), and ex-
treme gradient boosting regressor (XGBr) (Chen and
Guestrin, 2016) models.
To assess the performance of the models and the
approximation of the predicted values to the actual
values, we report the concordance correlation coeffi-
cient (CCC), which accounts for both the correlation
and the agreement between the predicted and actual
values. Model performance on this comparably small
data set was evaluated through a leave-one-speaker-
out (LOSO) cross-validation (CV) approach. This
2
https://huggingface.co/facebook/wav2vec2-large-rob
ust-ft-libri-960h
3
https://huggingface.co/facebook/wav2vec2-large-xls
r-53
4
https://huggingface.co/audeering/wav2vec2-large-rob
ust-12-ft-emotion-msp-dim
HEALTHINF 2025 - 18th International Conference on Health Informatics
34
way, we obtain a model prediction for every sam-
ple in the dataset. We used the following pre-set
model configurations: KNNr in its default configura-
tion with a leave size of 30 and a number of neigh-
bours of 5 was supplemented with variants with a
leave size of 20 and a number of neighbours of 3, and
a leave size of 40 and a number of neighbours of 7.
SVR in its default configuration with a radial basis
function (RBF) as kernel and a regularization param-
eter (C) of 1was supplemented with variants with a
C of 0.1 and 3, and with linear, as well as 3
rd
degree
polynomial kernel functions. XGBr in its default con-
figuration with a learning rate of 0.3 and a maximum
depth of a tree of 6. Other variants with a learning rate
of 0.01 and a learning rate of 0.7 were trained too.
To assess model generalisation, we further per-
form bootstrapping and report the confidence in-
tervals for sampling the model predictions of each
of the hold-out test speakers in the LOSO scheme.
The “confidence intervals” Python package was
used (Ferrer and Riera, 2023) with the speakers set as
conditions, alpha set to five, and 1,000 as the number
of bootstrap sets.
To assess the impact of audio quality on model
performance, we train models with and without the
described denoising approach, as well as with and
without the filtering of clipped and noisy samples.
Clipping was detected with the same heuristic in
AI SoundLab’s audio recording library, which checks
if the audio amplitude peak is higher than 0.99 for
more than 0.5 ms. Files that were clipped and, as well
as those that had an SNR value below 7 dB were omit-
ted in the audio quality filter condition.
4 RESULTS
4.1 Feature Analysis and Modelling
with Speech Data
For clarity, we filter the significantly correlating fea-
tures and present only those, whose Spearman’s rank-
order correlation coefficient (ρ) is larger or equal
than 0.4. For robustness, we only regard “noisy”
(non-denoised) samples from “all” survey types com-
bined. Table 3 presents the remaining features along
with the self-reported mental wellbeing measures. All
these features stem from the speech task “sustained
/a/”.
The notation of OPENSMILE composes the fea-
ture names as follows: “Loudness” refers to the psy-
choacoustic loudness, “equivalentSoundLevel dBp”
describes the mean frame level energy in dB, “spec-
tralFlux” the mean distance between spectra of ad-
jacent frames, and “F3freq” corresponds to the cen-
tre frequency of the third formant. The func-
tional aggregates can be described, where “sma3”
means moving average smoothing over three frames,
and “percentile200”, 500, and 800, the 20th, 50th,
and 80th percentile. For the centre frequency of
the third formant, “sma3nz” is the moving average
smoothing over three frames while omitting zero val-
ues, and “stddevNorm” refers to the coefficient of
variation. Interestingly, most features are related
to the psychoacoustic loudness (“loudness”), most
prominently “loudness sma3 amean”, which is in-
dicative for the PSS-10, the current stress level, and
the stress level at work tasks.
Table 4 shows the results from modelling the
self-reported mental wellbeing measures across the
different survey types and with and without audio
quality measures (SNR-based filtering and denois-
ing). The model performance is given in CCC, and
it is indicated whether the lower bounds of the con-
fidence intervals are greater than zero and therefore
higher than the chance level. The speech task, model
type, and feature set of the best-performing mod-
els are provided. The best-performing model re-
flects the WHO-five well-being index (WHO-5) score
and achieves a CCC of 0.361 with a confidence in-
terval between 0.031 and 0.514. Figure 4 depicts
the corresponding regression plot. Overall, the best-
performing models are achieved using linear regres-
sion (LR) and support vector regressor (SVR) clas-
sifiers and are based on wav2vec 2.0 embeddings as
Table 3: Significantly correlating features with the high-
est Spearman’s rank-order correlation coefficient (ρ), sorted
by self-reported mental wellbeing measures. All p-values
(corrected for multiple comparisons using Benjamini-
Hochberg) are < 0.001. Feature codes are according
to OPENSMILE and explained in section 4.1. Targets
as described in section 2.3, “stress-now” abbreviated as
“stress-n”, and “stress-work” as “stress-w”.
Target Feature (openSMILE) ρ
WHO-5 F3freq sma3nz stddevNorm 0.433
PSS-10 loudness sma3 amean 0.404
Stress-n loudness sma3 amean 0.409
Stress-n loudness sma3 percentile500 0.404
Stress-n loudness sma3 percentile800 0.404
Stress-n spectralFlux sma3 amean 0.404
Stress-n spectralFluxV sma3nz amean 0.408
Stress-w equivalentSoundLevel dBp 0.454
Stress-w loudness sma3 amean 0.463
Stress-w loudness sma3 percentile200 0.407
Stress-w loudness sma3 percentile500 0.468
Stress-w loudness sma3 percentile800 0.456
Stress-w spectralFlux sma3 amean 0.405
Mental Wellbeing at Sea: A Prototype to Collect Speech Data in Maritime Settings
35
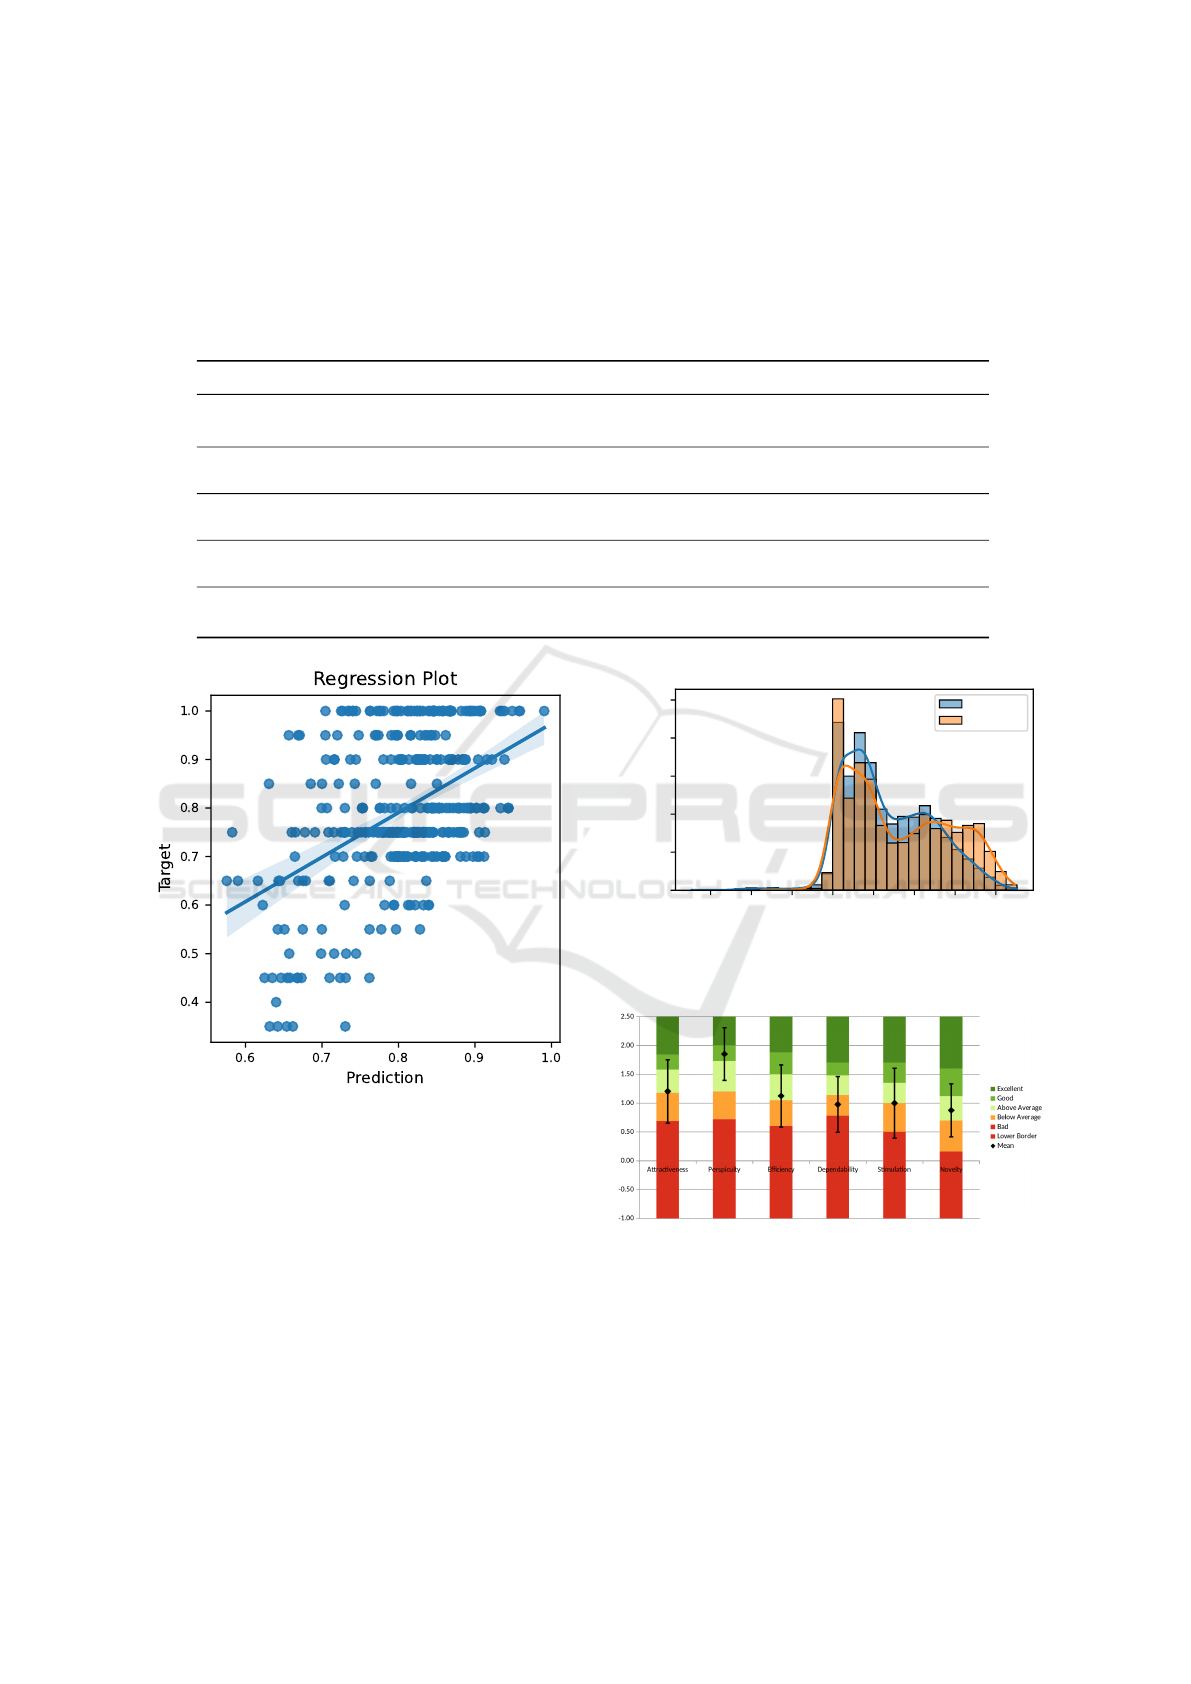
Table 4: Best performing regression models for the prediction of the self-reported mental wellbeing measures. The best per-
forming model is highlighted in bold. Models were trained on the “noisy” data, which was not denoised, and the “denoised”
data, which underwent audio-quality-based filtering and denoising. The performance of the regression models is given in
concordance correlation coefficient (CCC), where the first value indicates the performance on the full dataset, and the brack-
ets contain the lower and upper bounds of the confidence interval; the asterisk (*) marks those models, whose lower bound
exceeds chance level (CCC above 0). The parameters of the best performing model of the respective selection are given:
the data slice of the various speech “tasks” (see section 2.3), the “model” type (linear regression (LR) and support vector
regressor (SVR)), as well as the features used to represent the data (see section 3.1).
Target Quality CCC Task Model Features
WHO-5 Denoised 0.354 (0.028 - 0.568)* Read-happy SVR eGeMAPS
WHO-5 Noisy 0.361 (0.031 - 0.514)* Read-happy SVR eGeMAPS
PSS-10 Denoised 0.163 (-0.160 - 0.337) Read-neutral LR W2V2-LR-LIBRI
PSS-10 Noisy 0.117 (0.021 - 0.236)* Spontaneous LR W2V2-LR-MSP
PHQ-8 Denoised 0.195 (-0.037 - 0.383) Read-happy LR W2V2-LR-LIBRI
PHQ-8 Noisy 0.213 (-0.003 - 0.377) Read-happy LR W2V2-LR-LIBRI
Stress-now Denoised 0.178 (0.033 - 0.313)* Read-happy LR W2V2-LR-MSP
Stress-now Noisy 0.194 (0.042 - 0.320)* Read-happy LR W2V2-LR-MSP
Stress-work Denoised 0.238 (0.040 - 0.373)* Sustained /a/ SVR eGeMAPS
Stress-work Noisy 0.227 (0.005 - 0.373)* Sustained /a/ SVR eGeMAPS
Figure 4: Regression plot of the best performing model, pre-
icting WHO-5 score with a CCC of 0.361 (0.031 - 0.514),
see table 4. The model was trained on the “read-happy”
speech task (content-neutral sentence read in a “happy”
tone) with noisy, unfiltered data.
well as the EGEMAPS features. The read speech
task, acted in a “happy” tone, as well as the sustained
phonation of the vowel /a/ are most prominent. Mod-
els trained on denoised data outperform their counter-
parts trained on noisy data two times and are being
outperformed in three cases.
To assess the impact of the denoising approach,
we present the SNR distribution of all speech sam-
ples before and after denoising in figure 5. It can
−10 −5 0 5 10 15 20 25
SNR [dB]
0
100
200
300
400
500
Number of Speech Samples
SNR Distribution - Raw and Facebook Denoiser
Raw
Denoised
Figure 5: Distribution of the signal-to-noise ratio (SNR)
values (in dB) of the raw and denoised speech samples.
Figure 6: The dimensions of the user experience question-
naire (UEQ) in its provided benchmark.
be observed that the lower long tail of particularly
low SNR values is prominently reduced, and that
the upper tail of SNR values is growing through de-
noising, as expected. The mean and standard devia-
tion (SD) of the predicted SNR values changed from
11.72 dB (± 5.41 dB) to 13.15 dB (± 6.27 dB).
HEALTHINF 2025 - 18th International Conference on Health Informatics
36

4.2 User Experience Questionnaire
Figure 6 provides the results of the UEQ, which was
completed by 22 participants. Except for dependabil-
ity (which denotes if a user feels in control of in-
teraction or if they feel secure), the other measures
are above average compared to the publicly provided
benchmark of 21,000 participants (Laugwitz et al.,
2008). Interestingly, perspicuity received the high-
est rating, which indicates how easy it is to become
familiar with the software and learn how to use it.
15 participants provided an additional free-text an-
swer and, in a nutshell, were “happy” with the study
and the “feeling of being heard”, however, they had
some concerns about data security.
5 DISCUSSION
With this PoC study, we piloted the assessment of
the mental wellbeing of seafarers through established
self-reported mental wellbeing measures and speech
recordings. Through our data collection platform,
AI SoundLab, we were able to reliably record longi-
tudinal speech data and deploy the platform locally
on the ship with only very limited data transfer quo-
tas. Within our data collection effort, we registered
a notably high completion rate with 378 survey ses-
sions and 25 participating seafarers, and crew mem-
bers gave above-average feedback on the ease of use
of the data collection platform. An open-source de-
noising solution was employed to reduce background
noise and therefore increase the SNR distribution of
the speech samples, and noisy, as well as clipped au-
dio samples,s were filtered out in data pre-processing.
Thanks to AI SoundLab, we were able to conduct
the study in a challenging setting with limited con-
nectivity. Participants were using their own mobile
devices in a real-life setting during their active work
period on board an oil tanker. The demonstration that
data were successfully collected in such a setup bears
promise for similar future endeavours in order to mea-
sure mental wellbeing in those challenging working
conditions.
The collected data, consisting of the self-reported
mental wellbeing measures and the speech record-
ings, were processed and analysed. Several acoustic
speech features were found to be moderately correlat-
ing with the self-reported mental wellbeing measures.
While not robustly predictive on their own, they still
provide a meaningful connection to the manifestation
of stress and wellbeing in speech patterns. The posi-
tively correlating features with the self-reported men-
tal wellbeing measures are strongly clustered around
loudness. In literature, jitter- and F0-related features
are most indicative of stress, further vocal loudness
along with an increased F0 might also be related
(Shukla et al., 2011; Van Puyvelde et al., 2018).
Assessing the self-reported wellbeing measures
alone already yields valuable insights. In fig-
ure 2 A, one participant (ID “f87b”) is clearly be-
low the threshold for “potential depression” for all
the recorded sessions. That same participant is also
within the “moderate depression” category in fig-
ure 2 C. Respectively, these psychological assessment
tools alone might already help to uncover these hints
towards crises of individual seafarers.
Model performance is limited, which might be
due to strong differences in the expression of stress in
individual participants, as reported in (Van Puyvelde
et al., 2018). Figure 3 indicates that some participants
cover a broad range of the self-rated “current” and
“work-task-related” stress level, while others declare
very little variation. This could be in part attributed to
the subjective nature of stress perception. Individu-
als experience stress differently, influenced by factors
such as personality traits, coping mechanisms, and
cultural background. This subjectivity is a primary
reason why self-reported stress evaluations can lack
accuracy (Weckesser et al., 2019; Sommerfeldt et al.,
2019).
Further, the divergence in a high and low variation
of the self-reported stress levels could reflect a report-
ing bias. Even though it was communicated vigor-
ously during the study that the employer and sponsor
of the study never had access to this sensitive infor-
mation, some participants might have mistrusted the
protection of their data. As outlined in the literature,
the disclosure of personal information is highly de-
pendent on the trust of users, and mistrust leads to
an unwillingness to report their information (Joinson
et al., 2010). The reported variability in self-reported
stress levels indicates that those measures are valuable
tools to monitor the participants’ wellbeing, but also
emphasise that the users’ trust in the system is crucial.
Strategies for audio quality control such as filter-
ing out noisy and clipped samples, as well as denois-
ing, show only a limited effect. Figure 5 shows that
there is a noticeable effect when applying denoising
to the SNR distribution, and the mean SNR values
and the SD improve from 11.72 dB (± 5.41 dB) to
13.15 dB (± 6.27 dB). However, denoising could po-
tentially also have a negative impact on the classifi-
cation performance. During denoising, the “noisy”
frequency bands in the acoustic spectrum are being
removed. Since those frequency bands might contain
crucial information for the classification approach at
hand, an overly aggressive denoising approach could
Mental Wellbeing at Sea: A Prototype to Collect Speech Data in Maritime Settings
37

do more harm than good and impair classification per-
formance.
When regarding the classification performance on
the different self-reported wellbeing measures, the
WHO-5 questionnaire outperforms the other mea-
sures and is being followed by the VAS-based assess-
ment of the perceived stress level during the recent
work tasks. The WHO-5 questionnaire was utilised to
reflect back on the time period of the last week. The
highest classification performance achieved using the
WHO-5 scores might indicate that the measured un-
derlying long-term “wellbeing” is manifesting on this
time scale. Similarly, the self-reported stress level
during the recent work tasks might be more indica-
tive of the state and wellbeing of the participants
than the currently-perceived self-reported stress level.
These insights could guide future efforts in selecting
the most informative assessment measures, however,
due to the limited predictive strength, a generalisation
should be done only with caution.
Further, the “read-happy” task was most promi-
nent in the best-performing models (table 4). A possi-
ble explanation is the robustness against accents from
the various ethnicities on board due to the unambigu-
ous pronunciation across different languages present
on the ship (table 2). The aspect of the acted posi-
tive sentiment might be an additional catalyst to pre-
dict wellbeing through speech. The contrast between
the prompted positive emotion and the actual mood of
the participant could strengthen the expression in the
voice. Especially when being in a negative mood, it
might be an additional burden to sound positive. Fur-
ther, the sustained phonation of the vowel /a/ could be
particularly robust against the spoken language and
accent. LR- and SVR-based models are dominant,
with SVR models showing a slightly better perfor-
mance. SVR-based models seem to perform best with
the EGEMAPS feature set, while LR-based models
are prominently using wav2vec 2.0-embeddings as in-
put. This might indicate that certain non-linearities in
the data might be better captured by SVR-based clas-
sifiers, while speech embeddings might not be as in-
formative to SVR-based approaches.
The design of the study protocol and the data col-
lection through AI SoundLab could be regarded as
the cornerstones for future approaches. The promi-
nence of the read speech task in a happy tone and the
sustained vowel /a/ could encourage the inclusion of
these into future data collection efforts.
In the wider context, implementing a system that
objectively monitors the wellbeing of a ship’s crew
through speech analysis can provide a valuable instru-
ment. In particular, such a system could be used to
design and evaluate targeted interventions to enhance
the crew’s welfare. This aligns also with employers’
interests, as a high level of crew wellbeing is likely
to lead to increased productivity (Brooks and Green-
berg, 2022). The privacy of individual users is of ut-
most importance in this context, and in our PoC study,
we contractually agreed only to report ship-wide ag-
gregates to the sponsor. In line and understandably,
participants reported concerns with data safety, al-
though we emphasised that the sponsor has no ac-
cess to their data by design of our data collection sys-
tem. To address this further, the high transparency
of a resulting large-scale system seems key, and the
participants themselves should ideally be able to see
the exact output measures that are aggregated over the
whole ship and conveyed to the sponsor.
Our major learning from this study is that the in-
volvement of the human factors department is key to
designing an understandable and frictionless data sur-
vey. Human factors were able to facilitate effective
communication with the crew and to provide an over-
all understanding of their situation and needs. The
deployment of a system in the maritime setting, such
as presented here, is particularly challenging, but it
is also highly needed. Mental wellbeing and stress
are highly subjective and individual aspects, and mod-
elling approaches for measuring these will have to be
highly personalised.
5.1 Limitations and Future Work
The data distribution of stress per participant (fig-
ure 3) indicates a heterogeneous and “individual na-
ture” of mental wellbeing and stress. As we observed,
models struggle to generalise on previously unseen
speakers and overfitting is the consequence. Person-
alised models, such as those proposed by (Wu et al.,
2023), could be a promising next step. This ensures
that the subjective and individual perceived wellbeing
can be quantified reliably to evaluate the success of
potential interventions.
In addition, we propose a shift towards a more
passive data collection approach for future studies.
Slavich et al. highlighted the potential of speech anal-
ysis to quantify stress as an important indicator for
wellbeing (Slavich et al., 2019). In particular, they
portrayed the potential of passive monitoring solu-
tions with particular emphasis on individuals’ pri-
vacy. Similarly, Jiang et al. piloted a wrist-worn de-
vice that collects audio data and only saves high-level
features to preserve anonymity (Jiang et al., 2019).
Accordingly, we see great potential in adapting the
here-described active monitoring system to a pas-
sive, privacy-friendly one, that takes the friction of
required active interaction from the user.
HEALTHINF 2025 - 18th International Conference on Health Informatics
38

ACKNOWLEDGEMENTS
We would like to thank the AI SoundLab team for
their efforts to deploy this platform on the ship. In
addition, we thank Martin H
¨
ammerle for his sup-
port through user experience design, who provided
clear and graspable information material for the ship’s
crew. Further, we thank all the participants who do-
nated their speech samples for this study, in particular
the two captains of the ship, who supported the data
collection greatly.
REFERENCES
Alberdi, A., Aztiria, A., and Basarab, A. (2016). Towards
an automatic early stress recognition system for office
environments based on multimodal measurements: A
review. Journal of Biomedical Informatics, 59:49–75.
Amiriparian, S., Christ, L., Kathan, A., Gerczuk, M.,
M
¨
uller, N., Klug, S., Stappen, L., K
¨
onig, A., Cam-
bria, E., Schuller, B., et al. (2024). The muse
2024 multimodal sentiment analysis challenge: So-
cial perception and humor recognition. arXiv preprint
arXiv:2406.07753.
Baevski, A., Zhou, Y., Mohamed, A., and Auli, M. (2020).
wav2vec 2.0: a framework for self-supervised learn-
ing of speech representations. Advances in Neural In-
formation Processing Systems, 33:12449–12460.
Baird, A., Triantafyllopoulos, A., Z
¨
ankert, S., Ottl, S.,
Christ, L., Stappen, L., Konzok, J., Sturmbauer,
S., Meßner, E.-M., Kudielka, B. M., Rohleder, N.,
Baumeister, H., and Schuller, B. W. (2021). An eval-
uation of speech-based recognition of emotional and
physiological markers of stress. Front. Comput. Sci.,
3:750284.
Barr
´
e, R., Brunel, G., Barthet, P., and Laurencin-Dalicieux,
S. (2017). The visual analogue scale: An easy and
reliable way of assessing perceived stress. Quality in
Primary Health Care, 1(1).
Brooks, S. K. and Greenberg, N. (2022). Mental health and
psychological wellbeing of maritime personnel: a sys-
tematic review. BMC Psychol, 10(1):139.
Chen, T. and Guestrin, C. (2016). Xgboost: A scalable
tree boosting system. In Proceedings of the 22nd acm
sigkdd international conference on knowledge discov-
ery and data mining, pages 785–794.
Christ, L., Amiriparian, S., Baird, A., Kathan, A., M
¨
uller,
N., Klug, S., Gagne, C., Tzirakis, P., Stappen, L.,
Meßner, E.-M., K
¨
onig, A., Cowen, A., Cambria, E.,
and Schuller, B. W. (2023). The muse 2023 multi-
modal sentiment analysis challenge: Mimicked emo-
tions, cross-cultural humour, and personalisation. In
Proceedings of the 4th on Multimodal Sentiment Anal-
ysis Challenge and Workshop: Mimicked Emotions,
Humour and Personalisation, page 1–10. Association
for Computing Machinery.
Cohen, S. (1988). Perceived stress in a probability sam-
ple of the united states. The social psychology of
health/Sage.
Cohen, S., Kamarck, T., and Mermelstein, R. (1983). A
global measure of perceived stress. Journal of health
and social behavior, pages 385–396.
Conneau, A., Baevski, A., Collobert, R., Mohamed, A.,
and Auli, M. (2020). Unsupervised cross-lingual rep-
resentation learning for speech recognition. arXiv
[preprint] arXiv:2006.13979.
D
´
efossez, A., Synnaeve, G., and Adi, Y. (2020). Real Time
Speech Enhancement in the Waveform Domain. In
Proc. Interspeech 2020, pages 3291–3295.
Eyben, F., Scherer, K. R., Schuller, B. W., Sundberg,
J., Andre, E., Busso, C., Devillers, L. Y., Epps, J.,
Laukka, P., Narayanan, S. S., and Truong, K. P.
(2016). The geneva minimalistic acoustic parameter
set (GeMAPS) for voice research and affective com-
puting. IEEE Trans. Affective Comput., 7(2):190–202.
Eyben, F., Weninger, F., Gross, F., and Schuller, B. (2013).
Recent developments in opensmile, the munich open-
source multimedia feature extractor. In Proceedings
of the 21st ACM International Conference on Multi-
media, MM ’13, page 835–838, New York, NY, USA.
Association for Computing Machinery.
Ferrer, L. and Riera, P. (2023). Confidence intervals for
evaluation in machine learning. Accessed: 2024-02-
27.
Giddens, C. L., Barron, K. W., Byrd-Craven, J., Clark, K. F.,
and Winter, A. S. (2013). Vocal indices of stress: A
review. Journal of Voice, 27(3):390.e21–390.e29.
Hecker, P., Steckhan, N., Eyben, F., Schuller, B. W., and
Arnrich, B. (2022). Voice analysis for neurologi-
cal disorder recognition–a systematic review and per-
spective on emerging trends. Front. Digit. Health,
4:842301.
Higuchi, M., Nakamura, M., Shinohara, S., Omiya, Y.,
Takano, T., Mitsuyoshi, S., and Tokuno, S. (2020). Ef-
fectiveness of a voice-based mental health evaluation
system for mobile devices: Prospective study. JMIR
Form Res, 4(7):e16455.
Hsu, W.-N., Sriram, A., Baevski, A., Likhomanenko, T.,
Xu, Q., Pratap, V., Kahn, J., Lee, A., Collobert, R.,
Synnaeve, G., et al. (2021). Robust wav2vec 2.0: An-
alyzing domain shift in self-supervised pre-training.
arXiv preprint arXiv:2104.01027.
Jiang, L., Gao, B., Gu, J., Chen, Y., Gao, Z., Ma, X.,
Kendrick, K. M., and Woo, W. L. (2019). Wearable
long-term social sensing for mental wellbeing. IEEE
Sensors Journal, 19(19):8532–8542.
Joinson, A. N., Reips, U.-D., Buchanan, T., and Schofield,
C. B. P. (2010). Privacy, trust, and self-disclosure on-
line. Human–Computer Interaction, 25(1):1–24.
Kroenke, K. and Spitzer, R. L. (2002). The phq-9: a new
depression diagnostic and severity measure.
Laugwitz, B., Held, T., and Schrepp, M. (2008). Construc-
tion and evaluation of a user experience questionnaire.
In Holzinger, A., editor, HCI and Usability for Educa-
tion and Work, volume 5298, pages 63–76. Springer
Berlin Heidelberg.
Mental Wellbeing at Sea: A Prototype to Collect Speech Data in Maritime Settings
39

Lesage, F.-X., Berjot, S., and Deschamps, F. (2012). Clin-
ical stress assessment using a visual analogue scale.
Occupational Medicine, 62(8):600–605.
Low, D. M., Bentley, K. H., and Ghosh, S. S. (2020).
Automated assessment of psychiatric disorders using
speech: A systematic review. Laryngoscope Inves-
tigative Otolaryngology, 5(1):96–116.
Pedregosa, F., Varoquaux, G., Gramfort, A., Michel, V.,
Thirion, B., Grisel, O., Blondel, M., Prettenhofer, P.,
Weiss, R., Dubourg, V., Vanderplas, J., Passos, A.,
Cournapeau, D., Brucher, M., Perrot, M., and
´
Edouard
Duchesnay (2011). Scikit-learn: Machine learning
in Python. Journal of Machine Learning Research,
12(85):2825–2830.
Reddy, C. K., Gopal, V., and Cutler, R. (2021). Dnsmos: A
non-intrusive perceptual objective speech quality met-
ric to evaluate noise suppressors. In ICASSP 2021-
2021 IEEE International Conference on Acoustics,
Speech and Signal Processing (ICASSP), pages 6493–
6497. IEEE.
Scherer, K. R., Banse, R., Wallbott, H. G., and Goldbeck, T.
(1991). Vocal cues in emotion encoding and decoding.
Motiv Emot, 15(2):123–148.
Shukla, S., Dandapat, S., and Prasanna, S. R. M. (2011).
Spectral slope based analysis and classification of
stressed speech. Int J Speech Technol, 14(3):245–258.
Slavich, G. M., Taylor, S., and Picard, R. W. (2019). Stress
measurement using speech: Recent advancements,
validation issues, and ethical and privacy considera-
tions. Stress, 22(4):408–413. PMID: 30945584.
Sommerfeldt, S. L., Schaefer, S. M., Brauer, M., Ryff,
C. D., and Davidson, R. J. (2019). Individual dif-
ferences in the association between subjective stress
and heart rate are related to psychological and phys-
ical well-being. Psychological science, 30(7):1016–
1029.
Topp, C. W., Østergaard, S. D., Søndergaard, S., and Bech,
P. (2015). The who-5 well-being index: a systematic
review of the literature. Psychotherapy and psychoso-
matics, 84(3):167–176.
Van Puyvelde, M., Neyt, X., McGlone, F., and Pattyn, N.
(2018). Voice stress analysis: A new framework for
voice and effort in human performance. Frontiers in
Psychology, 9:1994.
Wagner, J., Triantafyllopoulos, A., Wierstorf, H., Schmitt,
M., Burkhardt, F., Eyben, F., and Schuller, B. W.
(2022). Dawn of the transformer era in speech emo-
tion recognition: closing the valence gap. arXiv
[preprint] arXiv:2203.07378.
Weckesser, L. J., Dietz, F., Schmidt, K., Grass, J.,
Kirschbaum, C., and Miller, R. (2019). The psycho-
metric properties and temporal dynamics of subjective
stress, retrospectively assessed by different informants
and questionnaires, and hair cortisol concentrations.
Scientific reports, 9(1):1098.
Wu, Z., Scheidwasser-Clow, N., Hajal, K. E., and Cer-
nak, M. (2023). Speaker embeddings as individuality
proxy for voice stress detection.
HEALTHINF 2025 - 18th International Conference on Health Informatics
40
