
Explaining Mammographic Texture: The Role of View and Abnormality
Type in Early Cancer Diagnosis
Bianca Iacob
a
and Laura Diosan
b
Faculty of Mathematics and Computer Science, University Babes Bolyai, Cluj-Napoca, Romania
Keywords:
Textural Feature, CNN, Mammogram, Early Diagnosis, Breast Cancer.
Abstract:
Detecting breast cancer at an early stage significantly increases the chances of successful treatment and sur-
vival. Understanding the full topology of various abnormalities requires analyzing multiple mammography
views. This study evaluates the performance of mammographic views in detecting abnormalities, focusing
on calcifications and masses, to enhance early cancer diagnosis. By examining the importance of considering
both the type of abnormality and the mammographic view, we aim to identify key factors influencing detection
accuracy. Additionally, we investigate whether incorporating textural features such as GLCM, GLRLM, and
GLSZM can improve overall model performance. Our findings underscore the necessity of a tailored approach
in mammographic analysis. These insights are crucial for advancing early diagnostic capabilities and improv-
ing patient outcomes.
1 INTRODUCTION
The craniocaudal (CC) and mediolateral oblique
(MLO) views are two standard perspectives used in
mammography, each offering distinct advantages and
limitations in breast cancer detection and character-
ization (Vachon et al., 2007). In the CC view, the
breast is compressed from above to below. The X-ray
beam is directed from the head (cranio) to the foot
(caudal). It provides a clear image of the central and
medial parts of the breast. The advantage of this view
is that it allows a better visualization of the medial
breast tissue. The limitation is that it may not capture
some areas in the upper outer quadrant and the axil-
lary tail region (Duffy et al., 2008). In the MLO view,
the breast is compressed diagonally, from the upper
outer part (superior-lateral) to the lower inner part
(inferior-medial). The X-ray beam is directed at an
angle, usually around 45 degrees (Kim SJ, 2006). It
provides a more comprehensive view of the breast, in-
cluding the upper outer quadrant and the axillary tail,
which are common sites for breast cancer. This view
offers better visualization of the upper outer quadrant
and axillary tail. It can be more challenging to obtain
a consistent angle and positioning, potentially leading
to variability in image quality (Kala and Ezhilarasi,
2018).
a
https://orcid.org/0009-0006-9765-6410
b
https://orcid.org/0000-0002-6339-1622
In mammography, abnormalities include masses
and calcifications. A mass is a distinct area of breast
tissue that may have well-defined or ill-defined edges;
spiculated margins (jagged or star-like edges) are
more indicative of malignancy (Bassett, 1992). Cal-
cifications are small calcium deposits visible as white
spots on a mammogram. Macrocalcifications, larger
and coarser, are typically benign and linked to aging
or prior injuries, requiring no further workup. Mi-
crocalcifications, smaller and finer, may be benign or
malignant.
There are two arguments as the basis of our inves-
tigation. On one hand, (Araque et al., 2019) showed
that the early warning signs of cancer manifest dif-
ferently in MLO and CC views. On the other hand,
medical professionals favor the MLO view in clini-
cal practice for its comprehensive coverage of breast
tissue. Detecting the chest wall to exclude the pec-
toral muscle in MLO images adds preprocessing time,
and inaccurate delineation can introduce noise and er-
rors in feature extraction. In this context, this paper
aims to investigate the impact of employing MLO or
CC mammographic views and to offer experimental
evidence in support of the choice of mammographic
views for breast cancer identification.
Our study addresses a significant gap in the exist-
ing literature, which is the lack of detailed analyses
on the choice of mammographic view (CC or MLO)
for automatically discriminating between benign and
124
Iacob, B. and Diosan, L.
Explaining Mammographic Texture: The Role of View and Abnormality Type in Early Cancer Diagnosis.
DOI: 10.5220/0013096900003890
In Proceedings of the 17th International Conference on Agents and Artificial Intelligence (ICAART 2025) - Volume 3, pages 124-131
ISBN: 978-989-758-737-5; ISSN: 2184-433X
Copyright © 2025 by Paper published under CC license (CC BY-NC-ND 4.0)

malignant breast lesions. While mammography is
widely regarded as the gold standard for breast cancer
screening
1
especially due to its ability to detect mi-
crocalcifications, there is insufficient justification in
the literature for the preferred view in computerized
analysis. The majority of authors have based their
analysis on both views for breast cancer risk assess-
ment (Abdolell et al., 2020; Sasikala and Arun Ku-
mar, 2024) or for breast cancer classification (malign
vs. benign) (Cui et al., 2021). Only a few authors
have analyzed the importance of MLO and CC views,
and only in the context of breast cancer risk assess-
ment (Astrid Padilla, 2021) or for discriminating be-
tween images from healthy patients and those with
cancer (Tan et al., 2016; P
´
erez-Benito et al., 2019).
To the best of our knowledge, there is no study ded-
icated to evaluating breast cancer classification using
just one view and texture features extracted from the
mammograms. Our research aims to systematically
evaluate the impact of using MLO and CC mammo-
graphic views on the accuracy of breast cancer clas-
sification. By providing experimental evidence, we
hope to offer clear guidance on the optimal choice
of mammographic view for computerized analysis.
Therefore, this paper aims to address the following
research questions:
RQ1. In what ways do craniocaudal and MLO views
differ in their accuracy, sensitivity and specificity for
detecting breast cancer?
RQ2. Can mammographic images of calcifications
and masses be combined without compromising the
performance of diagnostic models, or is it necessary
to differentiate between these types for optimal accu-
racy?
The paper will continue with Section 2 which
contains the Related work, then we will have Sec-
tion 3 which will present the dataset used, the pre-
processing steps applied, the features used, the model
involved and the training procedure. Section 4 will
present the results obtained for the experiments per-
formed based on the view of the mammogram, CC
or MLO, and we will end up with the conclusions in
Section 5.
2 RELATED WORK
Early detection of breast cancer, whether benign or
malignant, is essential for improving the survival rate
and increasing the quality of life of patients (Coughlin
and Ekwueme, 2009). Early identification of tumors
1
Breast Cancer Screening and Mammograms
https://www.bcrf.org/blog/mammogram-breast-cancer-
screening-research/
allows rapid and less invasive medical interventions,
thus reducing the risk of metastases and subsequent
complications. In the case of benign cancer, early de-
tection can prevent its transformation into malignant
forms by ensuring proper monitoring and treatment.
Regular screening, through methods such as mammo-
grams and periodic self-examinations, plays a crucial
role in detecting abnormalities at early stages, allow-
ing for prompt and effective interventions, leading to
better outcomes and an increased likelihood of com-
plete cure (Charan et al., 2018).
The classical radiomics workflow is based
on several important steps: image acquisi-
tion/reconstruction, image segmentation, feature
extraction and quantification, and statistical analysis
and model building. Segmentation problem can be
done automatically, semi-automatically or manually
(Van Timmeren et al., 2020).
Textural features focus on detecting local spatial
configurations and intensity variations, aiding in tis-
sue discrimination and malignancy detection. Unlike
higher-order statistics, textural features effectively re-
tain this localized spatial detail (Bajcsi and Chira,
2023). Additionally, they are robust (Singh et al.,
2022) to variations in image acquisition and process-
ing, making them valuable for clinical diagnosis and
prognosis. Their computational efficiency is advan-
tageous for rapid mammogram analysis in extensive
screening programs (Siviengphanom et al., 2022).
Deep learning and machine learning algorithms
have achieved accuracy in cancer diagnosis com-
parable to that of an average breast radiologist
(Rodriguez-Ruiz et al., 2019). Deep learning systems,
particularly Convolutional Neural Networks (CNNs),
have shown performance on par with radiologists and
can enhance their accuracy when used for decision
support. CNNs have been effective in classifying
mammograms into benign and malignant categories
(Rodriguez-Ruiz et al., 2019; Mahmood et al., 2022).
Training these models can be done either from scratch
using specific medical images or through transfer
learning with pre-trained models (Huynh et al., 2016;
Wang, 2024). Even if we can find several CNN-based
systems that approached the breast cancer classifica-
tion problems (e.g. (Dabass et al., 2023; Melekoodap-
pattu et al., 2022; Razali et al., 2023)), they con-
sidered both MLO and CC views in the processing
pipeline, without analyzing the contribution of each
view to the prediction process.
Explaining Mammographic Texture: The Role of View and Abnormality Type in Early Cancer Diagnosis
125
3 MATERIALS AND METHODS
3.1 Dataset
In our pipeline, we utilized images from the Dig-
ital Database for Screening Mammography (CBIS-
DDSM) (Sawyer-Lee et al., 2017), focusing specifi-
cally on cropped images to enhance the quality of the
data.
Curated Breast Imaging Subset DDSM (CBIS-
DDSM) is a dataset that contains mammograms from
6775 patients (Sawyer-Lee et al., 2017). It consists
of images that contain abnormalities of type mass and
calcification and the mammograms were taken from
a CC view and also from a MLO view. The images
are categorized into two primary classes: calcification
and mass. Each of these classes is further subdivided
based on the view, either craniocaudal (CC) or medio-
lateral oblique (MLO). Subsequently, these categories
are further classified into benign, malignant, and be-
nign without callback. A detailed description related
to the number of images from each class can be seen
in Table 1.
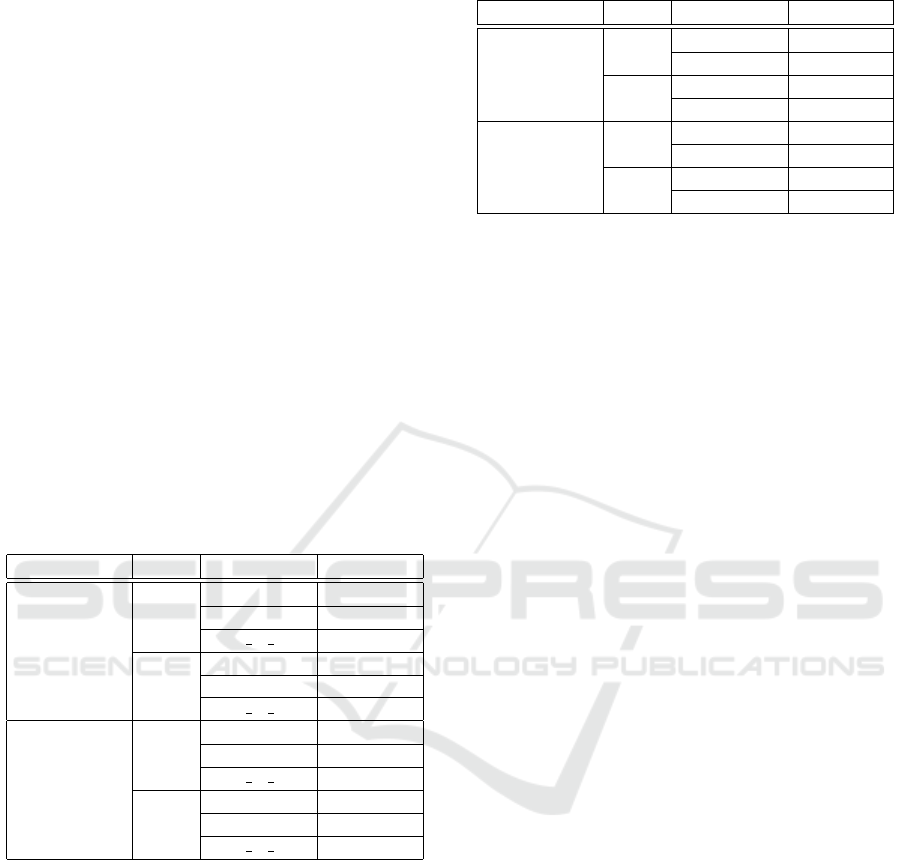
Table 1: Description of CBIS-DDSM dataset.
Abnormality View Tumor type No of img
calcification
CC
benign 308
malign 318
b w c 262
MLO
benign 350
malign 355
b w c 279
mass
CC
benign 367
malign 363
b w c 54
MLO
benign 404
malign 421
b w c 87
For our approach, we decided to not include the
mammograms that are from class benign without call-
back, as they do not require further immediate follow-
up or additional diagnostic procedures, and the ones
that contain both a benign and malign tumor, as they
are not clear in which class to be included. After the
exclusion of these cases, we have the number of im-
ages from each class as described in Table 2. For the
experiments performed, we used the Region of Inter-
est (ROI) from the images.
3.2 Data Pre-Processing
The preprocessing phase involved applying two key
techniques: Contrast Limited Adaptive Histogram
Table 2: Number of images from each class after triage.
Abnormality View Tumor type No of img
calcification
CC
benign 362
malign 281
MLO
benign 176
malign 164
mass
CC
benign 347
malign 342
MLO
benign 554
malign 552
Equalization (CLAHE) and gamma correction.
CLAHE (Zuiderveld, 1994) is a method used to
improve the contrast of images by limiting the ampli-
fication of noise. Gamma correction (Pedregosa et al.,
2011) is a non-linear operation used to encode and
decode luminance or tristimulus values in images. It
adjusts the brightness of an image, enhancing the vis-
ibility of features by using a power-law transforma-
tion.
3.3 Feature Extraction
Following preprocessing, we extracted a set of texture
features that are crucial for characterizing the proper-
ties of the mammographic images. These included
the Gray Level Co-occurrence Matrix (GLCM), Gray
Level Run Length Matrix (GLRLM), and Gray Level
Size Zone Matrix (GLSZM) (Tourassi, 1999). GLCM
is a statistical method that examines the spatial rela-
tionship of pixels and is used to extract second-order
texture information. GLRLM measures the occur-
rence of consecutive pixels with the same gray level
value in specified directions, providing insights into
the texture’s fineness and coarseness. GLSZM an-
alyzes the size of homogeneous zones in an image,
indicating the distribution and prevalence of different
zone sizes (van Griethuysen J. J. M., 2017).
3.4 Machine Learning Model
After extracting the relevant features, we applied a
residual network to the data. ResNet (Kaiming He
and Sun, 2016) is a type of deep neural network that
uses skip connections or shortcuts to jump over some
layers. This architecture helps mitigate the vanish-
ing gradient problem, allowing the network to learn
deeper representations.
A bunch of previous experiments have indicated
that the ResNet architecture is a promising one for
the problem of breast cancer classification (Iacob and
Diosan, 2024). The results obtained by ResNet were
more robust than those obtained by other architectures
(e.g. VGG, EfficientNet). Consequently, we focused
ICAART 2025 - 17th International Conference on Agents and Artificial Intelligence
126
our investigations solely on ResNet for further analy-
sis and refinement.
ResNET101 network with pretrained weights on
the ImageNet dataset and Adam optimizer with var-
ious learning rates were involved in the experiment.
We looked for the appropriate learning rate to use by
trying heuristically different values in intervals 1e-2
and 1e-6. After checking the results obtained, we
decided to use 1e-5 as the learning rate for the ex-
periments. Adam’s adaptive learning rate mechanism
adjusts the learning rates for each parameter individ-
ually based on the historical gradients, allowing for
smoother and more stable training. Also, Adam opti-
mizer provides consistent performance across differ-
ent tasks and datasets, making it a reliable choice for
a wide range of deep learning applications. For this
reason, we consider using the Adam optimizer.
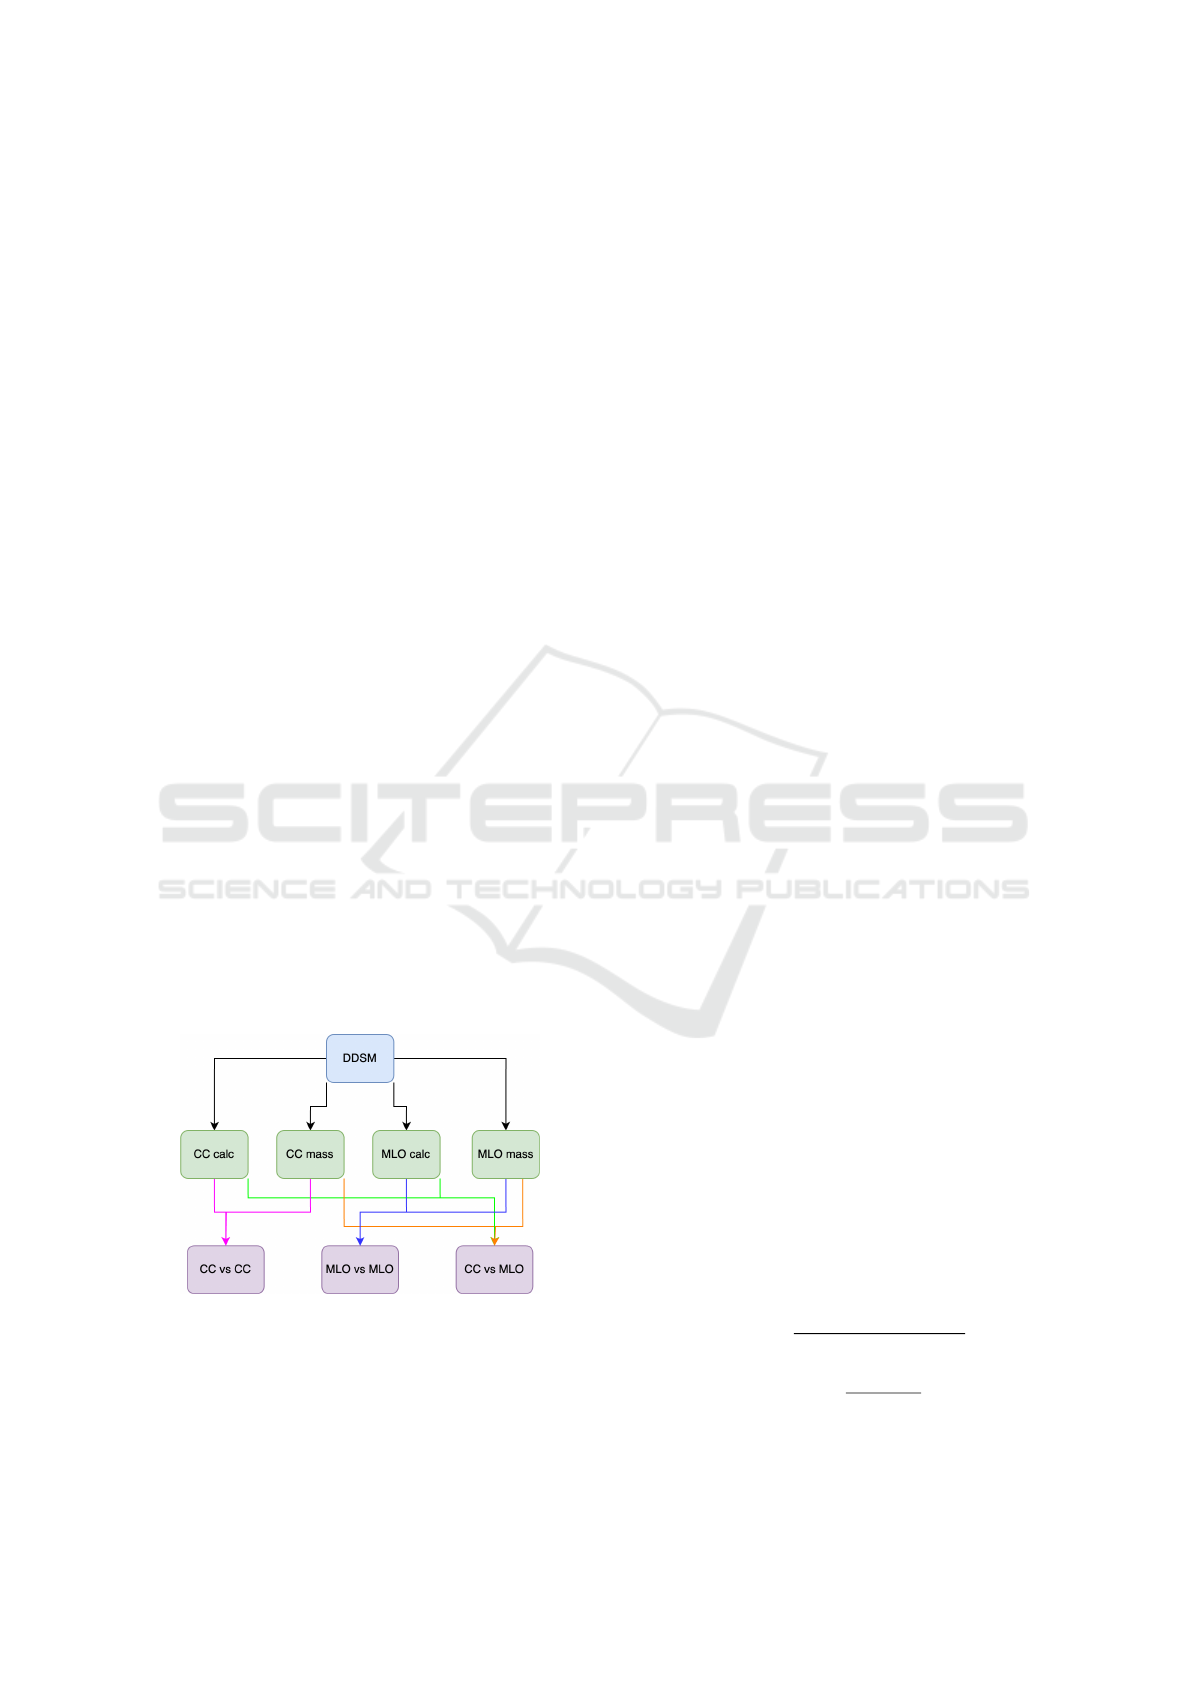
3.5 Training Procedure
The DDSM dataset was split into subsets based on
view and the combinations used to create the sub-
sets for the experiments can be seen in Figure 1.
To validate our model, we employed a 5-fold cross-
validation technique, which involves partitioning the
dataset into five distinct folds, training the model on
four folds, and validating it on the remaining fold.
This process is repeated five times, each time with a
different fold serving as the validation set.
Finally, we computed the average scores across
each fold to evaluate the overall performance of our
model, ensuring a robust and reliable assessment of
the classifier’s ability to detect and classify abnormal-
ities in mammographic images. The scores used to
measure the performance of the model are accuracy,
sensitivity and specificity (Pedregosa et al., 2011).
Figure 1: Combinations performed based on view for the
experiments.
4 RESULTS AND DISCUSSIONS
Each of these two views, MLO and CC, has its advan-
tages. The center and medial (inner) portions of the
breast, particularly the region next to the chest wall,
are visible in the CC view. The deep medial breast tis-
sue, which is occasionally obscured by other views,
is best visualized in this view. A greater area of the
breast tissue is captured by MLO view, including the
axillary (underarm) region and the upper outer quad-
rant, which are known to be breast cancer hotspots.
Most breast tissue can be seen in the MLO view, even
in places where the CC view might not be able to fully
display it. In this context, the first analysis considers
only the craniocaudal (CC) view and tries to differen-
tiate cancer from benign based on mass-type abnor-
malities and calcification-type abnormalities, while
the second analysis focuses on the MLO view with
a similar aim. In all the experiments, different pre-
processing steps have been performed on the raw im-
ages and various texture features have been extracted.
The purpose of the first experiment is to analyze
the CC images to identify the best feature, determine
which pre-processing method gives the best results,
and check whether calcified lesions are easier to de-
tect compared to those of the mass type. The sec-
ond experiment focuses exclusively on the analysis
of MLO images. In the third experiment, the perfor-
mance between CC and MLO images is compared to
understand the differences in lesion identification de-
pending on the projection used.
The analysis of the results was carried out on three
essential plans to ensure a complete and rigorous eval-
uation. The first plan focuses on identifying abnor-
malities in the data to detect any significant deviations
from expected behaviour. The second plan aims to
identify the most efficient method of data preprocess-
ing, evaluating the impact of each type of preprocess-
ing on model robustness. Finally, the third plan ana-
lyzes the best results obtained from the perspective of
features, identifying the combinations of features that
contribute the most to improving the performance of
the model.
For each case of evaluation, we take into account
an analysis based on accuracy, sensitivity and speci-
ficity. We will note the true positive cases with TP,
true negative cases with TN, false positive cases with
FP and false negative cases with FN.
accuracy =
T N + T P
T N + FP + T P + FN
(1)
sensitivity =
T P
FN + T P
(2)
Explaining Mammographic Texture: The Role of View and Abnormality Type in Early Cancer Diagnosis
127

speci f icity =
T N
T N + FP
(3)
The accuracy formula is described in Equation 1
and alone is not sufficient, as it can be misleading in
the case of unbalanced classes, where a model may
appear to perform well only because it predicts the
majority of the dominant class correctly. Sensitiv-
ity presented in Equation 2 is important to evaluate
how well the model identifies positive cases, essen-
tial in detecting lesions, and specificity as in Equa-
tion 3 measures how well the model identifies nega-
tive cases, reducing false alarms. Using all three met-
rics accuracy, sensitivity and specificity we obtain a
balanced evaluation of the model’s performance, both
in the correct detection of lesions and in avoiding er-
rors.
Statistical analysis of the data for the three main
texture features indicates that both the mean and stan-
dard deviation are within normal limits, suggesting a
suitable distribution of values. The standard devia-
tion, a key indicator of data variation, does not tend
to zero, meaning that the data is not too concentrated
around the mean, reflecting a healthy diversity of val-
ues
2
.
Table 3 and Table 4 will present the results ob-
tained on the experiments. We marked with bold the
maximum values for calcification and with italics the
maximum values for mass.
4.1 Experiment 1
Based on the experiments comparing the performance
of calcification and mass detection in CC views, sev-
eral observations were made regarding the metrics of
accuracy, sensitivity, and specificity. The results of
the experiments can be seen in Table 3.
The analysis revealed that calcifications con-
sistently showed superior performance in accuracy
across all seven evaluated features and for all pre-
processing steps. This indicates a high level of re-
liability in correctly identifying the presence of cal-
cifications compared to masses. For the detection of
masses, the application of Contrast Limited Adaptive
Histogram Equalization (CLAHE) led to improved re-
sults in only 2 out of 7 cases, suggesting that this pre-
processing technique has limited effectiveness in en-
hancing the accuracy of mass detection.
The results for sensitivity, which measures the
ability to identify true positive cases correctly,
showed that calcifications outperformed mass in 4 out
of 7 feature-based cases. This demonstrates a stronger
2
Results of the statistical analysis of data https://github.
com/biancalixandru0/Mean-and-standard-deviation.
capability in identifying true positives for calcifica-
tions compared to masses. Notably, the combination
of texture features, GLCM, GLRLM and GLSZM,
provided the best sensitivity results for both calcifi-
cations and masses. However, the use of preprocess-
ing techniques like CLAHE showed improvements in
only 5 out of 14 cases, indicating that such methods
do not consistently enhance sensitivity for either type
of abnormality.
In terms of specificity, which measures the abil-
ity to identify true negatives correctly, calcifications
again demonstrated better results in 6 out of 7 cases.
This suggests a greater accuracy in distinguishing
non-pathological cases. The application of CLAHE
showed some benefits, improving specificity in 4 out
of 14 cases, but its overall impact was limited.
4.2 Experiment 2
Based on the comparison of the MLO view for calci-
fication and mass detection, several key findings were
observed regarding accuracy, sensitivity, and speci-
ficity. Results of the experiments are present in Table
4.
In the MLO view, calcifications consistently
showed superior performance in accuracy, outper-
forming masses in all seven evaluated cases. This in-
dicates a high reliability in correctly identifying calci-
fications over masses in this view. The combination of
three specific texture features, GLCM, GLRLM and
GLSZM, led to the best results, highlighting the im-
portance of these features in accurate detection. Ad-
ditionally, the application of CLAHE improved accu-
racy in mass detection in 3 out of 7 cases, suggesting
some benefit in enhancing the clarity and contrast of
mass images.
The sensitivity analysis revealed that calcifica-
tions had better results than masses in 6 out of 7 cases,
indicating a more reliable identification of true pos-
itive cases for calcifications in the MLO view. For
masses, the use of CLAHE improved sensitivity in 4
out of 7 cases, showing that this preprocessing tech-
nique can enhance the detection rate of true positives
for masses in some instances.
The assessment of specificity showed that calci-
fications performed better than masses in 2 out of 7
cases. This indicates a more limited differentiation
advantage for calcifications over masses in this met-
ric.
4.3 Experiment 3
The comparison between craniocaudal and MLO
views for detecting calcifications in mammographic
ICAART 2025 - 17th International Conference on Agents and Artificial Intelligence
128
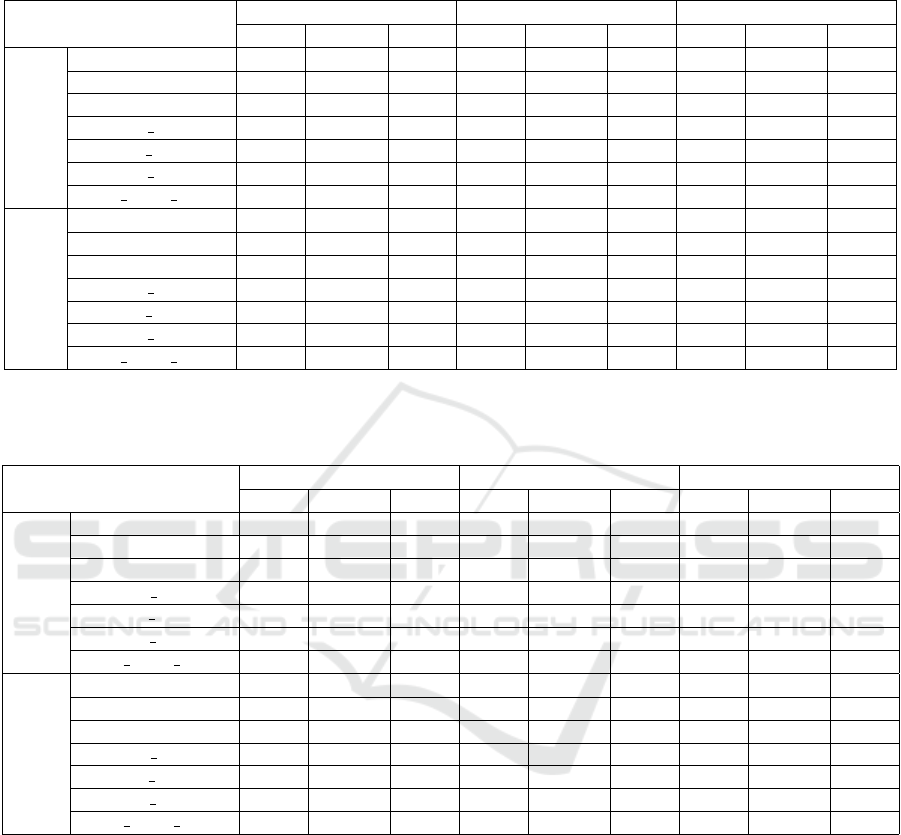
Table 3: Results (in terms of accuracy, sensitivity and specificity) for malign vs. benign (this is actually the classification
problem) based on different tumor types (calc and mass) in CC images and by using various texture features. Sensitivity and
specificity are computed as a micro-average over both classes.
accuracy sensitivity specificity
none gamma clahe none gamma clahe none gamma clahe
CC
calc
glcm 0.660 0.642 0.659 0.480 0.503 0.523 0.793 0.750 0.765
glrlm 0.795 0.731 0.738 0.778 0.667 0.616 0.809 0.780 0.834
glszm 0.692 0.658 0.652 0.479 0.447 0.433 0.858 0.822 0.822
glcm glrlm 0.751 0.701 0.688 0.680 0.578 0.501 0.806 0.796 0.832
glcm glszm 0.706 0.685 0.697 0.488 0.451 0.529 0.875 0.866 0.828
glrlm glszm 0.781 0.735 0.728 0.696 0.626 0.597 0.847 0.819 0.829
glcm glrlm glszm 0.817 0.763 0.762 0.780 0.668 0.666 0.845 0.836 0.837
CC
mass
glcm 0.590 0.597 0.611 0.378 0.481 0.473 0.798 0.711 0.747
glrlm 0.721 0.678 0.674 0.738 0.653 0.613 0.700 0.702 0.734
glszm 0.598 0.600 0.602 0.450 0.465 0.449 0.745 0.733 0.753
glcm glrlm 0.714 0.655 0.655 0.743 0.656 0.705 0.686 0.654 0.605
glcm glszm 0.626 0.612 0.620 0.517 0.518 0.588 0.734 0.705 0.652
glrlm glszm 0.705 0.664 0.645 0.699 0.643 0.614 0.712 0.684 0.675
glcm glrlm glszm 0.733 0.693 0.666 0.740 0.696 0.629 0.725 0.689 0.702
Table 4: Results (in terms of accuracy, sensitivity and specificity) for malign vs. benign (this is the classification prob-
lem) based on different tumor types (calc and mass) in MLO images and by using various texture features. Sensitivity and
specificity are computed as a micro-average over both classes.
accuracy sensitivity specificity
none gamma clahe none gamma clahe none gamma clahe
MLO
calc
glcm 0.675 0.621 0.600 0.472 0.365 0.506 0.865 0.860 0.726
glrlm 0.806 0.773 0.740 0.826 0.751 0.763 0.787 0.793 0.719
glszm 0.709 0.642 0.660 0.588 0.550 0.602 0.821 0.728 0.713
glcm glrlm 0.793 0.726 0.690 0.785 0.676 0.663 0.801 0.774 0.715
glcm glszm 0.735 0.686 0.713 0.631 0.587 0.622 0.832 0.778 0.798
glrlm glszm 0.828 0.758 0.708 0.804 0.669 0.619 0.851 0.842 0.791
glcm glrlm glszm 0.852 0.759 0.757 0.847 0.715 0.682 0.857 0.801 0.827
MLO
mass
glcm 0.588 0.552 0.566 0.744 0.765 0.779 0.429 0.333 0.347
glrlm 0.744 0.654 0.723 0.736 0.597 0.717 0.752 0.712 0.729
glszm 0.616 0.595 0.609 0.579 0.586 0.599 0.653 0.604 0.620
glcm glrlm 0.697 0.617 0.672 0.729 0.617 0.717 0.664 0.617 0.626
glcm glszm 0.615 0.597 0.616 0.577 0.636 0.588 0.655 0.557 0.645
glrlm glszm 0.694 0.669 0.721 0.676 0.650 0.741 0.712 0.688 0.700
glcm glrlm glszm 0.707 0.686 0.733 0.703 0.711 0.760 0.711 0.660 0.705
imaging can be seen in Table 3 and Table 4 and re-
veals distinct differences in performance across vari-
ous metrics.
When comparing the accuracy of CC and MLO
views for calcifications, it was found that the best re-
sults were consistently obtained using a combination
of GLCM, GLRLM and GLSZM features. This com-
bination proved effective in both views. However, the
MLO view provided better accuracy in all seven cases
compared to the CC view, suggesting that the MLO
view may offer superior visualization or positioning
advantages for detecting calcifications.
The sensitivity analysis, also showed that the com-
bination of GLCM, GLRLM, and GLSZM features
yielded the best results for both CC and MLO views.
Nonetheless, the MLO view demonstrated superior
sensitivity in 6 out of 7 cases compared to the CC
view. This indicates that the MLO view may be more
reliable for detecting the presence of calcifications.
In terms of specificity, the MLO view again out-
performed the CC view in 4 out of 7 cases. While
the difference in specificity between the views was
less pronounced than in accuracy and sensitivity, the
MLO view still showed an advantage in distinguish-
ing non-pathological cases.
Following the analysis of the craniocaudal versus
MLO views for calcifications, we turn to the compar-
ison of these views for detecting masses in mammo-
Explaining Mammographic Texture: The Role of View and Abnormality Type in Early Cancer Diagnosis
129

graphic imaging. The results, as summarized in Ta-
bles 3 and Table 4, provide insights into the perfor-
mance of these views.
In evaluating the accuracy of CC versus MLO
views for detecting masses, it was found that the com-
bination of GLCM, GLRLM and GLSZM features
yielded the best results for the CC view. The CC view
outperformed the MLO view in 5 out of 7 cases, indi-
cating a generally higher accuracy in mass detection
when using the CC view.
The sensitivity analysis revealed that the CC view
provided better results than the MLO view in 4 out of
7 cases. Notably, the use of CLAHE as a preprocess-
ing technique in the MLO view improved sensitivity
outcomes in 5 out of 7 cases, demonstrating the poten-
tial benefit of this method in enhancing the visibility
and detection of masses. Overall, the application of
preprocessing methods was advantageous in 8 out of
14 cases, suggesting a moderate but noteworthy im-
provement in detection capability.
When assessing specificity, the CC view again
showed superior results, outperforming the MLO
view in 6 out of 7 cases. This suggests that the CC
view may be more effective in avoiding false positives
when evaluating masses.
We conducted experiments to determine whether
the type of abnormality —calcification or mass— im-
pacts detection performance. Unfortunately, we were
unable to achieve an accuracy above 70% in any of the
cases tested. Consequently, we excluded these results
from this section. However, our findings underscore
the importance of considering the type of abnormality
to enhance performance.
5 CONCLUSIONS
The findings suggest that calcifications are generally
more reliably detected and characterized than masses
in CC mammographic views. The consistent use of
the GLCM, GLRLM, and GLSZM feature combina-
tion plays a crucial role in enhancing diagnostic accu-
racy and sensitivity. However, the application of pre-
processing techniques like CLAHE shows only case-
dependent benefits, particularly for mass detection.
Overall, these insights underscore the importance of
targeted feature selection and highlight the more ro-
bust diagnostic performance for calcifications.
Calcifications are generally detected with higher
accuracy and sensitivity in the MLO view compared
to masses. The use of specific texture features, partic-
ularly those including GLRLM, is crucial for achiev-
ing the best diagnostic outcomes. While the applica-
tion of CLAHE shows some benefits, particularly in
improving sensitivity for mass detection, its overall
impact varies. These results highlight the importance
of feature selection and preprocessing techniques in
enhancing the detection and characterization of breast
abnormalities in mammographic imaging.
Furthermore, images exhibiting calcification ab-
normalities demonstrate better performance overall
compared to those containing mass abnormalities.
REFERENCES
Abdolell, M., Payne, J. I., Caines, J., Tsuruda, K., Barnes,
P. J., Talbot, P. J., Tong, O., Brown, P., Rivers-
Bowerman, M., and Iles, S. (2020). Assessing breast
cancer risk within the general screening population:
developing a breast cancer risk model to identify
higher risk women at mammographic screening. Eu-
ropean Radiology, 30:5417–5426.
Araque, O., Mej
´
ıa-Sandoval, M., Sassi, A., Holli-Helenius,
K., L
¨
a
¨
aperi, A.-L., Rinta-Kiikka, I., Arponen, O., and
Pertuz, S. (2019). Selecting the mammographic-view
for the parenchymal analysis-based breast cancer risk
assessment.
Astrid Padilla, Otso Arponen, I. R.-K. S. P. (2021). Image
retrieval-based parenchymal analysis for breast cancer
risk assessment. The International Journal of Medical
Physics Research and Practice, 49.
Bajcsi, A. and Chira, C. (2023). Textural and shape features
for lesion classification in mammogram analysis. In
International Conference on Hybrid Artificial Intelli-
gence Systems, pages 755–767.
Bassett, L. W. (1992). Mammographic analysis of calcifica-
tions. Radiologic Clinics of North America, 30(1):93–
105.
Charan, S., Khan, M. J., and Khurshid, K. (2018). Breast
cancer detection in mammograms using convolutional
neural network. In 2018 International Conference on
Computing, Mathematics and Engineering Technolo-
gies (iCoMET), pages 1–5.
Coughlin, S. S. and Ekwueme, D. U. (2009). Breast can-
cer as a global health concern. Cancer Epidemiology,
33(5):315–318.
Cui, Y., Li, Y., Xing, D., Bai, T., Dong, J., and Zhu, J.
(2021). Improving the prediction of benign or ma-
lignant breast masses using a combination of image
biomarkers and clinical parameters. Frontiers in On-
cology, 11:629321. Erratum in: Front Oncol. 2021
Apr 29;11:694094. doi: 10.3389/fonc.2021.694094.
Dabass, J., Dabass, M., and Dabass, B. S. (2023).
Fuzzydeepnets based feature extraction for classifica-
tion of mammograms. Intelligence-Based Medicine,
8:100117.
Duffy, S., Nagtegaal, I., Astley, S., Gillan, M., McGee, M.,
Boggis, C., Wilson, M., Beetles, U., Griffiths, M.,
Jain, A., Johnson, J., Roberts, R., Deans, H., Duncan,
K., Iyengar, G., Griffiths, P., Warwick, J., Cuzick, J.,
and Gilbert, F. (2008). Visually assessed breast den-
ICAART 2025 - 17th International Conference on Agents and Artificial Intelligence
130

sity, breast cancer risk and the importance of the cran-
iocaudal view. Breast cancer research : BCR, 10:R64.
Huynh, B. Q., Li, H., and Giger, M. L. (2016). Digital mam-
mographic tumor classification using transfer learning
from deep convolutional neural networks. Journal of
Medical Imaging, 3(3):034501.
Iacob, B. and Diosan, L. (2024). Exploring the fusion of
cnns and textural features in mammogram interpreta-
tion. International Conference on Knowledge-Based
and Intelligent Information & Engineering Systems.
Kaiming He, Xiangyu Zhang, S. R. and Sun, J. (2016).
Deep residual learning for image recognition. 2016
IEEE Conference on Computer Vision and Pattern
Recognition (CVPR), pages 770–778.
Kala, S. and Ezhilarasi, M. (2018). Fusion of k-gabor
features from medio-lateral-oblique and craniocaudal
view mammograms for improved breast cancer diag-
nosis. Journal of Cancer Research and Therapeutics,
14.
Kim SJ, Moon WK, C. N.-C. J. K. S. I. J. (2006). omputer-
aided detection in digital mammography: comparison
of craniocaudal, mediolateral oblique, and mediolat-
eral views. Radiology.
Mahmood, T., Li, J., Pei, Y., Akhtar, F., Rehman, M. U.,
and Wasti, S. H. (2022). Breast lesions classifica-
tions of mammographic images using a deep convo-
lutional neural network-based approach. PLOS ONE,
17(1):e0263126.
Melekoodappattu, J. G., Dhas, A. S., Kandathil, B. K., and
Adarsh, K. S. (2022). Breast cancer detection in mam-
mogram: combining modified cnn and texture feature
based approach. Journal of Ambient Intelligence and
Humanized Computing, 14(1):11397–11406.
Pedregosa, F., Varoquaux, G., Gramfort, A., Michel, V.,
Thirion, B., Grisel, O., Blondel, M., Prettenhofer,
P., Weiss, R., Dubourg, V., Vanderplas, J., Passos,
A., Cournapeau, D., Brucher, M., Perrot, M., and
Duchesnay, E. (2011). Scikit-learn: Machine learning
in Python. Journal of Machine Learning Research,
12:2825–2830.
P
´
erez-Benito, F. J., Signol, F., P
´
erez-Cort
´
es, J.-C., Poll
´
an,
M., P
´
erez-G
´
omez, B., Salas-Trejo, D., Casals, M.,
Mart
´
ınez, I., and LLobet, R. (2019). Global parenchy-
mal texture features based on histograms of oriented
gradients improve cancer development risk estimation
from healthy breasts. Computer Methods and Pro-
grams in Biomedicine, 177:123–132.
Razali, N. F., Isa, I. S., Sulaiman, S. N., Karim, N. K. A.,
and Osman, M. K. (2023). Cnn-wavelet scattering
textural feature fusion for classifying breast tissue in
mammograms. Biomedical Signal Processing and
Control, 83:104683.
Rodriguez-Ruiz, A., L
˚
ang, K., Gubern-Merida, A., Broed-
ers, M., Gennaro, G., Clauser, P., Helbich, T. H.,
Chevalier, M., Tan, T., Mertelmeier, T., et al. (2019).
Stand-alone artificial intelligence for breast cancer de-
tection in mammography: comparison with 101 radi-
ologists. JNCI: Journal of the National Cancer Insti-
tute, 111(9):916–922.
Sasikala, S. and Arun Kumar, S. (2024). Enhancement of
breast cancer screening through texture and deep fea-
ture fusion model using mlo and cc view mammo-
grams. In Exploration of Artificial Intelligence and
Blockchain Technology in Smart and Secure Health-
care Advances in Computing Communications and In-
formatics, volume 7, page 96.
Sawyer-Lee, R., Gimenez, F., Hoogi, A., and Rubin,
D. (2017). Curated breast imaging subset of dig-
ital database for screening mammography (cbis-
ddsm). International Research and Innovation Sum-
mit (IRIS2017).
Singh, H., Sharma, V., and Singh, D. (2022). Compara-
tive analysis of proficiencies of various textures and
geometric features in breast mass classification using
k-nearest neighbor. Visual Computing for Industry,
Biomedicine, and Art, 5(1):3.
Siviengphanom, S., Gandomkar, Z., Lewis, S. J., and Bren-
nan, P. C. (2022). Mammography-based radiomics in
breast cancer: a scoping review of current knowledge
and future needs. Academic Radiology, 29(8):1228–
1247.
Tan, M., Zheng, B., Leader, J. K., and Gur, D. (2016).
Association between changes in mammographic im-
age features and risk for near-term breast cancer de-
velopment. IEEE Transactions on Medical Imaging,
35(7):1719–1728. Epub 2016 Feb 11.
Tourassi, G. D. (1999). Journey toward computer-aided di-
agnosis: role of image texture analysis. Radiology,
213(2):317–320.
Vachon, C. M., Brandt, K. R., Ghosh, K., Scott, C. G., Mal-
oney, S. D., Carston, M. J., Pankratz, V. S., and Sell-
ers, T. A. (2007). Mammographic breast density as a
general marker of breast cancer risk. Cancer Epidemi-
ology Biomarkers & Prevention, 16(1):43–49.
van Griethuysen J. J. M., Fedorov A., P. C. H. A. A. N.
N. V. B.-T. R. G. H. F.-R. J. C. P. S. A. H. J. W. L.
(2017). Computational radiomics system to decode
the radiographic phenotype. Cancer Research, pages
e104–e107.
Van Timmeren, J. E., Cester, D., Tanadini-Lang, S., Alka-
dhi, H., and Baessler, B. (2020). Radiomics in med-
ical imaging—“how-to” guide and critical reflection.
Insights into imaging, 11(1):91.
Wang, L. (2024). Mammography with deep learning for
breast cancer detection. Frontiers in Oncology, 14.
Zuiderveld, K. (1994). Contrast limited adaptive histogram
equalization. Graphics gems, 4:474–485.
Explaining Mammographic Texture: The Role of View and Abnormality Type in Early Cancer Diagnosis
131
