
SSGA: Synthetic Scene Graph Augmentation via Multiple Pipeline
Variants
Kenta Tsukah ara, Ryogo Yamamoto, Kanji Tana ka, Tomoe Hiroki
University of Fukui, 3-9-1 Bunkyo, Fukui City, Fukui 910-0017, Japan
Keywords:
Cross-View Robot Localization, View Synthesis, Scene Graph Classifier.
Abstract:
Cross-view image localization, which involves predicting the view of a robot with respect to a single-view
landmark i mage, is important in landmark-sparse and mapless navigation scenarios such as image-goal nav-
igation. Typical scene graph-based methods assume that all objects in a landmark image are visible in the
query image and cannot address view inconsistencies between the query and landmark images. We observed
that scene graph augmentation (SGA), a technique that has recently emerged to address scene graph-specific
data augmentation, is particularly r el evant to our problem. However, the existing SGA methods rely on the
availability of rich multi-view training images and are not suitable for single-view setups. In this study, we
introduce a new SGA method tailored for cross-view scenarios where scene graph generation and scene syn-
thesis are intertwined. We begin with the fundamental pipeline of cross-view self-localization, and without
loss of generality, identify several pipeline variants. These pipeline variants are used as supervision cues to
improve robustness and discriminability. Evaluation in an image-goal navigation scenario demonstrates that
the proposed approach yields significant and consistent improvements i n accuracy and robustness.
1 INTRODUCTION
Neural radiance field (NeRF) and other view synthe-
sis methods have made rapid progress in recent y e ars
(Zhan et al., 2023), becoming dominant approaches in
the field of robot self-localization. These approaches
are particularly powerful in the context of cross-view
localization, which involves large viewpoint changes,
because they can generate synthetic images that show
unfamiliar scenes from different viewpoints. Such
cross-view localization is particularly relevant for em-
bodied AI scenarios, suc h as the recently emerged im-
age goal navigation. For example, in ( Mezghani et al.,
2022), only one landmark image (i.e., th e goal) is pro-
vided at the start of navigation, a nd the goal is to find
the de sire d goal pose based on that lan dmark image.
Thus, the final stage of navigation requires the robot
to identify a landmark view and localize its viewpoint
relative to the landmark.
An alternative state-of-the-art approach to cross-
view self-localization is the scene graph approach.
Graph-based scene representations have recently
proven effective in such challenging cross-view set-
tings. In the field of rob ot self-localization, several
prior studies have reported that describing a scene
using a collection of scene parts rather than a sin-
gle scene-wide feature is more ro bust to viewpoint
changes, an d scene graphs can be seen as an exten-
sion of the form e r approach to describe the relation-
ships between scene parts. For example, in (Parihar
et al., 2021), the authors studied self-localization from
opposite viewing directions as a typical cross-view
self-localization scenario in robot car ap plications and
proved that scene graph-like descriptors are effective
in dealing with such challenging cross-view settings.
NeRF and scene gra phs have developed indepen-
dently, and approaches that integrate both to tac kle the
unified problem o f cross-view localization have been
largely overlooked. Although these two approach es
have conceptually complementary attributes, name ly
view synthesis and part-based rep resentation, fusing
the two is not a simple problem. Common scene
graph-based methods assume that all objects in the
landmark image are visible in the query image. How-
ever, it is not uncommon for certain objects to be
missing in the query image, leading to mismatches
in scene parsing between tra ining and test im ages.
For examp le , (Gawel et al., 2018) formulated scene
graph recognition as a graph matching problem and
presented an approach that is robust to missing ob-
jects. However, the proposed method is based on a
random walk on the scene grap h, and as th e a uthors
Tsukahara, K., Yamamoto, R., Tanaka, K. and Hiroki, T.
SSGA: Synthetic Scene Graph Augmentation via Multiple Pipeline Variants.
DOI: 10.5220/0013098100003912
Paper published under CC license (CC BY-NC-ND 4.0)
In Proceedings of the 20th International Joint Conference on Computer Vision, Imaging and Computer Graphics Theory and Applications (VISIGRAPP 2025) - Volume 2: VISAPP, pages
833-840
ISBN: 978-989-758-728-3; ISSN: 2184-4321
Proceedings Copyright © 2025 by SCITEPRESS – Science and Technology Publications, Lda.
833
also point out, the computational complexity grows
infinitely with the environment scale. In contrast, we
considered a scalable formulation, scene graph clas-
sification, that is computationally efficient and main-
tains robustness.
In this study, we consid e r the scene graph ap-
proach from a new perspective, namely graph data
augmen ta tion (GDA). GDA is a variant of data aug-
mentation techniques that have emerged in r ecent
years to improve the generalization ability of graph
machine learning under uncertainty. Recently, in
(Knyazev et al., 2021), scen e graph specific augmen-
tation (SGA) was fir st explored for the task of per-
turbing real scene graphs to increase the d iversity of
training distributions and improve the g eneralization
of scene graph inference. However, training their gen-
erative adversarial network (GAN)-based models may
require expensive annotated datasets. Moreover, their
application is limited to two-dime nsional ( 2D) scene
understanding, and cross-view settings with 3D view-
point changes remain unsolved. In contrast, cross-
view image localization requires considering the in-
teractions between multiple components, includ ing
scene pa rsing, scene description, and scene classifica-
tion. This makes existing GDA/SGA techniques in-
applicable directly.
To address this challen ge, we extend SGA to in-
clude a mixed scenario o f scene graph generation and
synthetic views. Starting from a basic pipeline c on-
sisting of scene parsing (P), scene description (D),
and scene synthesis (S), we investigate potential mis-
alignments of each p ipeline component (P/D/S). We
address potential failure modes of individual com-
ponen ts and explore different subsets and permuta-
tions of pipeline components to create a diverse set
of pipeline variants, as indicated by the colored lines
with arrows in Figure 1. Specifically, we start with
a basic pipeline for cross-view image localization.
We then argue, without loss of generality, that differ-
ent pipeline variants exist and prop ose to use these
pipeline variants as supervision cues to improve ro-
bustness an d discrim inability. The final localization
decision is made by consensus of the pipeline ensem-
ble. Ou r approach achieves significant and consistent
improvements in accuracy and robustness when eval-
uated on the photorealistic Habitat-Sim workspace
(Szot et al., 2021).
The m ain contributions of this work are: (1) We
consider a novel approach, called Synthetic Scene
Graph (SSG), which extends scene graph descrip-
tors, which have proven effective for cross-view self-
localization, with view synthesis techniques. (2)
Starting from the base pipe line of SSG, we argu e
that diverse pipeline variants exist and propose to use
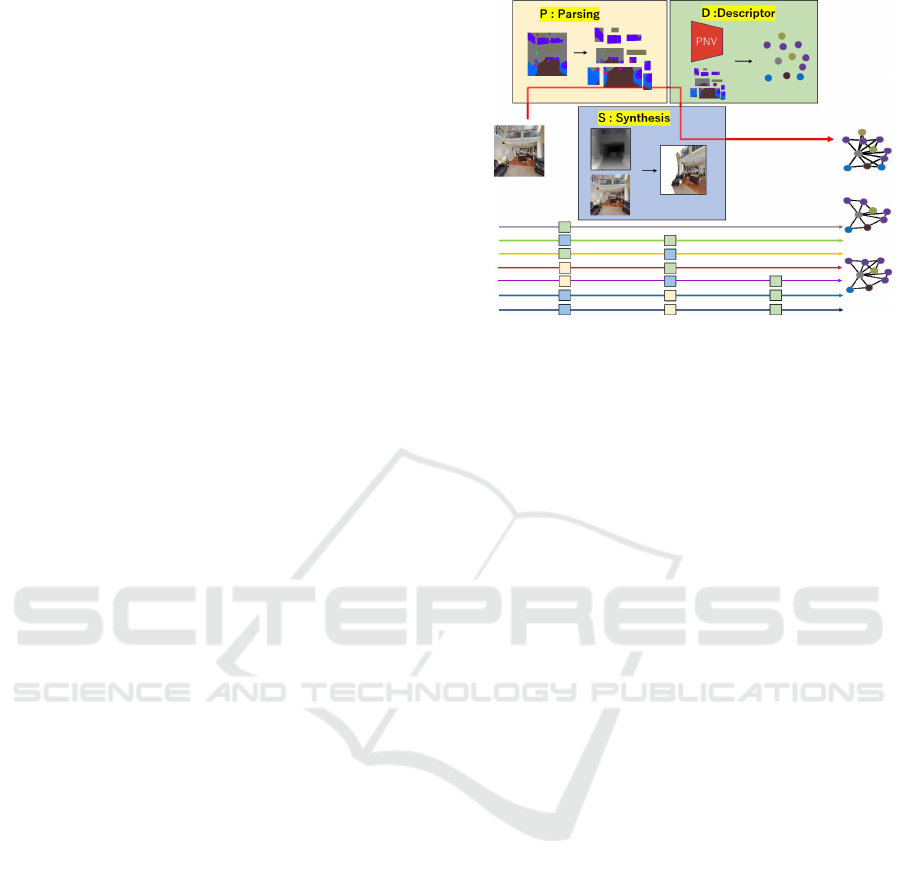
Figure 1: Starting from P-D-S, a basic pipeline for cross-
view self-localization, we argue that a variety of pipeline
variants exist and propose to use these pipeline variants as
supervision cues to improve robustness and discriminabil-
ity. Throughout this manuscript, P, D, and S are used to
represent parsing, descriptor, and synthesis.
these pipeline variants as clues to impr ove robustness
and discriminability. (3) We validate the effective-
ness of the proposed metho d through thorough per-
formance comparison and ablation studies.
2 RELATED WORK
2.1 Cross-View Robot Localization
Cross-view robot localization involves predicting the
robot’s pose relative to a landmark image un der sig-
nificant viewpoint variations (Zhang et al., 2021).
Most localization frameworks, including image re-
trieval, fail due to assuming that a landma rk image
similar to the query exists in training. Recent view
synthesis methods like neural radiance fields (Ne RF)
and structure-from -motion have advanced cross-view
localization but require spa tially dense multi-view
training images, making them unsuitable for single-
view landmark images. In (Tourani et al., 2021), a
typical cross-view ro bot car scenario was studied, us-
ing only training images with opposite orientations to
the query. While their scene description is r obust, it
assumes a fixed 180 deg orientation difference, lim-
iting gener ality. By contrast, this study introduces a
generic cross-view scene-graph setup using multiple
landmark images, which need n ot be sp a tially dense
and may have arbitrary viewing directio ns.
VISAPP 2025 - 20th International Conference on Computer Vision Theory and Applications
834

2.2 Graph Data Augmentation (GDA)
Recently, interest in graph mach ine learning has
grown, leading to the emergence of a new data aug-
mentation field called GDA (Ding et al., 2022). GDA
aims to address the gap between observed and ac-
tual graph s by perturbing available training samples
to create a diverse training set. The non-Euclidea n na-
ture of graph data makes this more challenging than
data augmentation for image and other data types.
Since the proce ss of observing grap hs varies widely
across application s (e.g., molecular graphs and so-
cial networks), there is no universal solution, and
application-specific methods have been explored. The
most relevant study is the SGA reported in (Knyazev
et al., 2021), which considered pipeline processing
with a graph neural network and formulated data aug-
mentation as a sampling process using GANs by per-
turbing intermediate results. However, their work
focused on 2D scene understanding, not cross-view
scenarios. Additionally, their GAN training requires
large a nnotated da ta sets, making it unsuitable for sev-
eral applications, including the sp arse training image
setup in this study. In contrast, applications involv-
ing 3D scene understanding, like the cross-view setup
used here, are largely unexplored. To address this, we
propose a new SGA method specifically designed for
a cross-view robot localization pipeline that includes
scene parsing, synthesis, and description.
3 APPROACH
The cross-view image localization framework c on-
sists of two independent but interacting modules:
scene gr aph generation (parsing ’P’ and description
’D’) and scene graph synthesis (synth e sis ’S’). Th e
scene graph gener ation module includes a scene pars-
ing step, which converts the scene in to a set of nodes
and edges, and a scene description step, which gen-
erates node attribute descriptors from the nodes. The
scene synthesis module transf orms the original view
into a sy nthetic view from a given viewpoint. With the
synthetic scene graph descrip tors produced by these
two modules, cross-view image localization can be
treated as an image retrieval problem in the space of
synthetic scene graph descriptors. In this section, we
begin with a base pipeline (3.1) and extend it to intro-
duce a scene-graph augmentatio n framework (3.2).
3.1 Base Pipeline
The base pipeline (PDS) performs these steps in the
following order: parsing (P) - description (D) - sy n-
thesis (S). For brevity, each submodule will be abbre-
viated using its respective symbol (i.e., ’P’, ’D’ , and
’S’) and the pipeline using the string of symbols (e.g.,
PDS).
3.1.1 Scene Parsing
Specifically, if rectangles overlap, they are con sid ered
close. In addition, even if they do not overlap, if the
distance between the pixels (for input images with
size 256×25 6) of the rectangles is within 20 pixels,
the rectangles are considered to be close. For scene
parsing, we employed a traditional two-step method
for scene graph generation. First, scene parts (i.e.,
nodes) were extracted from the in put image. Then,
these nodes we re connected via edges. Three me th-
ods?cascade segmenta tion (Zhou et al., 2017), SLICO
(Lei et al., 2021), and Detic (Zhou et al., 2022), which
will be described later?wer e considered fo r node de-
tection. Spatial proximity was used for edge connec-
tions, determ ined by bounding bo x proximity. Specif-
ically, r e ctangles were c onsidered close if they over-
lapped. Ad ditionally, even if they did not overlap,
rectangles were deemed close if the distance between
their p ixels (for input images of size 256×256) was
within 20 pixels.
Cascade segmentation (Zhou et al., 2017) is used
for semantic segmentation because it predicts pixel-
wise semantic labels and exhibits view invariance,
making it effective for cross-view image localization.
This method takes a 256× 256 RGB image as input,
with ResNet50 as the encoder and a Pyramid Pooling
Module-based model for the decoder.
SLICO (Lei et al., 2021) was used for appearance-
based segmen ta tion, as it provides useful cues inde-
pendent of semantic segmentation, par ticularly with
region decomposition resembling regular grids that
are view-independent.
Detic (Zhou et al., 2022) (model ”lvis”) was em-
ployed for object-level region segmentation, provid-
ing area boundar ie s independent of the other two
methods. Trained on a large dataset detecting over
20,000 obje cts, Detic may be affected by errors due
to bounding box shape approximation.
3.1.2 Scene Description
The scene descr iption step aims to describe each node
region of a scene graph using image descriptors with
discriminability and invariance. We used two types
of image descriptors: PatchNetVLAD (PNV) local
feature descriptors and convolutional neural network
(CNN) global features.
PNV (Hausler et al., 2021) was used as a lo-
cal feature descriptor because it extracts patch-level
SSGA: Synthetic Scene Graph Augmentation via Multiple Pipeline Variants
835
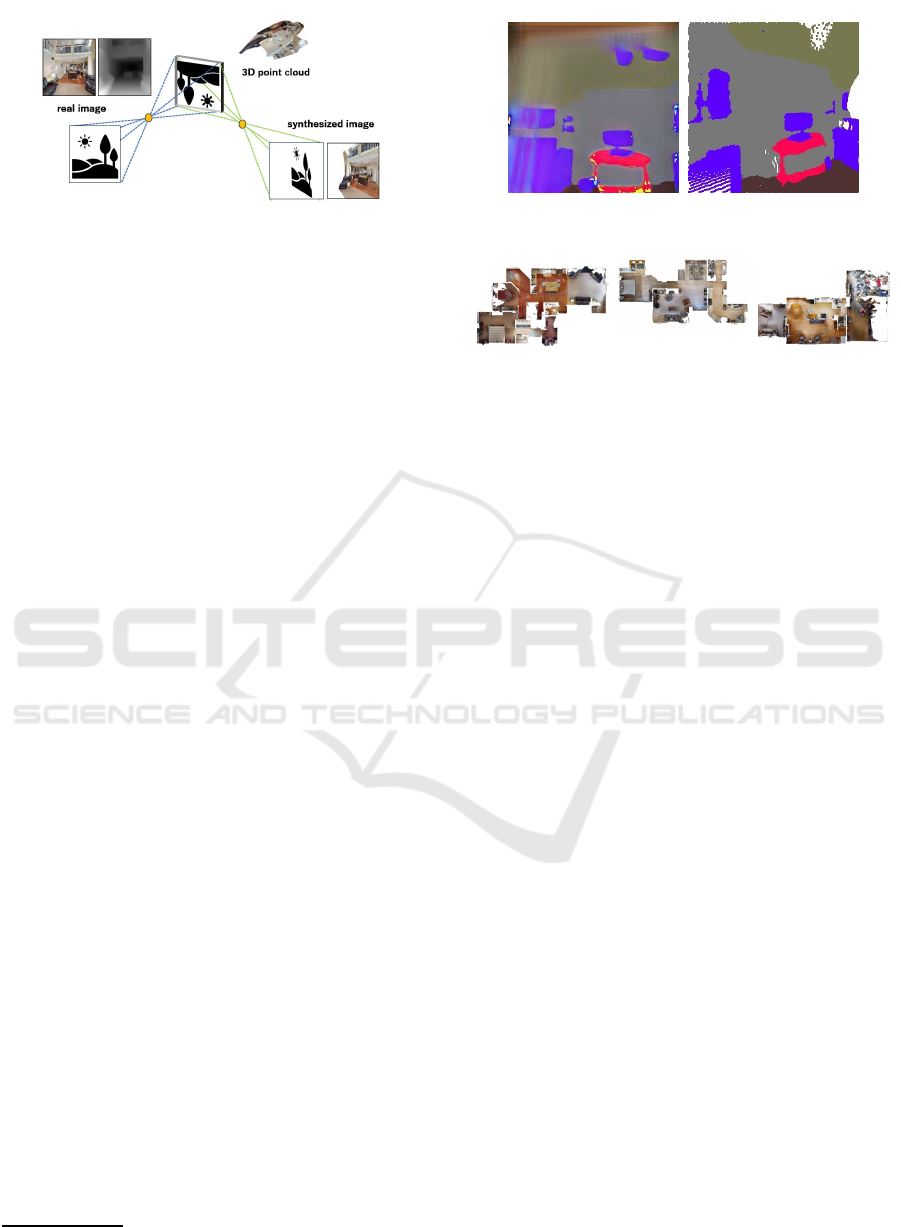
Figure 2: Scene synthesis based on monocular depth esti-
mation and pinhole camera model.
features from N etVLAD residuals and com bines the
global feature’s conditional invariance with th e local
feature’s view invariance. Specifically, 144 PNV fea-
tures of 512 dimensions were extracted per 256×2 56
image. For each region (node), the PNV features
are aggregated into a bag-of-words (BoW) histogram
(i.e., a n ode feature). BoW uses a prototype dictio-
nary of size k = 100, reciprocal rank (RR)-weigh ted
(Cormack et al., 2009), and a naive Bayes nearest-
neighbor (NBNN) (Tommasi and Caputo, 201 3) sim-
ilarity measure.
CNN was used as the global feature descriptor be-
cause it provides information about scene layout and
image region s. Existing CNN-based approaches in
visual self-localization generally use either the fully
connected layer of CNN as an image feature or the fi-
nal CNN layer for image classification. We use a hy-
brid approach. Af te r training an image classifier with
the Vgg16 CNN model, we translate the output classi-
fication results into class-specific reciprocal rank fe a-
tures (RRF) and use RRF features as graph node fea-
tures.
3.1.3 Scene Synthesis
The scene synthesis step converts a real image into a
3D point cloud and generates a synthetic scene image
for a given virtual viewpoint from any po int in the 3 D
point cloud. The virtual-viewpoint image genera tion
process is shown in Fig. 2. First, the RGB image
(256×256) is converted into a depth image using Mi-
DaS (Ranftl et al., 2022), a monocular depth estima-
tion model. The depth image is then converted into
a 3D point cloud usin g a pinhole camera model. The
calibration parameters for this model were learne d us-
ing indep e ndent trainin g data with public parameter
values
1
and internal parameters provided in Habitat’s
API (Szot et al., 2021). While recent studies show the
effectiveness of instant calibration adaptation through
few-shot learning, this supervised method is not ap-
plicable in our self-supervised setup, requiring offline
1
https://aihabitat.org/docs/habitat-api/view-transform-
warp.html
Figure 3: View synthesis results by SynSin (Wiles et al.,
2020) (left) and the proposed view-synthesis (right).
00800-TEEsavR23oF
00801-HaxA7YrQdEC
00802-wcojb4TFT35
Figure 4: Experimental environments.
calibration. As a result, depth prediction is less reli-
able comp ared to few-shot adaptation. MiDaS (Ran-
ftl et al., 2022) was used because it is one of the few
monocular depth estimation m odels designed for gen-
eralization across domains.
An example of the resulting syn thetic image is
shown in Fig. 3, comparing the proposed method with
SynSin (Wiles et al., 2020). Unlike NeRF and its vari-
ants, which require many training images with dense
viewpoints, SynSin only requires one viewpoint im-
age f or training, making it suitable for our single-view
training setup. However, SynSin’s synthetic images
exhibit GAN-specific artifacts, as shown in the figure.
In contrast, the proposed view synthesis method g e n-
erates artifact-free virtual viewpoint images.
3.2 Scene Graph Augmentation (SGA)
In this study, we argue that there is not only one domi-
nant pipeline (e.g., PDS), but also other multiple pos-
sible pipelines (e .g., PD) and their pipeline variants,
and that it is no t necessarily obvious which of these
variants is optimal (Fig. 1). The center of gravity and
the endpoints of the bounding box of each scene pa rt
in the synthetic scene graph are determined by the co-
ordinate transformation of the original scene graph.
Each pipeline compr ises the following indepen dent
modules: scene parsing (P), scene description (D),
and scene synth esis (S). For instance, pipeline vari-
ants that reorder the processing steps (SPD, PSD, and
PDS) and p ipeline variants that remove some pr ocess-
ing steps (S and P) are also formally valid. We ob-
served that these pipeline variants are of ten not only
formally valid but also pro mising in terms of per-
formance. That is, in comparison with the original
pipeline PDS, a SPD pipelin e variant with re ordered
processing steps is attractive beca use scene parsing is
VISAPP 2025 - 20th International Conference on Computer Vision Theory and Applications
836
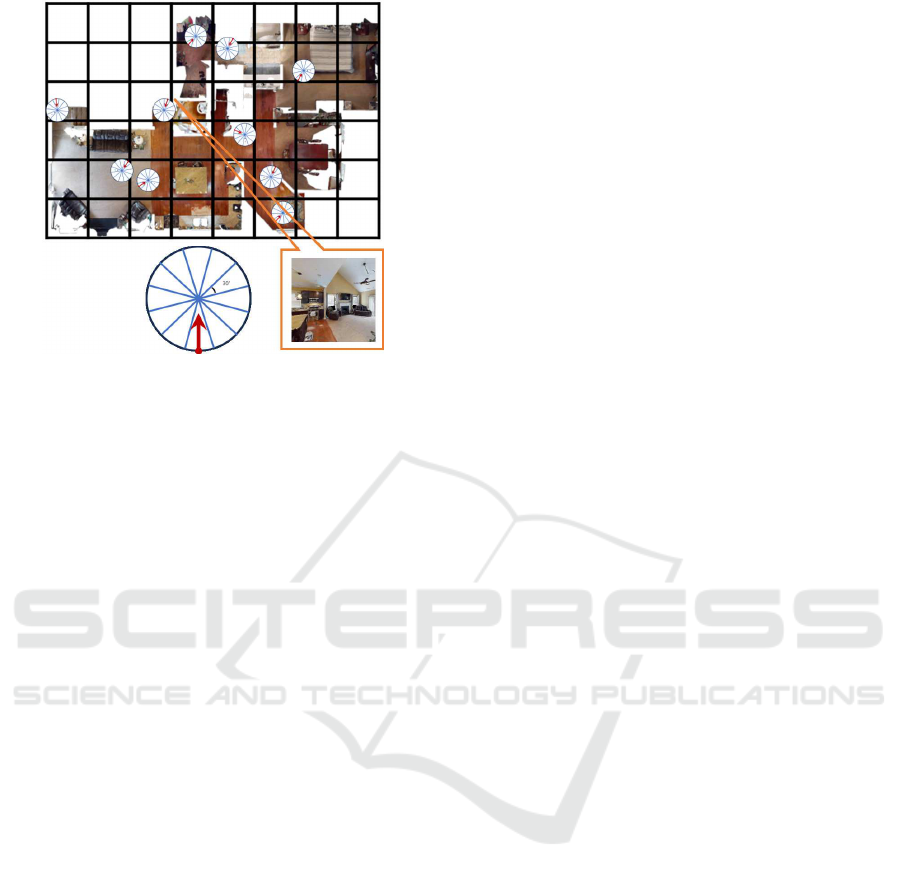
Figure 5: Experimental setup. The workspace is first par-
titioned into a grid of location cells. Each location cell is
then further partitioned into 12 place classes with different
orientations.
performed in a synthetic view, and the scene parts can
reflect the la yout of th e synthetic view. DSP and SPD
differ in that the for mer uses descripto rs derived from
the original image, whereas the latter uses descrip-
tors derived from the sy nthetic image. In contrast, the
pipeline variant PD that skips the scene synthesis step
S perfor ms scene description based only on the origi-
nal view. Therefore, it is no t su sceptible to scene pars-
ing e rrors and may be a better choice for scenes with
complex layouts that are difficult to parse. In addition ,
the pipeline variant DS, which skips the parsing step P
and describes the scene with o nly a single whole im-
age node without decomposing the scene into nodes
and edges, is attractive because by definition, it is not
affected by scene parsing errors.
Thus, we integrated the baseline PDS with other
possible pipelin e variants: PSD, SPD, DSP, PD, DS,
SD, and D , using a graph convolutiona l neur a l net-
work (GCN) (Kipf and Welling, 2017). Similar use
of GCN as an integration tool was explored in previ-
ous work on SGA (Knyazev et al., 2021). However,
in the previous study, the scene synthesis problem
was not addressed. Consequently, the ensemble of
pipeline variants genera te d by the interaction of scene
synthesis and scene graph generation was not consid-
ered. Therefore , the proposed approach is different.
In the proposed approach , each pipeline-sp ecific GCN
maps an input image onto a class-specific probability
map. Subsequently, a late fusion step is performed
to fuse the class-specific probability maps from all
pipeline-specific GCNs using the RR fusion in the
spirit of majority voting ensemble strategy. In th is
framework, we observed that it is more effective to
assign higher we ights to whole-image nodes than to
component node s. For all K nodes, that is, part nodes,
excluding the whole image node, a weight adjustment
is performed such that the node feature vector is mul-
tiplied by 1/K. When a system is composed of mul-
tiple pipeline variants, the class-specific probability
map output from each pipeline variant is converted
into a cla ss-spe cific reciprocal ra nk vector, and then a
single classification is created by recip rocal rank fu-
sion, which makes the final classification result of the
system.
4 EXPERIMENTS
We conducted evaluation expe riments in a vir-
tual workspace constructed using Hab itat-Sim (Szot
et al., 2021) and the Habitat-Matterport 3D Re-
search D a ta set (HM3D) (Ramakrishnan et al., 2021).
This virtual workspa ce provides photo -realistic im-
ages unique to diverse viewpoints with ground-truth
annotations. Th e Habitat-Sim workspace is popular
and proven in rec ent embodied AI applications such
as image goal navigation (Mezghani et al., 2022) and
thus is considered an important application of cross-
view localization.
4.1 Dataset
Habitat-Sim is a flexible high-performance 3D sim-
ulator with configurable agents, sensors, an d gen-
eral 3D dataset processing. It prioritizes simu-
lation speed over the breadth of simulation capa-
bilities, achieving thousands of frames per second
(FPS) on a single thread and 10,000 FPS processes
on a single GPU when rend e ring scenes from the
HM3D dataset. HM3D is a large-scale 3D indoor
space dataset, ge nerated from real-world environ-
ments, and there are 1000 types of scenes, such as
residences, c ommercial facilities, and public facili-
ties. We experimented using three environments with
workspace na mes “00800-TEEsavR23oF”, “00801-
HaxA7YrQdEC”, and “00802-wcojb4 TFT35” from
the workspaces of the HM3D dataset. A bird’s eye
view of the workspace is shown in Fig. 4 . The size of
the images a cquired by the robot is set to 256×256.
Additionally, the dataset contains information on the
viewpoint’s location (x,y) and orientation θ associ-
ated with each image.
First, the workspace was partitioned into a grid of
location cells with dimensions of 2[m]×2[m]. Each
view image in the workspace was considered to be-
long to a location cell if the visibility cone, deter-
mined by its viewpoint, included the centroid of the
location cell. If multiple such locatio n cells exist, the
SSGA: Synthetic Scene Graph Augmentation via Multiple Pipeline Variants
837
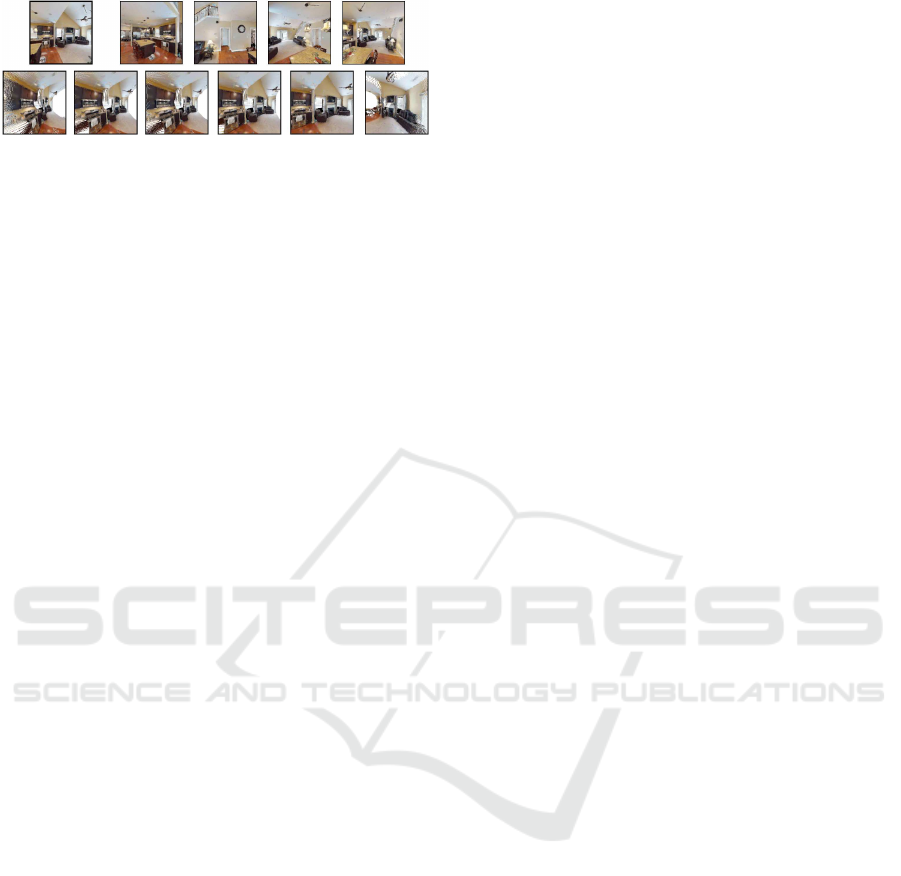
Figure 6: Example results. In the upper row, from left to
right, each panel is a training image, 2 level 2 test images,
and 2 level 3 test images. The bottom row is the correspond-
ing composite image of each virtual viewpoint.
cell with the center of gravity closest to its viewpoint
is selected. In this experiment, we rand omly selected
ten location cells fo r each workspace . Furthermore, as
shown in Fig. 5, 12 place classes with different orien-
tations were defined for each location c ell. There fore,
the total number of place classes for each workspace
was 12×10 = 120.
To investigate cross-view localization perfor-
mance, only one training image was given for each of
the 10 location cells. That is, of the 12 plac e classes
belonging to one location cell, a training image is
available for one class, and is not available for the
remaining 11 classes. There is only one place class
for which a real training image is available, and in
addition, care is taken to ensure that different view-
points are sampled as the test images’ viewpoints for
this class. For classes for which there are no train-
ing images, methods with the ‘S’ (Synthesis) module
can synthesize pseud o-training image s from available
training im ages, while methods without the ‘S’ mod-
ule have no choice but to simply use available training
images as they are. 1500 test images independent of
training images were sampled for each class.
4.2 Performance Index
In this experim ent, we used Top-1 Accuracy, Top-5
Accuracy, and mean reciprocal rank (MRR) as per-
formance indic ators. Top-1 accuracy is useful be-
cause it reflects the perce ntage of test data in which
both location and orientation ar e c orrect. Top-5 and
MRR are useful for determining the percentag e of
test da ta in which only either location or or ie ntation
is correct. This latter type of performance metric is
particularly impo rtant in the context of multi-view
self-localization , multi-hypothesis tracking, and m a p-
based navigation, where it is not always necessary to
uniquely refine both loc a tion and orientation from a
single-view observation.
Because the d ifficulty of cross-view image local-
ization is significantly affected by the difference in
viewpoint between the query and test images, we de-
fine three levels of d ifficulty and use them to inves-
tigate the ir relatio nship with the estimation accuracy.
Specifically, view overlap rate (VO) [%], the area of
the intersection of 2D visibility area on the bird’s-eye
view 2D plane between the query and test viewpoints,
was calculated from the ground-truth (provided by
Habitat-Sim) of the robot’s viewpoints and occluding
obstacles. Then, the d ifficulty levels were classified
as follows: level 1: VO>60, level 2: 30<VO≤60,
and level 3: VO≤30.
4.3 Results
Table 1 compares th e performance of the proposed
method with that of several baseline and ab la tion
methods. From the table, it is evident that com-
pared to the baseline methods, the proposed method
(“ours”) exhibits superior performance overall across
most dataset levels. Cross-view image localization,
the primary focus of this re search, operates under the
assumption of “level 2” and “level 3” difficulty lev-
els. I n “level 2” and “level 3”, the proposed method
outperforms the baseline meth ods in the performance
index Top-1 Accuracy. I n addition, the performance
indicators Top-5 A ccuracy and MRR are significantly
higher. Therefore, the effectiveness of the proposed
method was confirmed.
When comparing the two descriptors, CNN (DS)
and PNV (DS, SD), it is observed that for Top-1 A c-
curacy, the performance of CNN tends to be higher
than that of PNV, whereas for Top-5 Accur a cy, the
performance of PNV tends to be h igher than that
of CNN. This is because CNN, which is a global
feature descriptor (from the e ntire image), exhibits
strong char a cteristics for identifying the entire im-
age. Therefore, it can predict location classes with
higher accura cy tha n PNV. In contrast to global fea-
ture descriptors, PNV, which is a local feature de-
scriptor (with partial features), is resistant to changes
due to rotation and translation. Therefore, it can nar-
row down the correct location cla ss candidates with
higher accuracy than CNN. Comparin g the cases with
synthesis (DS, SD) and without synthesis (D), we can
confirm the effectiveness of the scene synthesis.
Regarding the method with a synthesis module
(‘S’), an interesting difference in behavior was ob-
served between the case of transferring the real im-
age descriptor to the synthetic viewpoint (DS) and the
case of using the synthetic image descriptor (SD). . It
can be seen that SD tends to have better overall pe rfor-
mance than D S. DS tends to perform better than SD
for top- 1 accuracy, and DS performs better for top-
5 accuracy. This shows that DS is better than SD in
terms of accuracy, but the oppo site is true in terms of
robustness.
The pipeline variant SD may be effective in pre-
VISAPP 2025 - 20th International Conference on Computer Vision Theory and Applications
838

Table 1: Performance results.
Top-1[%] Top-5[%] MRR[%]
00800
L1 L2 L3 L1 L2 L3 L1 L2 L3
CNN 31.0 14.7 12.2 35.1 20.5 19.7 35.3 19.7 17.0
P (DS) 17.0 10.9 6.4 52.6 28.9 22.6 32.3 21.1 13.7
P (SD) 28.2 13.2 9.3 44.2 26.6 18.8 35.8 20.2 14.7
P-SE (PDS) 21.6 13.6 3.5 52.6 37.3 23.0 35.9 24.1 12.0
P-SE (PSD) 26.6 14.3 1.2 41.4 26.6 17.9 34.4 21.7 16.0
P-DE (PDS) 20.8 12.6 5.4 52.4 32.6 20.5 34.8 22.6 12.5
P-DE (PSD) 23.3 10.7 7.6 36.3 24.2 12.4 30.9 18.0 11.5
P-SL (PDS) 27.8 10.8 7.9 60.0 30.4 22.7 42.2 21.2 15.0
P-SL (PSD) 29.5 9.9 7.1 47.7 28.7 19.8 38.4 19.9 13.5
P-SL (SPD1) 24.4 14.6 9.3 59.7 36.7 22.9 40.1 25.5 16.1
P-SL (SPD2) 30.2 15.0 7.9 42.8 24.5 15.9 36.9 20.7 12.9
Ensemble (Ours.) 31.4 17.5 13.7 55. 8 32.3 23.2 42.5 26.2 18.7
00801
CNN 34.8 10.5 4.06 39.3 16.8 6.7 0.3850.1500.073
P (DS) 15.0 7.6 1.94 51.6 33.9 14.2 30.6 19.2 8.6
P (SD) 26.7 10.0 5.74 52.3 21.7 8.68 37.8 17.1 8.8
P-SE (PDS) 18.0 9.3 4. 8 49.2 31.5 12.7 32.7 20.0 9.8
P-SE (PSD) 28.6 10.1 4.2 43.1 18.4 8.3 36.7 16.2 7.3
P-DE (PDS) 15.8 6.8 2.1 41.7 23.0 9.0 27.5 15.1 6.7
P-DE (PSD) 16.8 7.0 3.0 31.2 14.0 6.6 25.1 12.2 6.2
P-SL (PDS) 17.6 9.7 3.4 55.7 28.1 13.0 33.8 19.6 9.0
P-SL (PSD) 28.3 9.5 3.9 45.8 15.8 7.5 37.1 15.0 7.3
P-SL (SPD1) 20.9 7.1 4.2 50.1 27.1 12.4 34.8 17.6 11.3
P-SL (SPD2) 24.6 8.9 4.7 46.6 22.3 9.5 35.1 16.3 9.7
Ensemble (Ours.) 31.2 11.0 4.75 59. 5 30.3 13.1 43.9 20.7 10.0
00802
CNN 38.4 10.0 3.67 40.7 15.1 4.1 41.7 14.5 6. 4
P (DS) 30.5 15.1 5.72 66.7 37.1 16.2 46.3 25.5 10.7
P (SD) 36.3 11.3 4.20 54.3 26.3 12.2 43.9 20.3 9.5
P-SE (PDS) 29.2 14.1 8.4 56.8 38.8 16.5 42.3 25.9 13.1
P-SE (PSD) 37.6 10.1 3.9 52.0 22.6 13.0 45.0 18.3 9.5
P-DE (PDS) 16.8 9.5 3.3 44.3 28.5 6.6 28.6 19.0 6.7
P-DE (PSD) 26.0 11.2 3.4 43.5 26.3 7.2 43.5 19.0 7.1
P-SL (PDS) 22.7 11.3 8.3 65.1 39.6 20.0 41.1 24.6 14.5
P-SL (PSD) 37.4 10.4 3.9 56.4 31.4 12.0 46.5 20.8 10.2
P-SL (SPD1) 30.9 16.3 7.1 63.3 42.4 16.6 45.6 28.6 12.6
P-SL (SPD2) 38.6 12.8 3.9 61.4 30.9 12.2 48.8 22.1 9.9
Ensemble (Ours.) 40.0 13.2 4.16 65. 4 42.5 17.4 51.6 26.2 10.9
00800: 00800-TEEsavR23oF, 00801: 00801-HaxA7YrQdEC,
00802: 00802-wcojb4TFT35, L1: level1, L2: level2, L3: level3,
P: PatchNetVLAD, SL: SLICO, SE: cascade segmentation, DE: Detic
dicting both location and orien ta tion; however, be-
cause it relies on the accuracy of synthetic images
from a virtual viewpoint, recognition instability tends
to be significant. In contrast, the pip eline variant DS
does not exhibit such instability in recognition. How-
ever, its ability to discriminate both location and ori-
entation tends to be weaker.
We also compared scene graphs containing on ly
whole nodes (e.g., DS) and scen e graphs consisting of
whole nodes and part grou p nodes (e.g., PDS). The re-
sults show that PDS tends to perform better than DS,
confirmin g th e effectiveness of scene p a rsing. Re-
garding the performance of each pipeline, it is ob-
served that the pipelines with high performance vary
from data sets. Thus, all the eight types of pipelines
exhibit their own unique strengths and weaknesses. It
can b e concluded that combining all the pipeline vari-
ants into an en semble achieves a stable and consistent
performance improvement.
5 CONCLUSIONS AND FUTURE
WORKS
In this work , we tackled the challenge of cross-
view image localization using synthetic scene graphs.
Starting with a standard pipeline for scene graph-
based localization, we proposed using pipeline vari-
ants as sup e rvision cues to enhance robustness and
discriminativity. Through pipeline ensembles, abla-
tion studies, and performance validation, we demon-
strated that the proposed self-su pervision cues con-
sistently improve performance. While the method’s
effectiveness is clear, fu rther improvements are pos-
sible. Both scene graph generation and view sy n-
thesis show strong invariance, and we believe the
framework can be enhanced by integrating various
self-localization techniques. Ensemb le learning is
a promising direction for future work (Islam et al.,
2003).
REFERENCES
Cormack, G. V., Clarke, C. L. A., and B¨uttcher, S. (2009).
Reciprocal rank fusion outperforms condorcet and in-
dividual rank learning methods. In Proceedings of the
32nd Annual International ACM SIGIR Conference on
Research and Development in Information Retrieval,
pages 758–759.
Ding, K., Xu, Z., Tong, H., and Liu, H. (2022). Data aug-
mentation f or deep graph learning: A survey. ACM
SIGKDD Explorations Newsletter, 24:61–77.
Gawel, A., Del Don, C., Siegwart, R., Nieto, J., and Cadena,
C. (2018). X-view: Graph-based semantic multi-view
localization. IEEE Robotics and Automation Letters,
3(3):1687–1694.
Hausler, S., Garg, S., Xu, M., Milford, M., and Fischer, T.
(2021). Patch-netvlad: Multi-scale fusion of locally-
global descriptors for place recognition. In IEEE Con-
ference on Computer Vision and Pattern Recognition,
CVPR 2021, virtual, June 19-25, 2021, pages 14141–
14152.
Islam, M. M., Yao, X., and Murase, K. (2003). A construc-
tive algorithm for training cooperative neural network
ensembles. IEEE Transactions on neural networks,
14(4):820–834.
SSGA: Synthetic Scene Graph Augmentation via Multiple Pipeline Variants
839

Kipf, T. N. and Wel ling, M. (2017). Semi-supervised classi-
fication with graph convolutional networks. In 5th In-
ternational Conference on Learning Representations,
ICLR 2017.
Knyazev, B., de Vries, H., Cangea, C., Taylor, G. W. ,
Courville, A., and Belilovsky, E. (2021). Generative
compositional augmentations for scene graph predic-
tion. In Proceedings of the IEEE/CVF International
Conference on Computer Vision, pages 15827–15837.
Lei, K.-P., Feng, X.-X., and Yu, W.-S. (2021). A shadow
detection method based on slico superpixel segmenta-
tion. In 2021 International Symposium on Computer
Technology and Information Science (ISCTIS), pages
294–298. IEEE.
Mezghani, L., Sukhbaatar, S., Lavril, T., Maksymets,
O., Batra, D., Bojanowski, P., and Alahari, K.
(2022). Memory-augmented reinforcement learning
for image-goal navigation. In IEEE/RSJ International
Conference on Intelligent Robots and Systems, pages
3316–3323.
Parihar, U. S., Gujarathi, A., Mehta, K., Tourani, S., Garg,
S., Milford, M., and Krishna, K. M. (2021). Rord:
Rotation-robust descriptors and orthographic views
for local feature matching. In IEEE/RSJ International
Conference on Intelligent Robots and Systems, pages
1593–1600.
Ramakrishnan, S. K., Gokaslan, A., Wijmans, E.,
Maksymets, O., C legg, A., Turner, J. M., Un-
dersander, E. , Galuba, W., Westbury, A., Chang,
A. X., Savva, M., Zhao, Y., and Batra, D. (2021).
Habitat-matterport 3d dataset (HM3D): 1000 large-
scale 3d environments for embodied AI. CoRR,
abs/2109.08238.
Ranftl, R., Lasinger, K., Hafner, D., Schindler, K., and
Koltun, V. (2022). Towards robust monocular depth
estimation: Mixing datasets for zero-shot cross-
dataset transfer. IEEE Trans. Pattern Anal. Mach. In-
tell., 44(3):1623–1637.
Szot, A., Clegg, A., Undersander, E., Wijmans, E., Zhao,
Y., Turner, J., Maestre, N., Mukadam, M., Chaplot,
D. S., Maksymets, O., Gokaslan, A., Vondrus, V.,
Dharur, S., Meier, F., Galuba, W., Chang, A. X., Kira,
Z., Koltun, V., Malik, J., Savva, M., and Batra, D.
(2021). Habitat 2.0: Training home assistants to rear-
range their habitat. In Advances in Neural Information
Processing Systems 34, pages 251–266.
Tommasi, T. and Caputo, B. (2013). Frustratingly easy
NBNN domain adaptation. In IEEE International
Conference on Computer Vision, ICCV 2013, Sydney,
Australia, December 1-8, 2013, pages 897–904.
Tourani, S., Desai, D., Parihar, U. S., Garg, S., S arvadevab-
hatla, R. K., Milford, M., and Krishna, K. M. (2021).
Early bird: Loop closures from opposing viewpoints
for perceptually-aliased indoor environments. In Pro-
ceedings of the 16th International Joint Conference
on Computer Vision, Imaging and Computer Graph-
ics Theory and Applications, pages 409–416.
Wiles, O., Gkioxari, G., Szeliski, R., and Johnson, J. (2020).
Synsin: End-to-end view synthesis from a single im-
age. In 2020 IEEE/CVF Conference on Computer Vi-
sion and Pattern Recognition, pages 7465–7475.
Zhan, F., Yu, Y., Wu, R., Zhang, J., Lu, S., Liu, L., Ko-
rtylewski, A., Theobalt, C., and Xing, E. (2023). Mul-
timodal image synthesis and editing: A survey and
taxonomy. IEEE Transactions on Pattern Analysis
and Machine Intelligence.
Zhang, X., Wang, L., and Su, Y. (2021). Visual place recog-
nition: A survey from deep learning perspective. Pat-
tern Recognit., 113:107760.
Zhou, B., Zhao, H., Puig, X., Fidler, S., Barriuso, A., and
Torralba, A. (2017). Scene parsing through ade20k
dataset. In Proceedings of the IEEE conference on
computer vision and pattern recognition, pages 633–
641.
Zhou, X., Girdhar, R., Joulin, A., Kr¨ahenb¨uhl, P., and
Misra, I. (2022). Detecting twenty-thousand classes
using image-level supervision. In Computer Vision –
ECCV 2022, pages 350–368, Cham.
VISAPP 2025 - 20th International Conference on Computer Vision Theory and Applications
840
