
RandSaliencyAug: Balancing Saliency-Based Data Augmentation for
Enhanced Generalization
Teerath Kumar
1 a
, Alessandra Mileo
2 b
and Malika Bendechache
3 c
1
CRT-AI & ADAPT Research Centre, School of Computing, Dublin City University, Dublin, Ireland
2
INSIGHT & I-Form Research Centre, School of Computing, Dublin City University, Dublin, Ireland
3
ADAPT & Lero Research Centres, School of Computer Science, University of Galway, Galway, Ireland
Keywords:
Data Augmentation, Deep Learning, Image Classification, Saliency Augmentation.
Abstract:
Improving model generalization in computer vision, especially with noisy or incomplete data, remains a sig-
nificant challenge. One common solution is image augmentation through occlusion techniques like cutout,
random erasing, hide-and-seek, and gridmask. These methods encourage models to focus on less critical in-
formation, enhancing robustness. However, they often obscure real objects completely, leading to noisy data
or loss of important context, which can cause overfitting. To address these issues, we propose a novel augmen-
tation method, RandSaliencyAug (RSA). RSA identifies salient regions in an image and applies one of six new
strategies: Row Slice Erasing, Column Slice Erasing, Row-Column Saliency Erasing, Partial Saliency Eras-
ing, Horizontal Half Saliency Erasing, and Vertical Half Saliency Erasing. RSA is available in two versions:
Weighted RSA (W-RSA), which selects policies based on performance, and Non-Weighted RSA (N-RSA),
which selects randomly. By preserving contextual information while introducing occlusion, RSA improves
model generalization. Experiments on Fashion-MNIST, CIFAR10, CIFAR100, and ImageNet show that W-
RSA outperforms existing methods.
1 INTRODUCTION
Convolutional neural networks (CNNs) have achieved
significant success in computer vision tasks such as
image classification (Krizhevsky et al., 2017; Ku-
mar et al., 2023a), object detection (Kumar et al.,
2023a), and semantic segmentation (Kumar et al.,
2023a). However, their large number of parame-
ters can lead to overfitting and hinder generaliza-
tion (Zhong et al., 2020). To mitigate this, vari-
ous regularization and data augmentation techniques
have been proposed. Image data augmentation, in
particular, is crucial for state-of-the-art performance.
These techniques fall into five categories: spatial aug-
mentations (Krizhevsky et al., 2017), color distor-
tion (Kumar et al., 2023a), image mixing (Kumar
et al., 2023a), saliency-based augmentations (Uddin
et al., 2020), and information-erasing (Kumar et al.,
2023a).
Spatial augmentations involve basic transforma-
tions like rotation and flipping. Color distortion
a
https://orcid.org/0000-0001-8769-4989
b
https://orcid.org/0000-0002-6614-6462
c
https://orcid.org/0000-0003-0069-1860
modifies image colors (e.g., random brightness ad-
justments). Image mixing techniques, such as
MixUp (Zhang et al., 2017) and CutMix (Yun et al.,
2019), combine images. Saliency-based methods
leverage saliency detection for targeted augmenta-
tions (Uddin et al., 2020). Information-erasing meth-
ods, including Cutout (DeVries and Taylor, 2017),
Random Erasing (RE) (Zhong et al., 2020), Hide-and-
Seek (HaS) (Kumar Singh and Jae Lee, 2017), and
GridMask (GM) (Chen et al., 2020), force the model
to learn robust features by masking or erasing parts of
the image. These methods help improve generaliza-
tion by challenging the model to focus on more infor-
mative features.
While information-erasing data augmentation
techniques promote diversity by introducing occlu-
sions, they may either completely erase targeted ob-
jects (Fig. 1(a)), leading to noisy data, or remove con-
textual information (Fig. 1(b)), causing overfitting by
forcing the model to focus only on the most salient
features. To balance these issues while providing oc-
clusion perspectives, we propose RandSaliencyAug,
a simple yet effective approach that detects salient
regions and applies one of several erasing strategies
Kumar, T., Mileo, A. and Bendechache, M.
RandSaliencyAug: Balancing Saliency-Based Data Augmentation for Enhanced Generalization.
DOI: 10.5220/0013098700003912
Paper published under CC license (CC BY-NC-ND 4.0)
In Proceedings of the 20th International Joint Conference on Computer Vision, Imaging and Computer Graphics Theory and Applications (VISIGRAPP 2025) - Volume 3: VISAPP, pages
283-290
ISBN: 978-989-758-728-3; ISSN: 2184-4321
Proceedings Copyright © 2025 by SCITEPRESS – Science and Technology Publications, Lda.
283
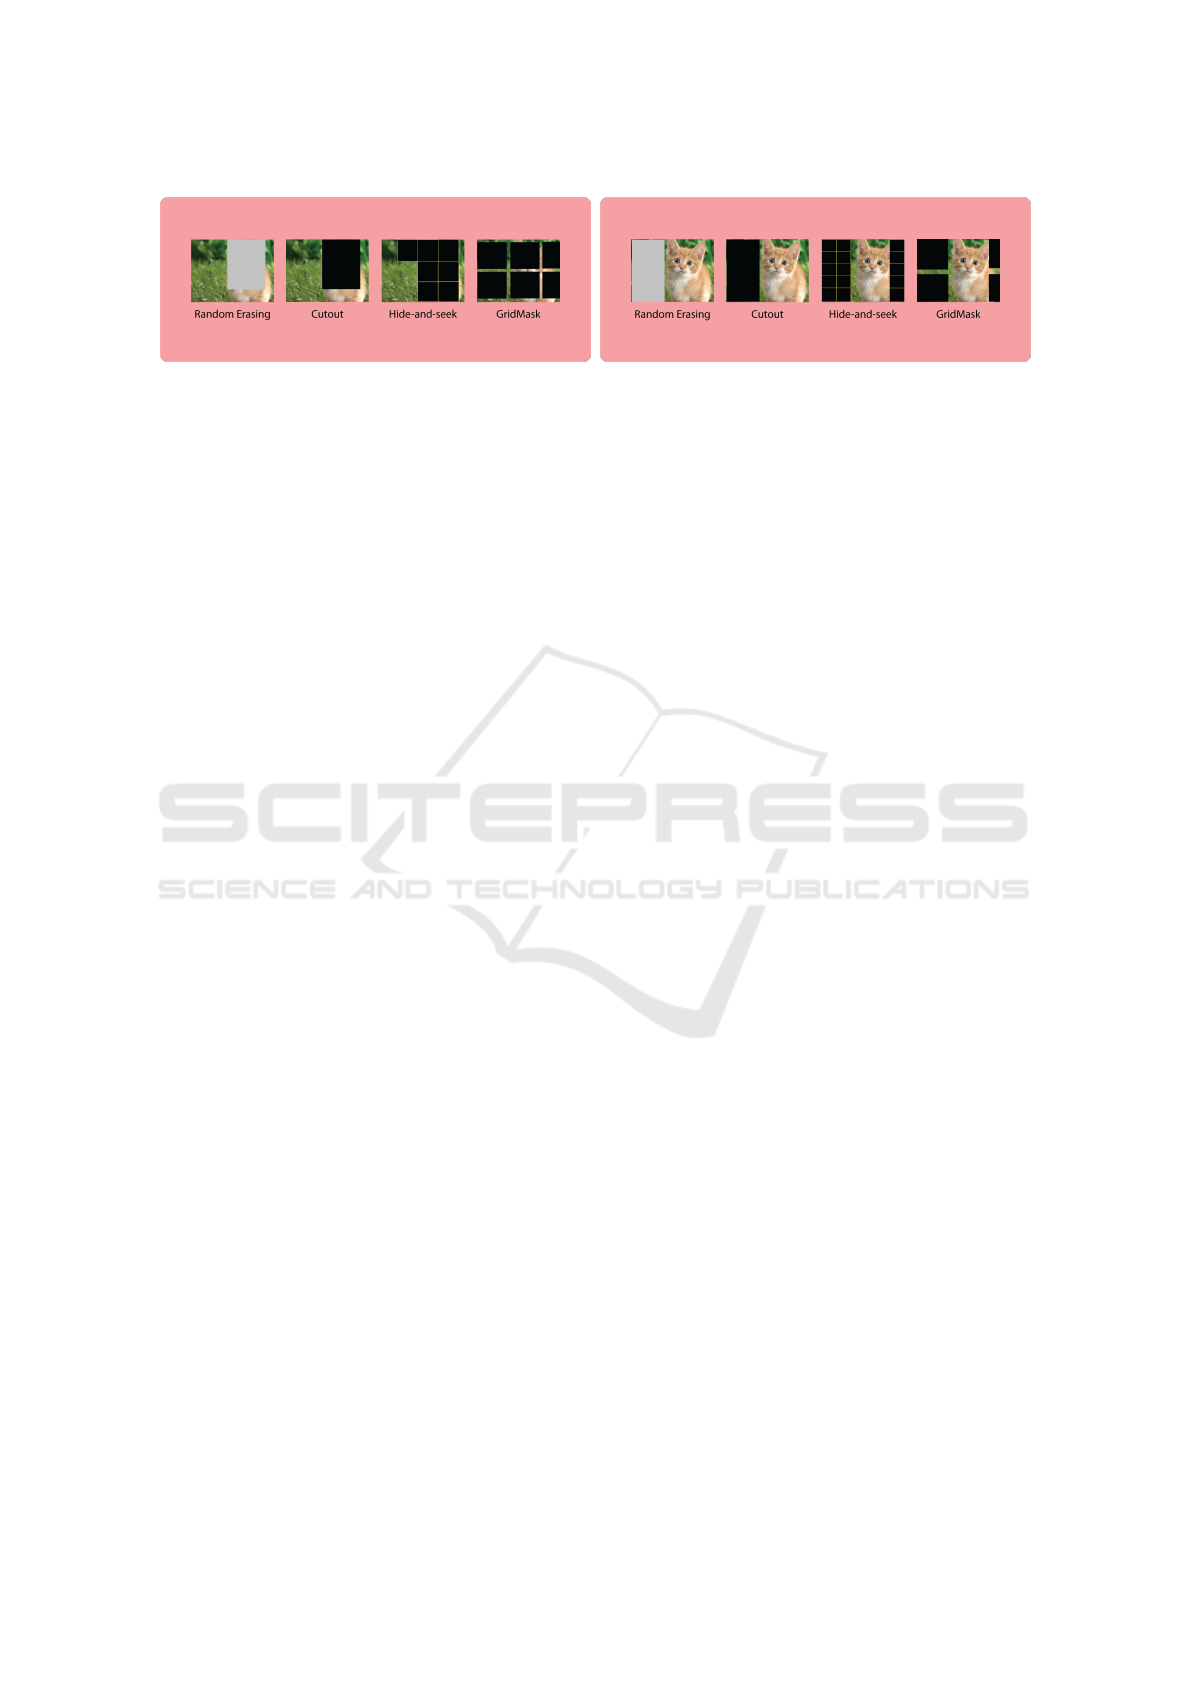
(a) Is data helpful for model? (b) Are these samples helpful for model generalization?
Figure 1: Can we trade-off between complete object erasing and non-object erasing?
(Row Slice Erasing, Column Slice Erasing, Row-
Column Saliency Erasing, Partial Saliency Erasing,
Horizontal/Vertical Half Saliency Erasing) either ran-
domly or based on model performance. Unlike RE
and Cutout, which remove entire objects, or HaS and
GM, which mask squares, RandSaliencyAug offers a
more controlled occlusion. The process is illustrated
in Fig. 2. Our contributions are:
• We propose RandSaliencyAug, a data augmenta-
tion method that detects salient regions and ap-
plies one of six novel strategies.
• The six strategies (Row Slice Erasing, Column
Slice Erasing, Row-Column Saliency Erasing,
Partial Saliency Erasing, Horizontal Half Saliency
Erasing, and Vertical Half Saliency Erasing) opti-
mize performance.
• We explore two variations: weighted (based on
accuracy performance relative to the baseline) and
non-weighted (randomly selecting a strategy).
• We validate the approach with experiments on
multiple image datasets.
2 RELATED WORK
2.1 Saliency Detection
Saliency detection mimics the human visual sys-
tem and is divided into bottom-up and top-down
approaches. Bottom-up methods (Hou and Zhang,
2007; Achanta et al., 2009; Montabone and Soto,
2010) focus on low-level features, such as Achanta et
al.’s frequency-tuned approach (Achanta et al., 2009)
and Hou & Zhang’s spectral residual method (Hou
and Zhang, 2007). Montabone & Soto (Montabone
and Soto, 2010) proposed a fast human detection
method applicable to other saliency tasks. Top-
down methods use supervised learning and deep mod-
els (Deng et al., 2018; Qin et al., 2019), like Deng et
al.’s R3Net (Deng et al., 2018), and Qin et al.’s multi-
scale model (Qin et al., 2019), but they often suffer
from dataset bias, limiting generalization.
Our research adopts a bottom-up approach for
saliency detection to ensure robustness without rely-
ing on labeled data or domain-specific information.
We use Montabone et al.’s method (Montabone and
Soto, 2010) due to its proven performance and effi-
ciency (Uddin et al., 2020).
2.2 Data Augmentation
Neural network generalization is enhanced through
regularization and data augmentation. Techniques
like Dropconnect (Wan et al., 2013), adaptive
dropout (Ba and Frey, 2013), and batch normaliza-
tion (Ba and Frey, 2013) add noise during training,
while image mixing methods such as CutMix and
Mixup modify images, labels, and loss functions for
regularization.
Data augmentation includes basic transformations
(e.g., rotation), color adjustments (e.g., brightness),
and advanced methods like AutoAugment (Hataya
et al., 2020) and Faster AutoAugment (Hataya et al.,
2020). Saliency-based augmentation methods (Uddin
et al., 2020) preserve or erase salient regions, with our
focus on the latter.
Methods like Cutout, Random Erasing, Hide-and-
Seek, and GridMask randomly erase image parts but
may remove critical objects or context, leading to
overfitting (Fig. 1(a), 1(b)). We introduce saliency-
based erasure to balance occlusion while mitigating
these issues.
3 PROPOSED APPROACH
In this section, we explain the proposed six data aug-
mentation strategies for search space and the pro-
posed approach based on the search space.
3.1 Search Space - Data Augmentation
Search space consists of the six proposed data aug-
mentation approaches. Each of the data augmenta-
tions is discussed in the following.
VISAPP 2025 - 20th International Conference on Computer Vision Theory and Applications
284
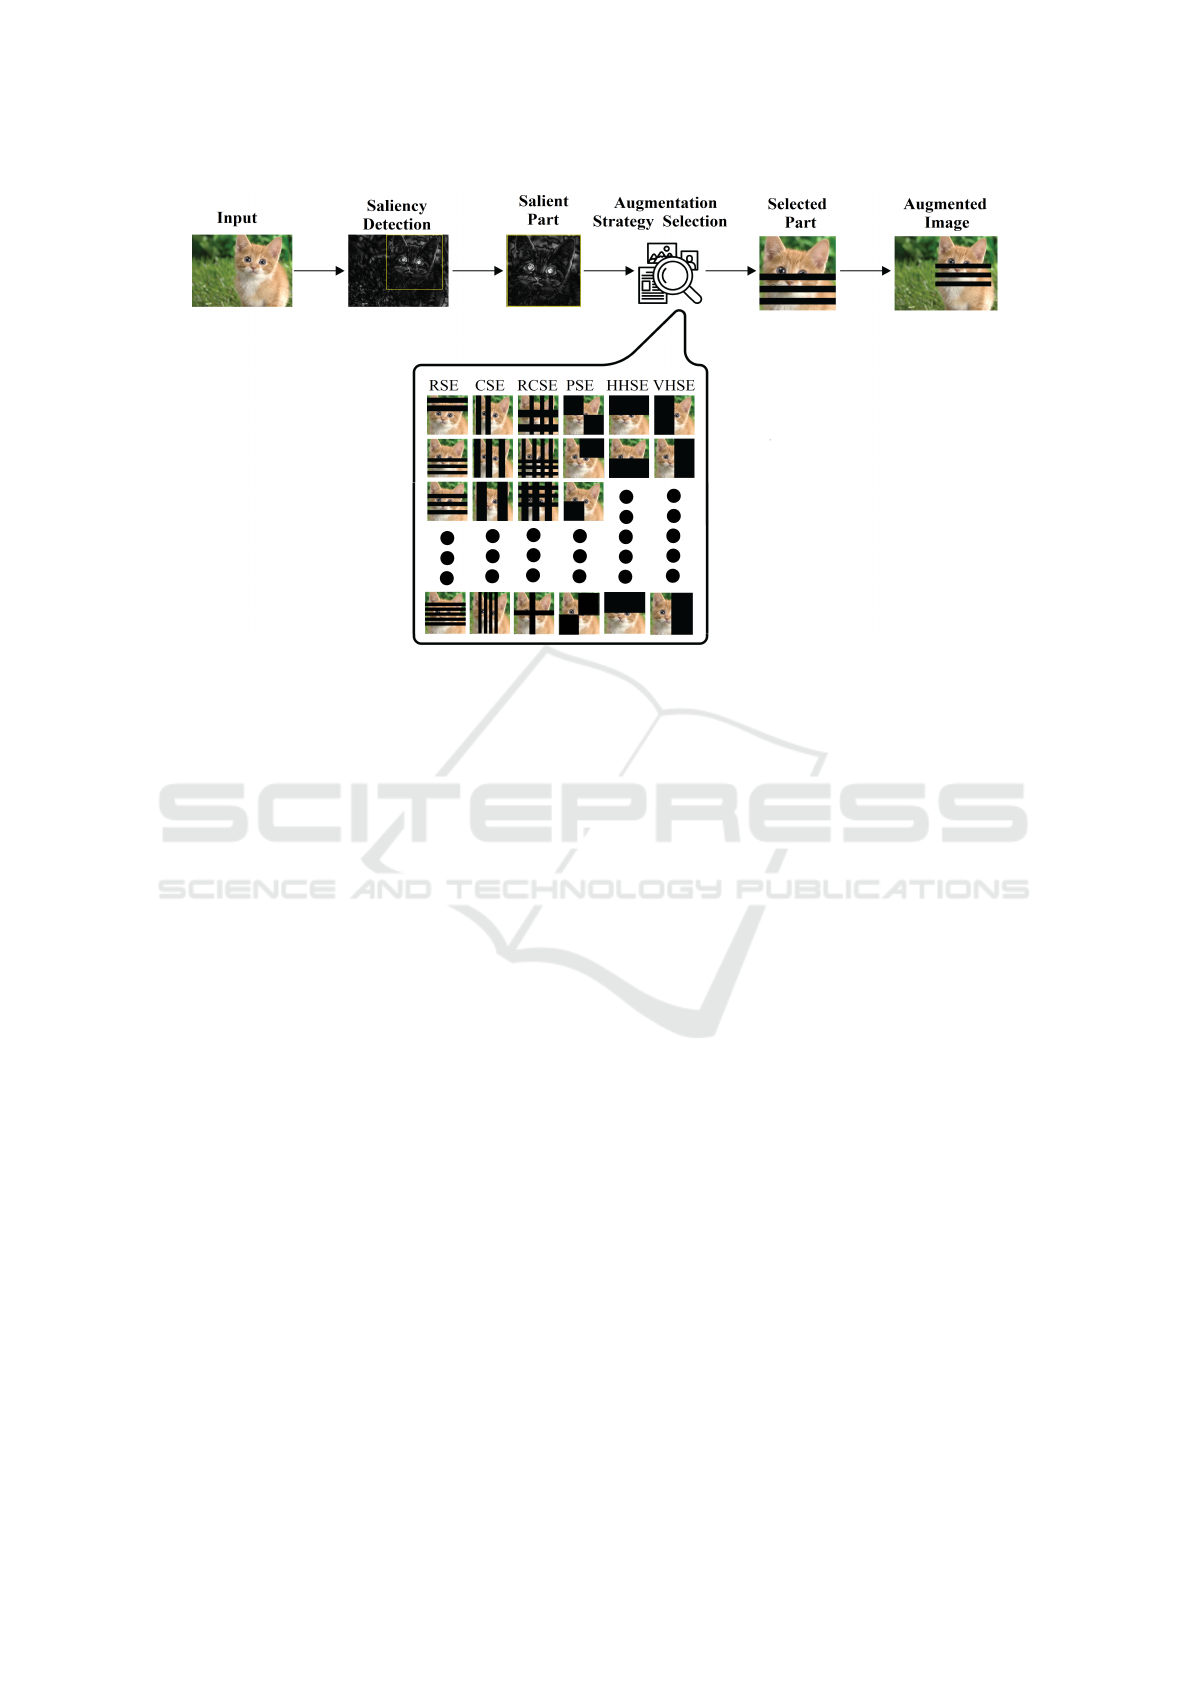
Figure 2: RandSaliencyAug: Proposed approach to balance between complete object erasing and contextual information
erasing, where RSE, CSE, RCSE, PSE, HHSE and VHSE represent row slice erasing, column slice erasing, row-column
saliency erasing, partial saliency erasing, horizontal half saliency erasing and vertical half saliency erasing, respectively.
It is important to note that all these augmentation ap-
proaches receive the salient region of the image and
then are applied. The salient region is detected us-
ing the method in (Montabone and Soto, 2010; Uddin
et al., 2020).
3.1.1 Row Slice Erasing (RSE)
In this strategy, the salient region x ∈ R
W ×H×C
of the
image I is given. The augmented salient part can be
defined as:
˜x = M ⊙ x (1)
where binary mask M, is a matrix of size W × H,
where each element of the matrix takes on a value
of either 0 or 1. A value of 0 indicates that the cor-
responding pixel in the image should be excluded,
while a value of 1 indicates that the pixel should be
included. The symbol ⊙ shows element-wise multi-
plication
In order to sample the binary mask M, we ran-
domly select slices of size S from a predetermined
range. The total number of slices required is deter-
mined by dividing the height H of the binary mask by
the slice size S given by the below equation 2:
TotalSlices = ⌊H/S⌋ (2)
Alternative horizontal slices of M are filled with 0’s
and 1’s. Moreover, a demonstration of Row Slice
Erasing (RSE) is given in Fig. 3(a).
3.1.2 Column Slice Erasing (CSE)
In this strategy, we perform all the defined steps in the
RSE 3.1.1 except, the total number of slices is calcu-
lated by dividing the width W of the binary mask by
the slice size S as shown in the equation 3.
TotalSlices = ⌊W /S⌋ (3)
Alternative vertical slices of M are filled with 0’s and
1’s. Column slice erasing is illustrated in Fig. 3(b).
3.1.3 Row Column Slice Erasing (RCSE)
Row Column Slice Erasing is a combination of
RSE 3.1.1 and CSE 3.1.2. RSE and CSE are per-
formed in sequential order. RCSE is shown in
Fig. 3(c).
3.1.4 Partially Saliency Erasing (PSE)
In this strategy, the salient region is divided into four
parts, then a randomly random number of square(s)
are erased, as shown in Fig. 3(d). Mathematically,
mask M is divided into four parts of equal size and
each part is filled with either 0’s or 1’s. One part or
diagonally two parts are filled with any of 0’s or 1’s
randomly. Then element-wise multiplication is per-
formed on the salient part to generate augmented im-
age ˜x as shown in equation 1.
RandSaliencyAug: Balancing Saliency-Based Data Augmentation for Enhanced Generalization
285
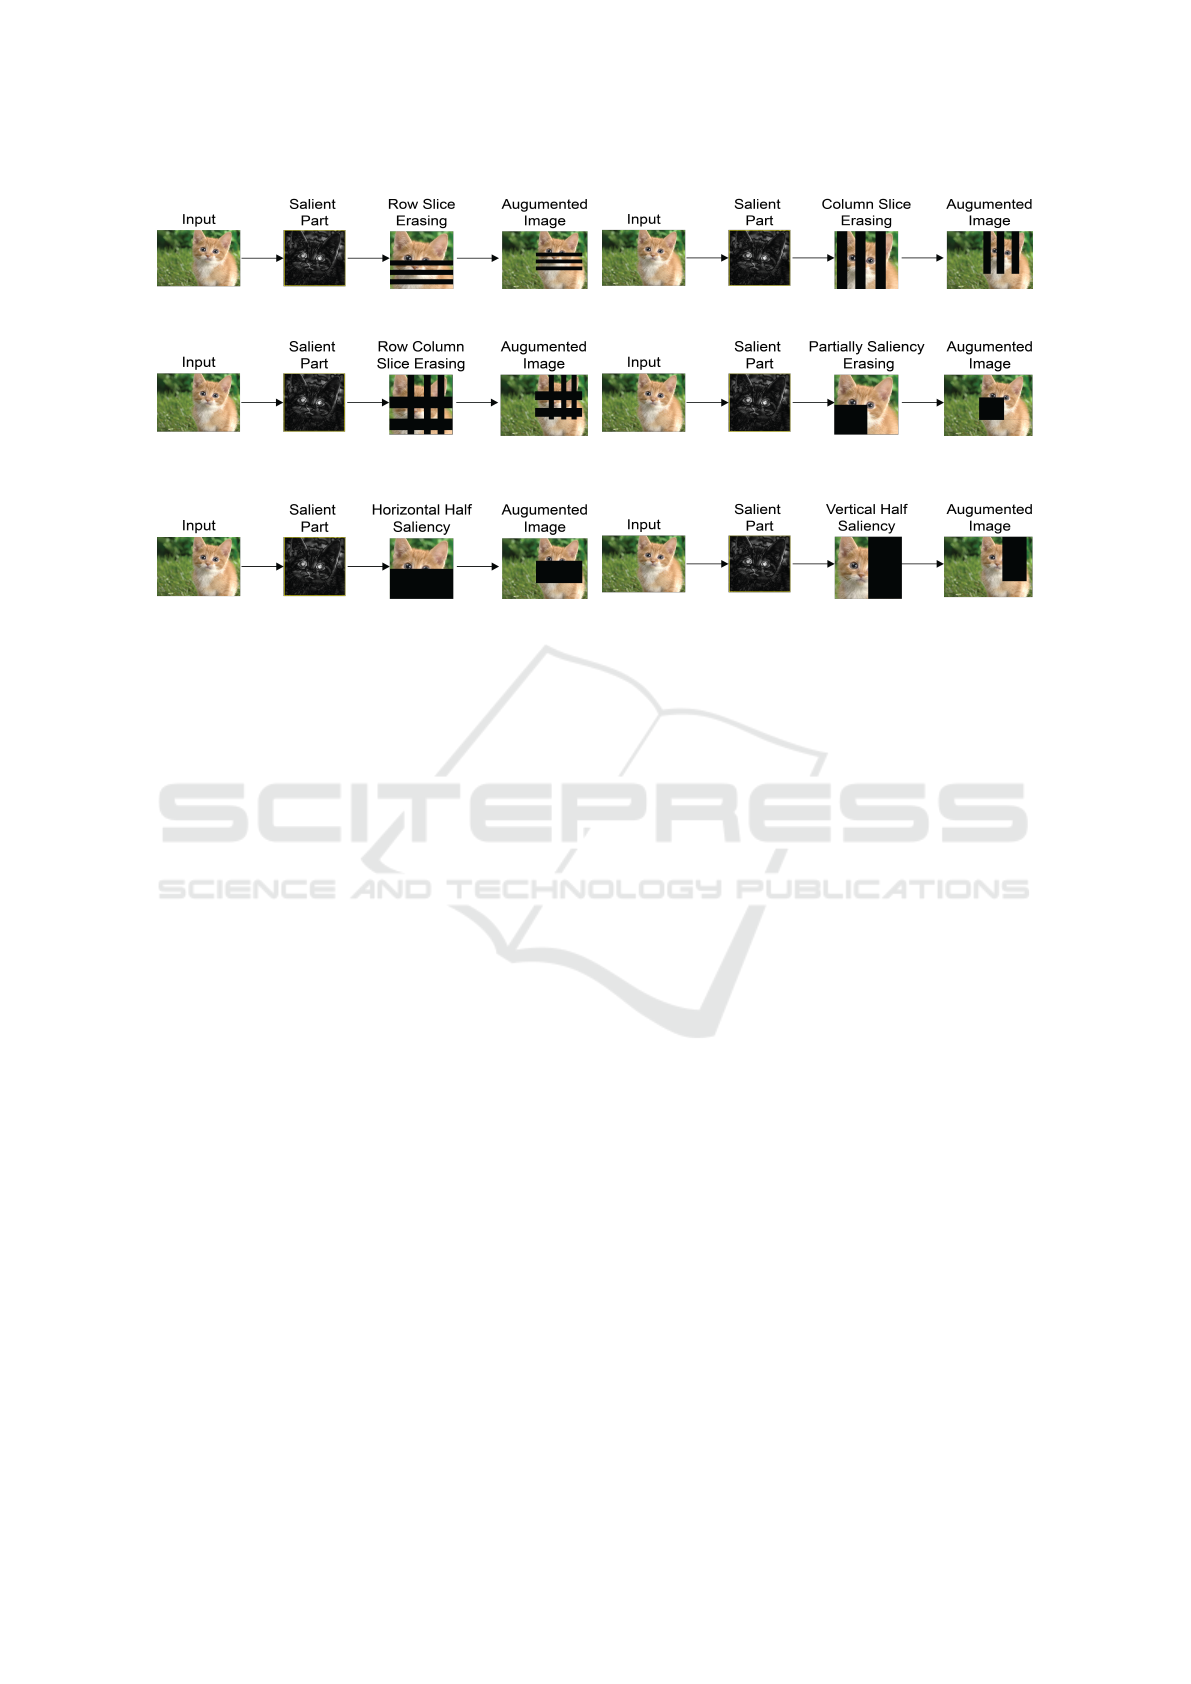
(a) Sample of Row Slice Erasing (RSE) visualisation (b) Sample of Column Slice Erasing (CSE) visualisation
(c) Sample of Row Column Slice Erasing (RCSE) visualisa-
tion
(d) Sample of Partially Slice Erasing (PSE) visualisation
(e) Sample of Horizontal Half Slice Erasing (HHSE) visuali-
sation
(f) Sample of Vertical Half Slice Erasing (VHSE) visualisa-
tion
Figure 3: Samples of the proposed augmentation strategies used in the search space
3.1.5 Horizontal Half Saliency Erasing (HHSE)
In this strategy, the salient region is horizontally di-
vided into two parts. One of them is randomly erased
as demonstrated in the Fig. 3(e). The mask M is par-
titioned horizontally into two equal-sized segments,
with one segment filled with 0’s and the other with
1’s. This partitioning allows for the creation of the
augmented image ˜x by performing an element-wise
multiplication on the salient part of ˜x, as shown in
equation 1.
3.1.6 Vertical Half Saliency Erasing (VHSE)
Similarly to HHSE, the salient region is vertically di-
vided into two parts. One of them is randomly erased
as shown in the Fig. 3(f). The mask M is divided
vertically into two equal parts of the same size. One
part is filled with 0’s and the other with 1’s, according
to mathematical principles. To create the augmented
image ˜x, the salient part of ˜x is obtained through an
element-wise multiplication process, as described in
equation 1.
3.2 RandSaliencyAug
RandSaliencyAug data augmentation selects one data
augmentation from the search space comprised of the
six data augmentation strategies proposed above in
section 3.1 then two versions of RandSaliencyAug
are defined below:
3.2.1 Weighted RandSaliencyAug (W-RSA)
The RandSaliencyAug method assigns weights to
each data augmentation technique based on their per-
formance in term of accuracy after training. Specifi-
cally, the weight of a particular augmentation is cal-
culated as follows. The baseline accuracy (A
b
) and
the accuracy with the augmentation (A
a
i
) are calcu-
lated. Then difference d
i
is calculated by subtracting
A
b
from A
a
i
.
d
i
= |A
a
i
− A
b
| (4)
Then the sum of all differences is calculated:
D =
n
∑
i=1
d
i
(5)
where n is the number of data augmentation strate-
gies, in our case, it is 6. Then the weight of the aug-
mentation is calculated:
w
i
= d
i
/D (6)
These weights are used as probabilities to ran-
domly select an augmentation from the given list of
augmentations during the searching process.
3.2.2 Non-Weighted RandSaliencyAug (N-RSA)
In non-weighted RandSaliencyAug, weights are uni-
formly calculated irrespective of accuracy perfor-
mance. Weights are calculated as follow:
w
i
= 1/n (7)
where n is the number of data augmentation strate-
gies, which is 6 in our work.
VISAPP 2025 - 20th International Conference on Computer Vision Theory and Applications
286

After calculating the weights, these weights are
used as probabilities with an equal chance of selec-
tion of the data augmentation from the given data aug-
mentation list. The searching process of this flavour
is similar to RandAug (Cubuk et al., 2020).
4 EXPERIMENTS
In this section, we discuss the experimental training
setup and results.
4.1 Training Set up
4.1.1 Image Classification
For image classification, we follow the RE (Zhong
et al., 2020) setup for fair comparison using Fashion-
MNIST (Xiao et al., 2017), CIFAR-10, and CIFAR-
100 (Krizhevsky et al., ), with training for 300
epochs, a batch size of 128, and an initial learn-
ing rate of 0.1, decaying at 90, 180, and 240
epochs. For CIFAR-10 and CIFAR-100, we use
a learning rate of 1e-3, Xavier Normal initializa-
tion, and weight decay of 1e-5 (Walawalkar et al.,
2020) (Table 3). On ImageNet (Deng et al., 2009),
we follow the GridMask (Chen et al., 2020) setup,
using ResNet (He et al., 2016), Wide-ResNet-28-
10 (Zagoruyko and Komodakis, 2016), and Shake-
Shake-26-32 (Gastaldi, 2017) architectures with var-
ious augmentations. Accuracy and error rate were
used as performance metrics.
4.2 Hyperparameters Study
We first determine the optimal probability for each
of the six augmentation strategies. The probabil-
ity (Zhong et al., 2020) refers to the likelihood of ap-
plying a specific data augmentation. These probabili-
ties are optimized using ResNet-18 on CIFAR-10. We
use the ResNet-18 architecture because it is relatively
small, allowing us to run a large number of experi-
ments quickly and applied across all subsequent ex-
periments, as detailed below.
4.2.1 Finding the Best Probability
When augmenting data, there’s a risk that the model
may lose access to the original data, shifting the dis-
tribution. To mitigate this, we balance augmented
and original samples by assigning probabilities to
each augmentation technique (Zhong et al., 2020;
Zhang et al., 2017; Kumar et al., 2023b; Yun et al.,
2019). For the proposed six augmentation strategies,
we check their probabilities from 0.1 to 1.0 in 0.1 in-
crements, then select the best for the search space. For
RSE and CSE, slice sizes depend on image dimen-
sions, with RSE ranging from 1 to H/2 and CSE from
1 to W/2, adjusted randomly each epoch. RCSE fol-
lows similar ranges, while the other strategies (PSE,
HHSE, VHSE) have different limits.
4.2.2 Calculating the Performance-Based
Weights
We propose two variations: Weighted RandSalien-
cyAug (W-RSA) and Non-Weighted RandSalien-
cyAug (N-RSA). In W-RSA, weights are assigned
based on performance by calculating the difference
between each strategy’s performance and the base-
line (Table 1). Using ResNet18 on CIFAR10, we sum
these differences (Total: 5.0), then divide each strat-
egy’s difference by this sum to obtain final weights
(last column of Table 1). These weights are used
for all experiments except Fashion-MNIST and CI-
FAR100. In N-RSA, weights are uniform (1/6 for six
strategies), following (Cubuk et al., 2020).
4.3 Image Classification Results
We evaluate the effectiveness of our proposed
approach on several datasets, including Fashion-
MNIST, CIFAR10, CIFAR100, and ImageNet. On
Fashion-MNIST, using various CNN architectures,
our method, particularly W-RSA, outperforms all ex-
isting approaches. Across all CNNs, W-RSA shows
an improvement of 2% over the baseline and outper-
forms other methods, as shown in Table 2.
Table 1: Difference of each strategy with baseline, where
A% and ∆ represent accuracy and accuracy difference, re-
spectively.
Strategy Baseline Strategy A% ∆ Weight
PSE 95.28 96.48 1.20 0.24
HHSE 95.28 96.31 1.03 0.21
RSE 95.28 96.02 0.74 0.15
CSE 95.28 95.70 0.42 0.08
RCSE 95.28 95.90 0.62 0.12
VHSE 95.28 96.27 0.99 0.20
In Table 3, we also compare the performance of
our method with other saliency- and mixing-based
augmentations, where our approach shows superior or
competitive results.
For ImageNet classification, we use the same
probabilities (weights) for W-RSA as in CIFAR10
to reduce training time and computational overhead.
RSA and W-RSA were tested across various CNN ar-
chitectures, and both demonstrated competitive per-
formance compared to existing data augmentation
RandSaliencyAug: Balancing Saliency-Based Data Augmentation for Enhanced Generalization
287

Table 2: Accuracy performance comparison of the proposed approaches with the existing and relevant approaches on fash-
ionMNIST. Highlighted blue is the best performance, where RN is ResNet
Methods RN20 RN32 RN44 RN56
Baseline 93.79± 0.11 93.96± 0.13 93.92± 0.16 93.22± 0.16
RE 94.96± 0.10 95.15± 0.12 95.13± 0.10 94.98± 0.11
RSMDA(R) (Kumar et al., 2023b) 95.09± 0.12 95.19± 0.17 95.93± 0.14 95.00± 0.19
RSMDA(C) (Kumar et al., 2023b) 95.28± 0.13 95.35± 0.15 95.22± 0.01 95.00± 0.20
RSMDA(RC) (Kumar et al., 2023b) 95.24± 0.06 95.19± 0.12 95.10± 0.25 94.91± 0.59
RSE(ours) 94.02 ± 1.35 94.34 ± 0.90 94.69 ± 0.81 94.72 ± 1.05
CSE(ours) 94.02 ± 1.35 94.66 ± 0.47 95.03 ± 0.32 94.45 ± 0.62
RCSE(ours) 94.63 ± 0.55 94.68 ± 0.60 94.57 ± 0.92 94.62 ± 0.65
HHSE(ours) 94.65 ± 0.79 95.34 ± 0.13 95.49 ± 0.16 95.24 ± 0.74
VHSE(ours) 94.52 ± 0.72 94.49 ± 0.78 94.31 ± 1.03 94.43 ± 0.97
PSE(ours) 94.71 ± 0.66 94.62 ± 0.69 94.68 ± 0.73 94.57 ± 0.73
N-RSA (ours) 95.34 ± 0.59 95.36 ± 0.16 95.34 ± 0.06 95.01 ± 0.12
W-RSA(ours) 95.35 ± 0.12 95.37 ± 0.06 95.27 ± 0.20 95.18 ± 0.06
Table 3: Accuracy performance comparison with saliency and image mixing based augmentation methods, where CutMix
(Att:) refers to Attentive CutMix and gain is gain over baseline.
CIFAR10 (%)
Method RN18 RN34 RN50 DN121 DN169 ENB0
Baseline 84.67 87.12 95.02 85.65 87.67 87.45
Mixup 88.52 88.70 - 87.56 89.12 88.07
CutMix 87.92 88.75 90.84 87.98 89.23 88.67
CutMix (Att:) 88.94 90.40 - 88.34 90.45 88.94
SaliencyMix 96.53 - 93.19 - - -
PuzzleMix 97.10 - - - - -
CoMixup 97.15 - - - - -
AutoMix 97.34 - - - - -
Ours(N-RSA) 91.12 90.03 96.31 91.39 92.09 88.88
Ours (W-RSA) 91.61 90.43 96.33 91.74 91.81 88.98
Gain +6.94 +3.31 +1.31 +6.09 +4.14 +1.53
CIFAR100 (%)
Baseline 63.14 65.54 63.52 65.12 66.42 75.67
Mixup 64.40 67.83 - 66.84 68.24 77.21
CutMix 65.90 68.32 68.35 67.62 69.58 77.57
CutMix (Att:) 67.16 70.03 - 69.23 71.34 78.52
SaliencyMix 79.12 - 75.11 - - -
PuzzleMix 81.13 - - - - -
CoMixup 81.17 - - - - -
AutoMix 82.04 - - - - -
Ours(N-RSA) 68.02 70.08 69.91 67.84 69.21 77.45
Ours (W-RSA) 68.01 70.51 69.99 67.94 70.60 78.01
Gain +4.87 +4.97 +6.47 +2.82 +4.18 +2.34
methods. W-RSA outperformed other approaches
when using ResNet50 and ResNet152, as shown in
Table 4. In summary, W-RSA has shown superior
performance across diverse classification tasks on var-
ious datasets and CNN architectures.
4.4 Why Erasing on Salient Region
Only?
Previous erasing data augmentation methods aim to
help models recognize objects under partial occlusion
during testing (Zhong et al., 2020; Chen et al., 2020;
Kumar Singh and Jae Lee, 2017). However, these
VISAPP 2025 - 20th International Conference on Computer Vision Theory and Applications
288

Table 4: Results on ImageNet using different network architecture and comparison with existing approaches, where Acc(%)
is accuracy(%). Highlighted blue is the best performance.
Model Acc(%) Model Acc(%) Model Acc(%)
ResNet50 76.5 ResNet101 78.0 ResNet152 78.3
+Dropout 76.8 +Dropout 77.7 - -
+DropPath 77.1 - - - -
+DropBlock 78.3 +DropBlock 79.0 - -
+Cutout 77.1 - - - -
+HaS 77.2 - - - -
+Mixup 77.9 +Mixup 79.2 - -
+AutoAugment 77.6 - - - -
+RandAugment 77.6 +RandAugment 79.2 - -
+RandomErasing 77.3 +RandomErasing 79.6 - -
+GridMask 77.9 +GridMask 79.1 +GridMask 79.7
+AutoAugment 77.6 +AutoAugment 79.3 - -
+KeepAutoAugment 78.0 +KeepAutoAugment 79.7 - -
+SaliencyMix 78.46 +SaliencyMix 80.45 - -
+FMix 78.51 +FMix 80.20 - -
+PuzzleMix 78.86 +PuzzleMix 80.67 - -
+AutoMix 79.25 +AutoMix (Zhu et al., 2020) 80.98 - -
+N-RSA (Ours) 77.9 +N-RSA (ours) 79.2 +N-RSA (ours) 79.5
+W-RSA (Ours) 78.1 +W-RSA (Ours) 79.4 + W-RSA (Ours) 79.8
methods may not occlude salient regions, causing the
model to learn from non-salient occlusion. Our ap-
proach addresses this by focusing on occluding salient
areas, forcing the model to learn from these occlu-
sions. The goal is to improve recognition of partially
visible objects and provide diverse occlusion scenar-
ios, achieved by identifying and augmenting impor-
tant regions, as shown in Fig. 3. The search space is
expanded, as illustrated in Fig. 2.
4.5 Why We Need These Six Erasing
Strategies?
The six proposed augmentation strategies in RSA are
designed to selectively occlude essential image re-
gions while preserving key contextual information.
This targeted occlusion helps the model focus on im-
portant features and also to learn contextual informa-
tion, improving generalization and reducing overfit-
ting. The experimental results demonstrate that RSA
enhances model accuracy by maintaining critical ob-
ject structures across tasks.
5 CONCLUSION
This work introduces the RandSaliencyAug frame-
work, which utilizes six distinct strategies—Row
Slice Erasing, Column Slice Erasing, Row-Column
Saliency Erasing, Partial Saliency Erasing, Horizon-
tal Half Saliency Erasing, and Vertical Half Saliency
Erasing. These strategies effectively balance the re-
moval of irrelevant information while preserving im-
portant contextual details. We evaluate both weighted
and non-weighted variants of RandSaliencyAug to
ensure comprehensive validation. Our results demon-
strate the approach’s computational efficiency, trans-
parency in model focus, and resilience across various
tasks and datasets. Empirical evaluations show that
RandSaliencyAug achieves exceptional performance
in image classification on Fashion-MNIST, CIFAR10,
CIFAR100, and ImageNet, confirming its versatility
across multiple CNN architectures. Future work will
explore its application to occluded datasets and fur-
ther refine the determination of optimal parameters,
such as weights and probabilities.
ACKNOWLEDGEMENTS
This research was supported by Science Foundation
Ireland under grant numbers 18/CRT/6223 (SFI Cen-
tre for Research Training in Artificial intelligence),
SFI/12/RC/2289/P 2 (Insight SFI Research Centre
for Data Analytics), 13/RC/2094/P 2 (Lero SFI Cen-
tre for Software) and 13/RC/2106/P 2 (ADAPT SFI
Research Centre for AI-Driven Digital Content Tech-
nology). For the purpose of Open Access, the au-
thor has applied a CC BY public copyright licence
to any Author Accepted Manuscript version arising
from this submission.
RandSaliencyAug: Balancing Saliency-Based Data Augmentation for Enhanced Generalization
289

REFERENCES
Achanta, R., Hemami, S., Estrada, F., and Susstrunk, S.
(2009). Frequency-tuned salient region detection. In
2009 IEEE Conference On Computer Vision And Pat-
tern Recognition, pages 1597–1604.
Ba, J. and Frey, B. (2013). Adaptive dropout for training
deep neural networks. In Advances In Neural Infor-
mation Processing Systems, volume 26.
Chen, P., Liu, S., Zhao, H., and Jia, J. (2020). Gridmask data
augmentation. ArXiv Preprint ArXiv:2001.04086.
Cubuk, E., Zoph, B., Shlens, J., and Le, Q. (2020). Ran-
daugment: Practical automated data augmentation
with a reduced search space. In Proceedings Of The
IEEE/CVF Conference On Computer Vision And Pat-
tern Recognition Workshops, pages 702–703.
Deng, J., Dong, W., Socher, R., Li, L., Li, K., and Fei-Fei,
L. (2009). Imagenet: A large-scale hierarchical im-
age database. In 2009 IEEE Conference On Computer
Vision And Pattern Recognition, pages 248–255.
Deng, Z., Hu, X., Zhu, L., Xu, X., Qin, J., Han, G., and
Heng, P. (2018). R3net: Recurrent residual refinement
network for saliency detection. In Proceedings Of The
27th International Joint Conference On Artificial In-
telligence, pages 684–690.
DeVries, T. and Taylor, G. (2017). Improved regularization
of convolutional neural networks with cutout. ArXiv
Preprint ArXiv:1708.04552.
Gastaldi, X. (2017). Shake-shake regularization. ArXiv
Preprint ArXiv:1705.07485.
Hataya, R., Zdenek, J., Yoshizoe, K., and Nakayama, H.
(2020). Faster autoaugment: Learning augmentation
strategies using backpropagation. In Computer Vi-
sion–ECCV 2020: 16th European Conference, Glas-
gow, UK, August 23–28, 2020, Proceedings, Part
XXV, pages 1–16.
He, K., Zhang, X., Ren, S., and Sun, J. (2016). Deep resid-
ual learning for image recognition. In Proceedings Of
The IEEE Conference On Computer Vision And Pat-
tern Recognition, pages 770–778.
Hou, X. and Zhang, L. (2007). Saliency detection: A spec-
tral residual approach. In 2007 IEEE Conference On
Computer Vision And Pattern Recognition, pages 1–8.
Krizhevsky, A., Hinton, G., and Others. Learning multiple
layers of features from tiny images. (Toronto, ON,
Canada,2009).
Krizhevsky, A., Sutskever, I., and Hinton, G. (2017). Im-
agenet classification with deep convolutional neural
networks. Communications Of The ACM, 60:84–90.
Kumar, T., Mileo, A., Brennan, R., and Bendechache, M.
(2023a). Image data augmentation approaches: A
comprehensive survey and future directions. arXiv
preprint arXiv:2301.02830.
Kumar, T., Mileo, A., Brennan, R., and Bendechache, M.
(2023b). Rsmda: Random slices mixing data augmen-
tation. Applied Sciences, 13:1711.
Kumar Singh, K. and Jae Lee, Y. (2017). Hide-and-
seek: Forcing a network to be meticulous for weakly-
supervised object and action localization. In Proceed-
ings Of The IEEE International Conference On Com-
puter Vision, pages 3524–3533.
Montabone, S. and Soto, A. (2010). Human detection using
a mobile platform and novel features derived from a
visual saliency mechanism. Image And Vision Com-
puting, 28:391–402.
Qin, X., Zhang, Z., Huang, C., Gao, C., Dehghan, M.,
and Jagersand, M. (2019). Basnet: Boundary-aware
salient object detection. In Proceedings Of The
IEEE/CVF Conference On Computer Vision And Pat-
tern Recognition, pages 7479–7489.
Uddin, A., Monira, M., Shin, W., Chung, T., Bae, S., and
Others (2020). Saliencymix: A saliency guided data
augmentation strategy for better regularization. ArXiv
Preprint ArXiv:2006.01791.
Walawalkar, D., Shen, Z., Liu, Z., and Savvides, M. (2020).
Attentive cutmix: An enhanced data augmentation ap-
proach for deep learning based image classification. In
ICASSP, IEEE International Conference on Acoustics,
Speech and Signal Processing-Proceedings.
Wan, L., Zeiler, M., Zhang, S., Le Cun, Y., and Fergus, R.
(2013). Regularization of neural networks using drop-
connect. In International Conference On Machine
Learning, pages 1058–1066.
Xiao, H., Rasul, K., and Vollgraf, R. (2017). Fashion-
mnist: a novel image dataset for benchmark-
ing machine learning algorithms. ArXiv Preprint
ArXiv:1708.07747.
Yun, S., Han, D., Oh, S., Chun, S., Choe, J., and Yoo,
Y. (2019). Cutmix: Regularization strategy to train
strong classifiers with localizable features. In Pro-
ceedings Of The IEEE/CVF International Conference
On Computer Vision, pages 6023–6032.
Zagoruyko, S. and Komodakis, N. (2016). Wide residual
networks. In British Machine Vision Conference 2016.
Zhang, H., Cisse, M., Dauphin, Y., and Lopez-Paz, D.
(2017). Mixup: Beyond empirical risk minimization.
ICLR 2018. ArXiv Preprint ArXiv:1710.09412.
Zhong, Z., Zheng, L., Kang, G., Li, S., and Yang, Y.
(2020). Random erasing data augmentation. Pro-
ceedings Of The AAAI Conference On Artificial Intel-
ligence, 34:13001–13008.
Zhu, J., Shi, L., Yan, J., and Zha, H. (2020). Automix:
Mixup networks for sample interpolation via cooper-
ative barycenter learning. In Computer Vision–ECCV
2020: 16th European Conference, Glasgow, UK, Au-
gust 23–28, 2020, Proceedings, Part X, pages 633–
649.
VISAPP 2025 - 20th International Conference on Computer Vision Theory and Applications
290
