
Retinoblastoma Detection: Leveraging Deep Learning and Residual
Connections for Enhanced Diagnostic Accuracy
Shuaa S. Alharbi
a
Department of Information Technology, College of Computer, Qassim University, Buraydah 52571, Saudi Arabia
Keywords:
Artificial Intelligence, Convolutional Neural Network, Deep Learning, Deep Neural Networks, Image
Classification, Machine Learning, Retinoblastoma.
Abstract:
Retinoblastoma is a rare cancer of the eye that affects children and can be deadly if not diagnosed in time.
Detecting this disease early improves the likelihood of curative treatment and makes it possible to preserve the
child’s vision. Meanwhile, the application of deep learning techniques to pathology holds the promise of revo-
lutionizing cancer detection and treatment early. When it comes to retinoblastoma, the prospect of automating
diagnostic processes to work more accurately and efficiently than healthcare workers can detect dangerous
cases with better-than-average accuracy should improve survival rates, as well as rates of vision conserva-
tion. In this study, we evaluated several convolutional neural network models: MobileNetV2, EfficientNetB0,
ResNet101, DenseNet121, VGG16, and an ensemble model providing a quantitive comparison of which of the
models performs best. Among the models, the one that performed best and most accurately was ResNet101,
which achieved an accuracy of 97.42%(top-1 accuracy). Comparatively, EfficientNetB0 had a lower metric
that indicated its accuracy was 53.40% (top-1 accuracy). ResNet101’s relatively high accuracy for this study
suggests that this model is better suited for this type of feature-based classification problem compared to the
other models. Residual connection blocks allow layers in a deep neural network to learn to map the input to the
same output. This improves performance and reduces errors. Residual networks (ResNets) with many layers
have now become the standard architecture used in the leading vision challenges, which gives more insight to
researchers and practitioners in choosing the most suitable diagnostic model.
1 INTRODUCTION
Retinoblastoma is an eye cancer that almost exclu-
sively affects very young children and is usually diag-
nosed prior to the age of five. While it is a rare form
of cancer, it is aggressive in nature; left untreated,
it can spread to other parts of the eye and the body.
While early detection is vitally important, it is not
easily accomplished, especially considering that the
disease almost exclusively affects very young chil-
dren who cannot easily communicate. Current imag-
ing techniques used in the detection of retinoblas-
toma, such as ultrasounds or MRIs, have limited ef-
fectiveness. However, molecular ”liquid” tests that
look for genes associated with retinoblastoma might
hold more promise. Though the current methods of
achieving these elusive tests are not very practical,
more affordable, and more accessible methods are un-
der development.
In recent years, the integration of computer vi-
a
https://orcid.org/0000-0003-2121-0296
sion and deep learning technologies has ushered in
a promising era of retinoblastoma detection. These
technologies have the potential to reduce mortality
from retinoblastoma, which could lead to improved
health outcomes for people in low- and middle-
income countries. Additionally, this technology could
help reduce the need for costly and time-consuming
manual analysis.
In recent years, the integration of computer vi-
sion and deep learning technologies has opened up
a new era for retinoblastoma detection. These tech-
nologies hold immense promise for reducing mortal-
ity from retinoblastoma—a rare but deadly eye cancer
that predominantly strikes infants and children—by
providing timely, accurate, and cost-effective diag-
noses. Moreover, they could significantly lessen our
reliance on manual analysis, which is not only labor-
intensive but also prone to error.
In this era of artificial intelligence, several deep
learning models have been developed to detect
retinoblastoma visually. The architectures of these
Alharbi, S. S.
Retinoblastoma Detection: Leveraging Deep Learning and Residual Connections for Enhanced Diagnostic Accuracy.
DOI: 10.5220/0013099000003911
Paper published under CC license (CC BY-NC-ND 4.0)
In Proceedings of the 18th International Joint Conference on Biomedical Engineering Systems and Technologies (BIOSTEC 2025) - Volume 1, pages 269-279
ISBN: 978-989-758-731-3; ISSN: 2184-4305
Proceedings Copyright © 2025 by SCITEPRESS – Science and Technology Publications, Lda.
269

models have varied, but all of them have achieved
high rates of accuracy and precision. When com-
pared to conventional human ocularpathologic anal-
ysis, the models are also cheaper and more efficient.
The architectures of the deep learning models used
in the current study include (DSandler et al., 2018),
EfficientNetB0 (Tan and Le, 2019), ResNet101 (He
et al., 2016), DenseNet121 (Huang et al., 2017),
VGG16 (Simonyan and Zisserman, 2014) and the En-
semble model (Dietterich, 2000).
Models were trained and assessed on a public
dataset
1
to determine and compare their estima-
tions of accuracy for pixel-level segmentation tasks
on Retinoblastoma. The experiments and evaluations
conducted reveal the relative strengths and weak-
nesses of various learning architectures when applied
to the task of classifying Retinoblastoma. The out-
comes of this extensive study allow us to under-
stand the most suitable Convolutional Neural Net-
work (CNN) backbone that can be used to propose
a innovative architecture that provide an optimal per-
formance in terms of accuracy and efficiency for use
in automated intelligent systems tasked with diagnos-
ing Retinoblastoma.
2 RELATED WORK
The literature features a number of deep learning
models for detecting and classifying retinoblastoma.
Earlier work by (Durai et al., 2021) presents an ap-
proach to not just diagnosing retinoblastoma but di-
agnosing it earlier than previous models—this is an
important focus since retinoblastoma is a rapidly pro-
gressing cancer that can develop within months and
most often does so in very young children. Durai’s
work emphasizes using deep learning for image anal-
ysis; they discuss using a CNN model along with
preliminary work in using a more traditional image
processing approach. The overall work is more of
a step in the right direction toward employing auto-
mated systems for diagnosing retinoblastoma but un-
fortunately does not feature results based on clinical
tests.
A method for improving the accuracy of
retinoblastoma diagnoses has been developed by (Du-
raivenkatesh et al., 2023). This method, intended
for use by healthcare professionals, integrates several
sophisticated artificial intelligence (AI) technologies,
including image processing, and is based on the use
of fundus photography for identifying retinoblastoma.
The researchers claim that their work could lead to
1
The dataset is available at: https://github.com/
norton-chris/Retinoblastoma detector SVM/tree/master
significantly improved identification of the disease in
its early stages. An international group of researchers,
led by (Kaliki et al., 2023), has also applied AI to the
problem of detecting retinoblastoma. In their study,
they focused on intraocular retinoblastoma and simi-
larly used fundus images for much of their analyses.
Kaliki and colleagues also assert that their work could
enhance the speed and accuracy of retinoblastoma di-
agnoses.
Zhang and colleagues (Zhang et al., 2023) de-
veloped a deep learning algorithm called the Deep
Learning Assistant for Retinoblastoma (DLA-RB).
This algorithm identifies active retinoblastoma tu-
mors with a high level of sensitivity and accuracy.
The cost of the DLA-RB is far lower than conven-
tional electronic tools. Thus, the DLA-RB is an ef-
fective tool for both diagnosis and surveillance, es-
pecially in places where resources are limited. The
approach taken by Zhang et al. to arrive at the DLA-
RB was straightforward. The researchers achieved
an extraordinary level of performance without em-
ploying overly complicated methods. Still, this work
only allows active retinoblastoma tumors to be de-
tected, which is necessary for initial encounters in
retinoblastoma diagnosis and for routine follow-up.
Using explainable AI techniques, Aaldughayfiq and
colleagues (Aldughayfiq et al., 2023) propose an in-
novative method to detect retinoblastoma. Instead
of the usual candidates for explainability, such as
LIME and SHAP, they use the InceptionV3 architec-
ture as the foundation for their model. They then fine-
tune the model on a dataset that contains images of
retinoblastoma and non-retinoblastoma cases. By do-
ing so, they not only classify the images as either of
the two types but also make the process interpretable.
They argue that this is essential if the people who read
the images are to trust the model and its results.
Advances in automated eye cancer detection us-
ing machine learning and image analysis are bring-
ing dramatic shifts to the healthcare field. Mistry and
Ramakrishnan (Mistry and Ramakrishnan, 2023) de-
scribe how these powerful technologies have the po-
tential to revolutionize eye cancer detection and, with
further development, could become life-saving tools.
Eye cancer, while rare, can progress rapidly. Auto-
mated detection utilizing the latest technologies may
prove to be a more efficient and effective method of
diagnosis. These technologies can accurately identify
ocular tumors at early stages, improving diagnosis
and treatment outcomes. The integration of machine
learning in medical imaging not only enhances pre-
cision but also reduces the burden on healthcare pro-
fessionals, Recently, (Pol et al., 2024) have concen-
trated on developing automatic segmentation meth-
BIOIMAGING 2025 - 12th International Conference on Bioimaging
270

ods for detecting retinoblastoma in optical coherence
tomography (OCT) images. Their proposed method-
ology accurately employs machine learning to delin-
eate the tumor in the complex 3D structure of the
eye and to perform the early diagnosis necessary to
carry out effective treatment planning. By automat-
ing the segmentation process, the technology signifi-
cantly reduces the time and effort required from med-
ical professionals, ensuring more consistent and pre-
cise results. (Shanthini et al., 2024) proposed a novel
approach of detecting eye cancer that uses CNNs.
Their work is notable for combining the image analy-
sis power of these CNNs with an advanced optimiza-
tion algorithm called the Sine Cosine Fitness Gray
Wolf Optimizer. The study demonstrates that this in-
tegrated approach can significantly enhance diagnos-
tic accuracy, offering a promising tool for early de-
tection and treatment of eye cancer, while also em-
phasizing the importance of further research to refine
and validate the system.
3 RETINOBLASTOMA
SYMPTOMS-BASED IMAGE
Retinoblastoma is a rare kind of eye cancer that pri-
marily targets infants and young children. When it
strikes, it normally presents with a number of symp-
toms that can be readily detected through imaging.
The most common sign is usually leukocoria, an
abnormal white reflection from the retina that can
be seen under direct examination or in photographs.
This is sometimes called a ”cat’s eye reflex” because
of how it looks—the way a cat’s eyes might look
at night, under certain conditions. Other signs and
symptoms may include strabismus (which affects the
alignment and positioning of the eyes, making it ap-
pear that one or both eyes are ”crossed”), swelling,
redness, and poor vision in the eye that has the tumor.
Advanced imaging techniques, such as ultrasound,
MRI, and fundus photography, play a crucial role
in diagnosing and assessing the extent of retinoblas-
toma, enabling timely and effective treatment (Shields
and Shields, 2004). Figure 1 illustrates the difference
between healthy and unhealthy eyes with Retinoblas-
toma.
4 METHODS
4.1 Dataset Used in Evaluation of
Methods
We compiled a comprehensive dataset of images con-
sisting of both normal eyes and eyes affected by
retinoblastoma. The dataset was carefully curated to
include a wide range of cases, ensuring a diverse rep-
resentation of the condition and its variations. This
diversity is crucial for training models that can gen-
eralize well to unseen data. The dataset was divided
into two subsets: a training set (80%) and a testing set
(20%). The training set is used to train the transfer-
learning models, enabling them to learn patterns and
features that differentiate normal eyes from those with
retinoblastoma. The testing set, on the other hand,
is kept separate during training and is used to evalu-
ate the performance of the trained models on unseen
data, thereby measuring their generalizability. A vi-
sual sample from this dataset is shown in Figure 2,
illustrating the variety of images included and how
they are prepared for analysis. This dataset forms the
foundation for our transfer-learning experiments, pro-
viding both the diversity and quality necessary for ro-
bust model development.
4.1.1 Data Preprocessing and Augmentation
The study initially started with a total of 100 images,
consisting of 50 images of normal eyes and 50 im-
ages of eyes affected by retinoblastoma. This pro-
vides a balanced dataset before augmentation, with
an equal proportion of true positive (retinoblastoma)
and true negative (normal) images. Before augmen-
tation, the dataset was evenly balanced: True pos-
itive images (retinoblastoma): 50% and True nega-
tive images (normal): 50%. After applying augmen-
tation techniques, the dataset was expanded to a to-
tal of 2,132 images. This significant increase was
achieved through transformations such as rotation, re-
sizing, and flipping, among other techniques. Since
the original dataset was balanced (50 normal and 50
retinoblastoma images), and assuming that augmenta-
tion techniques were applied equally to both classes.
To increase the size of our dataset, we utilized a
popular deep learning library called Keras, which was
developed by Franc¸ois Chollet and is now maintained
by Google, named mageDataGenerator (Chollet et al.,
2015). Keras is often integrated with TensorFlow,
Google’s premier deep learning framework, and both
are popular among industrial practitioners and aca-
demic researchers.These augmentations help prevent
overfitting by exposing the model to a wider range of
Retinoblastoma Detection: Leveraging Deep Learning and Residual Connections for Enhanced Diagnostic Accuracy
271
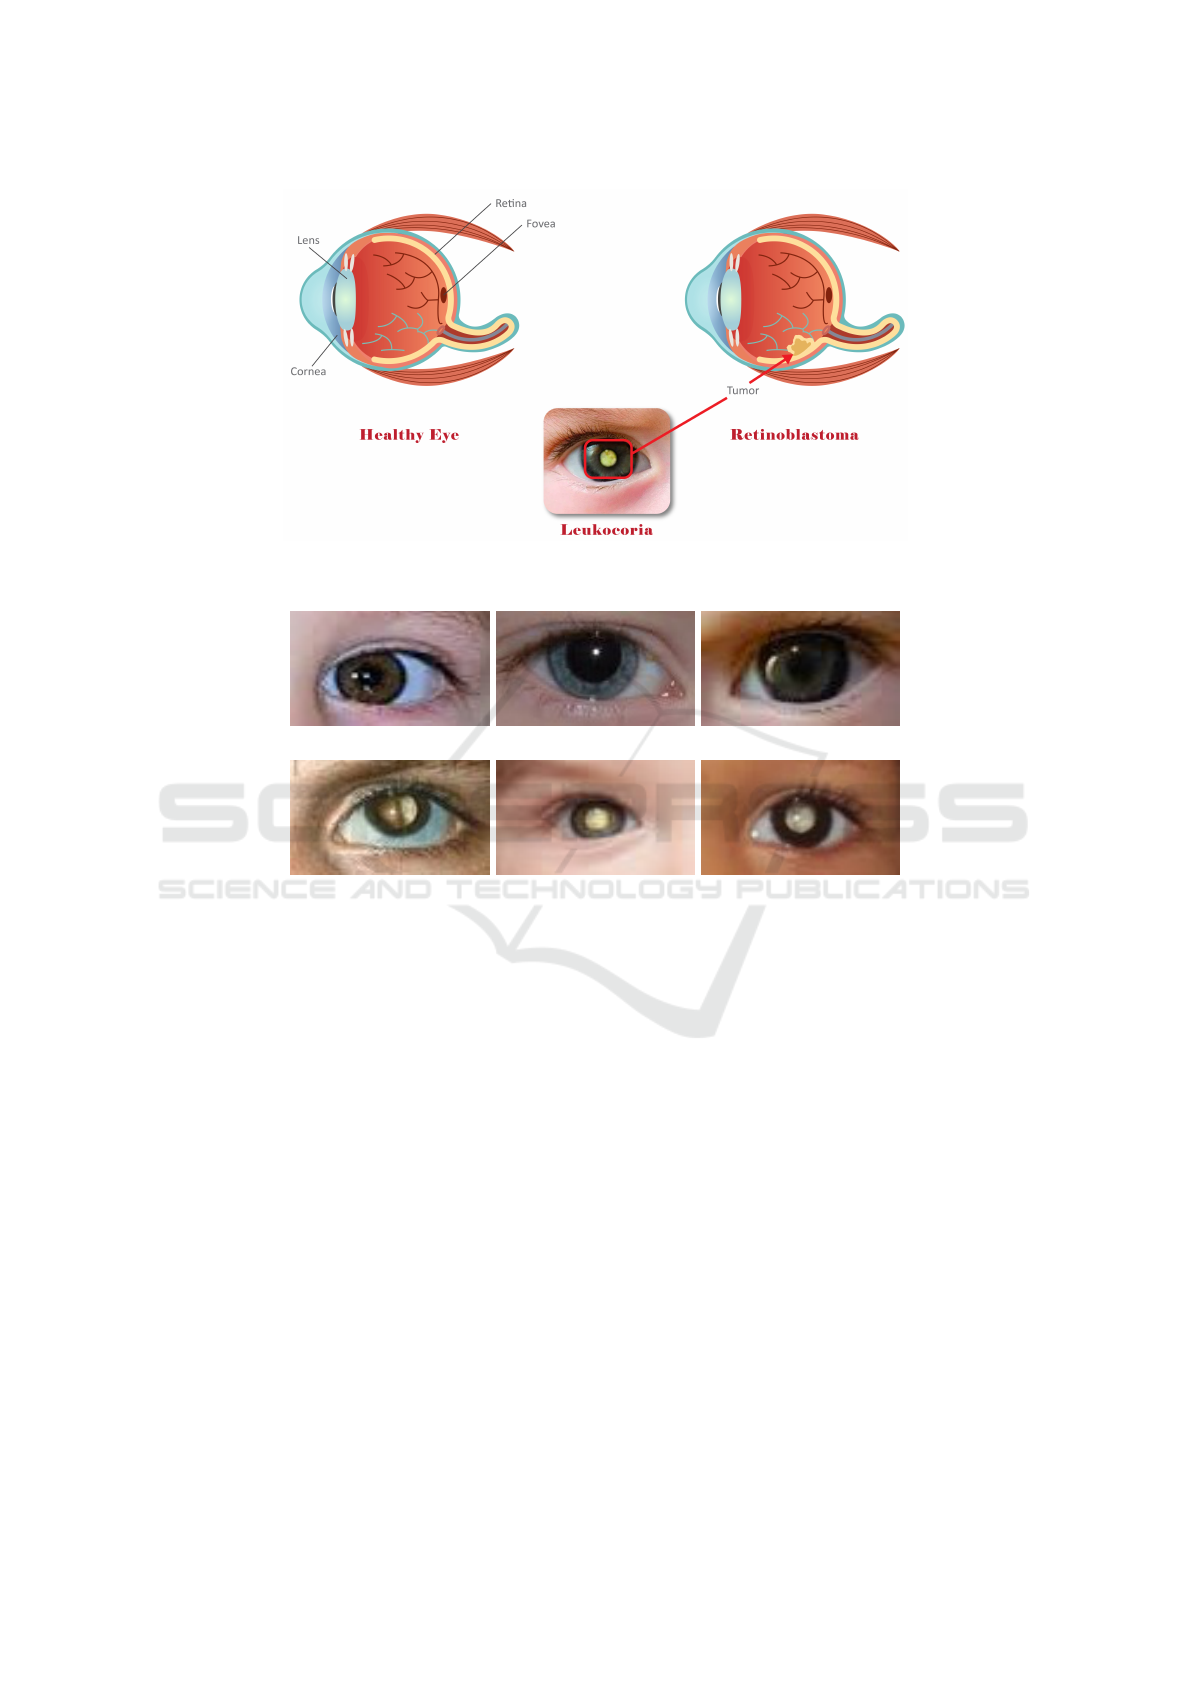
Figure 1: Difference between healthy and unhealthy eyes affected by retinoblastoma where red box indicate leukocoria
abnormal white reflection on unhealthy eye.
(a) (b) (c)
(d) (e) (f)
Figure 2: Different samples from dataset that have been used to evaluate the models where: (a)-(c) show healthy eyes, and
(d)-(f) show unhealthy retinoblastoma eyes with white reflection.
scenarios, thereby improving its generalization capa-
bilities. Additionally, ImageDataGenerator supports
scaling pixel values and normalizing data, which are
essential preprocessing steps for many models.
The balanced dataset (50% normal and 50%
retinoblastoma) ensures fair training and evaluation
without class bias. Expanding the dataset from 100 to
2,132 images through augmentation prevents overfit-
ting, improves robustness, and supports better gener-
alization. Maintaining class proportions during aug-
mentation avoids issues with class imbalance that
could skew performance metrics.
Moreover, we resize the image to 64 × 64 pix-
els. This is due to the specific input dimensions of
the deep learning models that we are going to use.
A steady feed of photos into the model is ensured
through resizing.
4.2 Deep Learning Models for
Classification
A total of six deep learning models are trained in this
paper for classification purposes. These models are:
4.2.1 MobileNetV2
The convolutional neural network architecture Mo-
bileNetV2 (DSandler et al., 2018) is designed for
efficient mobile and embedded vision applications.
This architecture is an improvement over its predeces-
sor, MobileNetV1, and it introduces inverted resid-
ual structures with linear bottlenecks to enhance per-
formance while reducing computational and memory
costs. Compared with not only MobileNetV1 but
also some state-of-the-art image classification mod-
els, MobileNetV2 achieves a more effective balance
between high accuracy and low latency, making it an
outstanding candidate for on-device image recogni-
BIOIMAGING 2025 - 12th International Conference on Bioimaging
272

tion tasks.
The two main innovations in MobileNetV2 are
inverted residual structures and linear bottlenecks.
These not only enhance the performance of the deep
learning models when they are deployed on mobile
devices and edge devices but also improve their effi-
ciency. The way that they improve the performance
is by allowing the models to learn in a more effective
manner with better gradient flow, and the way they
increase the efficiency is by saving memory and
computational resources compared to MobileNetV1
and similar architectures. These ideas together enable
MobileNetV2 to deliver high accuracy and, at the
same time, require much less computing power when
both models are deployed on the same device.
4.2.2 EfficientNetB0
The deep learning model EfficientNetB0 (Tan and
Le, 2019) introduces a new method for scaling that
is called compound scaling. This method uniformly
scales the network’s depth, width, and resolution to
improve performance while maintaining efficiency.
Compared to previous architectures, models in the
EfficientNet family, which includes EfficientNetB0,
achieve a state-of-the-art level of accuracy on image
classification tasks while using significantly fewer pa-
rameters and much less computational power.
To conclude, the scaling of EfficientNetB0 pro-
vides a more comprehensive, effective, and efficient
means of scaling CNNs compared to traditional
methods like depth, width, or resolution scaling.
The scaling of CompoundNet is better in many
aspects: It is much more efficient. It avoids the
imbalance of width and depth that leads to excessive
computation and unfeasible models. It can be easily
adapted to different resource constraints, which
makes it versatile. And it leads to much better re-
sults in a top-1 accuracy with much fewer parameters.
4.2.3 ResNet101
He et al.’s ResNet101 (He et al., 2016), a deep convo-
lutional neural network, is part of the Residual Net-
work (ResNet) family designed to tackle the vanish-
ing gradient problem in exceedingly deep networks.
Composed of 101 layers, ResNet101 employs resid-
ual learning through shortcut connections that allow
the network to bypass one or more layers, which, in
effect, lets it learn identity mappings. These residual
connections not only facilitate learning in a network
with a few layers but also in a much deeper network,
since they enable gradients to propagate more easily
through the layers. With high classification accuracy,
ResNet101 has a modest computational requirement
and, therefore, has become a prevalent choice in im-
age classification tasks.
Introduced in ResNet101, residual learning brings
a substantial innovation to standard convolutional
neural networks. When building CNNs, practitioners
usually try to limit network depth because going too
deep tends to cause a performance decrease; for ex-
ample, adding more layers to a traditional CNN usu-
ally leads to worse performance. But this degradation
doesn’t stem from overfitting and isn’t ameliorated by
regularization or dropout. By substantially overcom-
ing the problem of going too deep, residual learning
shows that depth itself can be a key variable for im-
proving performance. Residual learning also leads to
better performance per unit depth, as ResNet101 is far
more accurate than traditional CNNs of similar depth.
4.2.4 DenseNet121
DenseNet121 (Huang et al., 2017) is a family of
neural network architectures that has shaken things
up a bit in the image classification world of late.
Their design pattern is quite straightforward: At
the core of a DenseNet lies a series of convolu-
tional operations (in 2D or 3D depending on the
application) interspersed with batch normalization
layers and non-linear activation functions. This
densely connected approach results in state-of-the-art
performance on image classification tasks with fewer
parameters compared to traditional convolutional
networks. DenseNet121 improves gradient flow,
parameter efficiency, feature reuse, and mitigates
vanishing gradient problems, leading to a more
compact and efficient network that outperforms many
traditional CNNs.
4.2.5 VGG16
VGG16 (Simonyan and Zisserman, 2014) is a deep
convolutional neural network model with 16 weight
layers. This model is impressive for its simplicity
and its depth, using small 3 × 3 convolutional filters
stacked on top of each other. The architecture of
VGG16 is amazing; it trades off the number of param-
eters for depth and is universally applied. It achieves
state-of-the-art results on the ImageNet dataset and is
known for its performance. Nevertheless, VGG16’s
design is inefficient. There are tradeoffs involved
in achieving depth versus the number of parame-
ters; however, using more parameters than necessary
doesn’t make VGG16 more effective. Its deployment
on hardware is costly, which limits its scalability.
Retinoblastoma Detection: Leveraging Deep Learning and Residual Connections for Enhanced Diagnostic Accuracy
273

More recent models, like ResNet, DenseNet, and Mo-
bileNet, achieve network depth more efficiently and
with fewer parameters.
4.2.6 Ensemble Model
An ensemble model (Dietterich, 2000) combines sev-
eral distinct models to create a single, stronger model
that outperforms any individual model. Ensembling
takes advantage of the fact that models can have very
different strengths and weaknesses and, when com-
bined, can achieve greater accuracy if the individual
models do not all make the same mistakes. The eas-
iest way to ensemble models is to average their pre-
dictions, which bootstrap aggregating does. A more
exciting way to ensemble models is to use them in a
sequence, which ”boosting” does. When we use the
term ensemble model in the context of deep learning,
we almost always mean a very large model that has
been pretrained on a very large dataset.
Combining the predictions of several basic mod-
els through a meta-model produces the final output in
stacking. Ensemble methods are especially effective
in chopping down variations and biases, and in boost-
ing prediction accuracy. Compared to single models,
ensemble models offer several key advantages, mostly
due to what might be called their model strength com-
bination and individual model weakness mitigation.
These advantages make them a potent machine learn-
ing tool for achieving high prediction performance
with a reliable model.
4.3 Training Hyperparameters and
Implementation Details
The parameters for the machine learning model were
configured as follows: the input images were down-
sampled to 64 × 64, the batch size was set to 4, and
the Adam optimizer was used for a maximum of 500
epochs. The loss function was binary cross-entropy
combined with Dice loss. The details of these hyper-
parameters are presented in Table 2.
Python, specifically Python 3 (Ketkar and Ketkar,
2017), was used to implement the model training.
The Keras deep learning library (Ketkar and Ketkar,
2017) was used to build the neural network models,
with TensorFlow (Abadi et al., 2016) being used as
the back-end for the actual computations.
4.4 Evaluation Metrics
In this study, we assessed our convolutional neural
network models for standard classification tasks. We
used several standard metrics to do the math. The
metrics have simple arithmetic involved, and all rely
on a few key numbers that involve the correct classi-
fication of positive and negative cases (true positives,
T P, and true negatives, T N) and the misclassification
of negative and positive cases (false positives, FP,
and false negatives, FN) (Goodfellow et al., 2016).
These are the metrics we used:
• Accuracy: In deep learning, accuracy is a perfor-
mance metric that measures the proportion of cor-
rectly predicted instances out of the total instances
in a dataset. This metric provides a straightfor-
ward way to evaluate the effectiveness of a model,
especially in balanced datasets. It is calculated us-
ing Equation 1:
Accuracy =
T P + T N
T P + T N + FP + FN
. (1)
• Precision: precision is a performance metric that
measures the proportion of true positive predic-
tions among all positive predictions made by the
model. It is particularly useful in scenarios where
the cost of false positives is high, providing in-
sight into the model’s accuracy in identifying pos-
itive instances correctly. It is calculated using
Equation 2:
Precision =
T P
T P + FP
. (2)
• Recall: (also known as sensitivity or true positive
rate) measures the proportion of actual positive in-
stances that the model correctly identifies. Recall
is crucial in applications where missing positive
instances has a high cost, providing insight into
the model’s ability to capture all relevant positive
cases. It is calculated using Equation 3:
Recall (Sensitivity) =
T P
T P + FN
. (3)
• Specificity: (also known as the true negative rate)
measures the proportion of actual negative in-
stances that the model correctly identifies. Speci-
ficity is particularly important in scenarios where
it is crucial to minimize false positives, as it pro-
vides insight into the model’s accuracy in identi-
fying negative instances correctly. It is calculated
using Equation 4:
Specificity =
T N
T N + FP
. (4)
• F1-score: It is a performance metric that com-
bines precision and recall into a single measure by
calculating their harmonic mean. F1-score is par-
ticularly useful for evaluating models on datasets
BIOIMAGING 2025 - 12th International Conference on Bioimaging
274
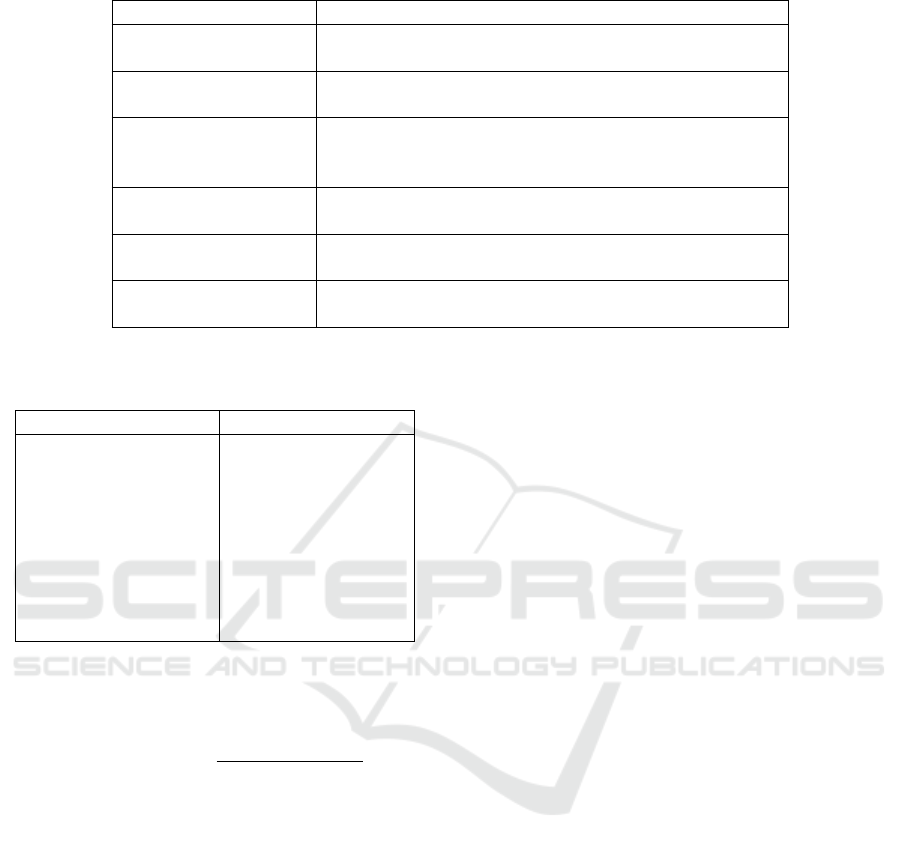
Table 1: The main characteristics of the models evaluated in this study.
Model Key Features
MobileNetV2 A cost-effective model known for its quick training and
execution.
EfficientNetB0 Offers a good balance between accuracy and computa-
tional efficiency.
ResNet101 Renowned for its ability to effectively learn deep fea-
tures and degradation problem when training very deep
networks.
DenseNet121 Provides several key advantages, including efficiency,
gradient flow, and parameter usage.
VGG16 A popular model used for its ability to capture complex
details in images.
Ensemble Model Combines results from several models to enhance overall
performance and accuracy.
Table 2: The training hyperparameters are applied during
the training process.
Hyperparameter Value
Loss Function CrossEntropyLoss
Learning Rate 0.001
Weight Decay 0.01
Number of Epochs 50
Batch Size 16
Optimizer Adam
Learning Rate Sched-
uler
ReduceLROnPlateau
Early Stopping Patience= 25 epochs
with imbalanced classes, as it balances the trade-
off between precision and recall. It is given by
Equation 5:
F1-score = 2 ×
Precision × Recall
Precision + Recall
. (5)
• Area Under the Curve (AUC) and Receiver Oper-
ating Characteristic (ROC) curve: AUC refers to
the area under the ROC curve, which plots the true
positive rate (recall) against the false positive rate
at various threshold settings.
5 RESULTS AND DISCUSSION
In this section, we will present the results and analyze
them using the six models and evaluation matrix dis-
cussed in the previous section. We will then discuss
the results and draw a conclusion. Finally, we will
suggest potential areas for further research.
5.1 Performance of Classification
Models
In this section, we provide a comprehensive evalua-
tion of various classification models. Table 3 sum-
marizes the performance of comparator models based
on RGB color images. Figure 3 illustrates a compari-
son of these models’ performance using ROC curves.
This comparison illustrates how different models can
offer various balances between sensitivity and speci-
ficity, aiding in making informed decisions about the
best models to use in specific applications.
In retinoblastoma classification, MobileNetV2 ex-
hibits perfect sensitivity with zero false negatives,
making it valuable for initial screening, but its low
specificity of 56.78% results in many false positives,
necessitating further evaluation to avoid unnecessary
stress for patients. EfficientNetB0, despite its per-
fect sensitivity, is impractical for clinical use due to
its 0% specificity, leading to 100% false positives and
a low overall accuracy of 53.40%, likely caused by
overfitting and dataset imbalance. ResNet101 stands
out with the highest accuracy of 97.42%, high sensi-
tivity of 95.18%, and perfect specificity of 100%, at-
tributed to its residual connections that balance com-
plexity and overfitting, though it requires further val-
idation on diverse datasets. DenseNet121 also shows
promise with a high accuracy of 93.68%, sensitivity
of 96.49%, and specificity of 90.45%, thanks to its
dense layer connectivity that aids in feature reuse and
extraction, though additional testing and hyperparam-
eter tuning are needed to confirm its reliability for
clinical use.
To sum up, ResNet101 excelled with a perfect
balance of sensitivity and specificity, ideal for clin-
ical use. DenseNet121 also performed well, main-
taining high sensitivity and specificity, suitable for
Retinoblastoma Detection: Leveraging Deep Learning and Residual Connections for Enhanced Diagnostic Accuracy
275
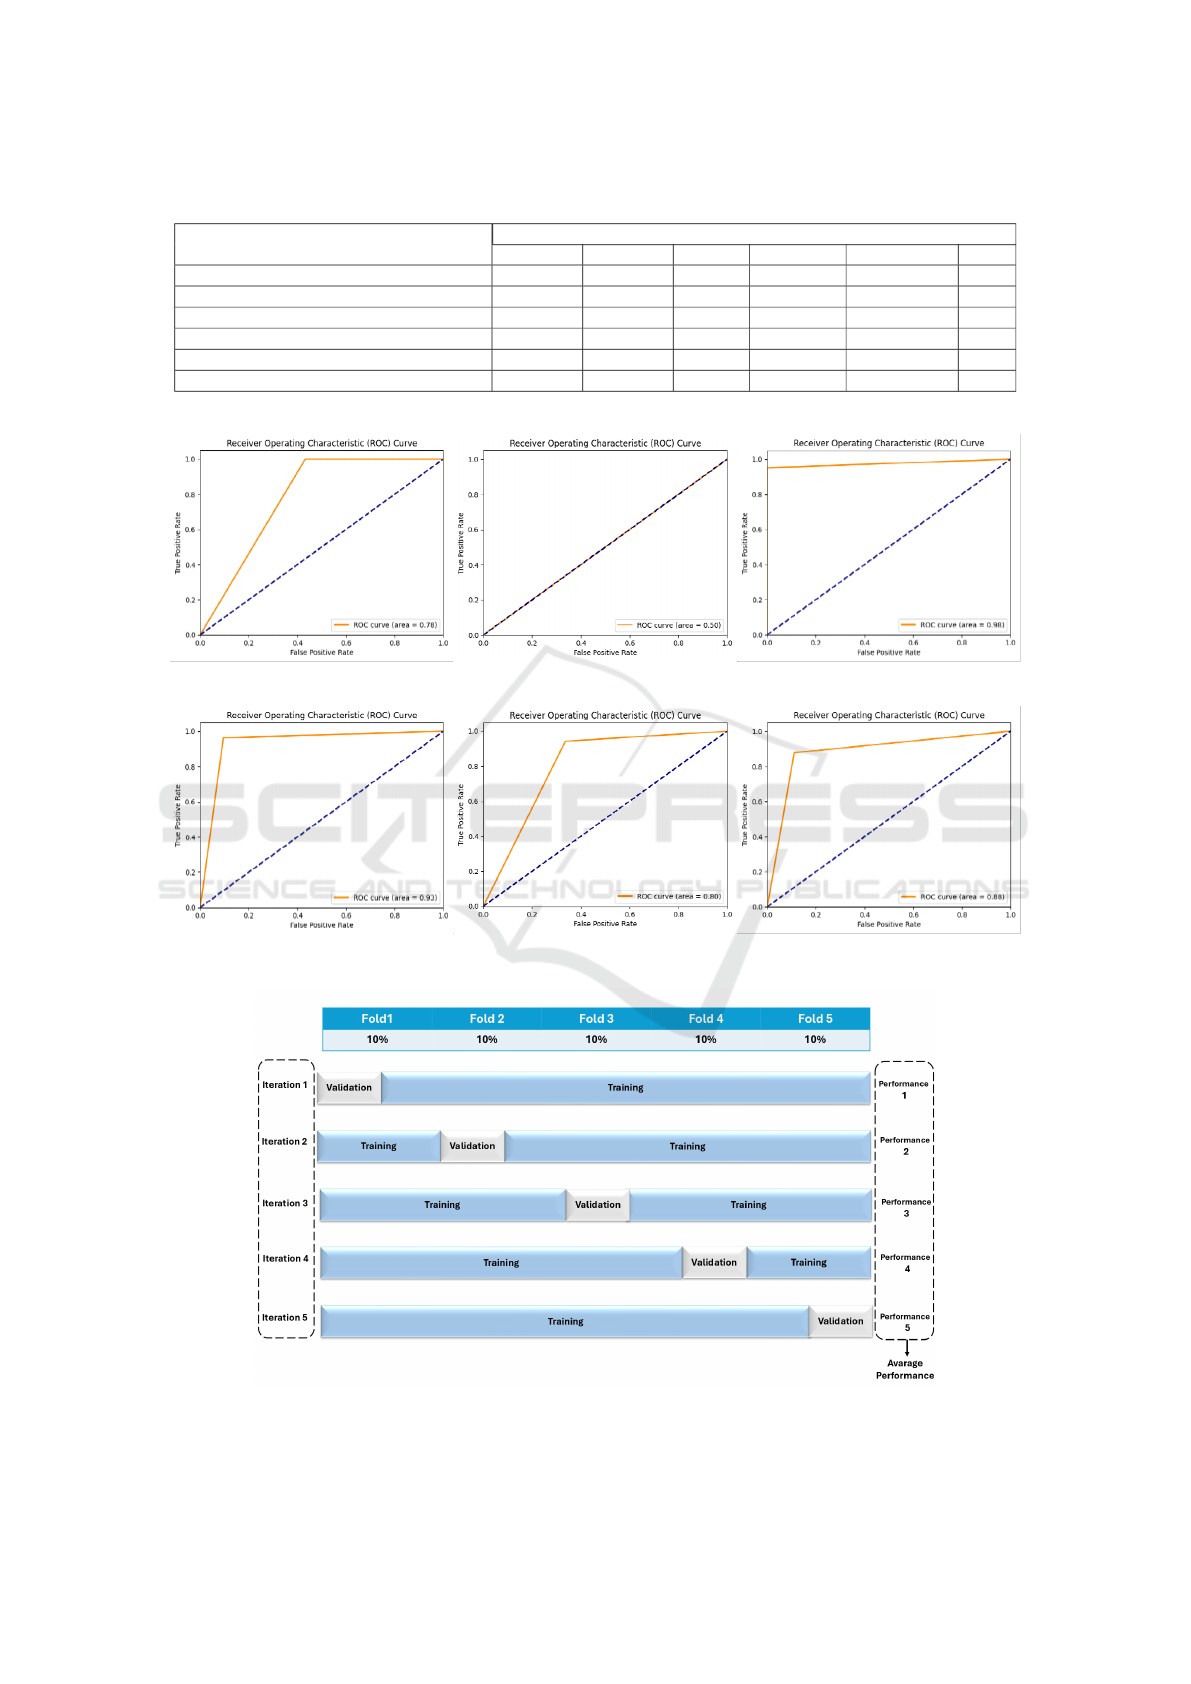
Table 3: Analyzing the quantitative performance of different CNN modules based on publicly available datasets.
CNN Classification Evaluation Matrix
Model Accuracy Precision Recall Specificity F1-Measure AUC
MobileNetV2 (DSandler et al., 2018) 79.86% 72.61% 100% 56.78% 84.13% 0.78
EfficientNetB0 (Tan and Le, 2019) 53.40% 53.40% 100% 0% 69.62% 0.50
ResNet101 (He et al., 2016) 97.42% 100% 95.18% 100% 97.53% 0.98
DenseNet121 (Huang et al., 2017) 93.68% 92.05% 96.49% 90.45% 94.22% 0.93
VGG16 (Simonyan and Zisserman, 2014) 81.26% 76.24% 94.30% 66.33% 84.31% 0.80
Ensemble Model (Dietterich, 2000) 88.29% 90.09% 87.72% 88.94% 88.89% 0.88
∗
Bold font indicates the best value.
(a) MobileNetV2 (b) EfficientNetB0 (c) ResNet101
(d) DenseNet121 (e) VGG16 (f) Ensemble Model
Figure 3: Mean ROC curve for all classification models.
Figure 4: A representation of the k-fold cross-validation method.
BIOIMAGING 2025 - 12th International Conference on Bioimaging
276
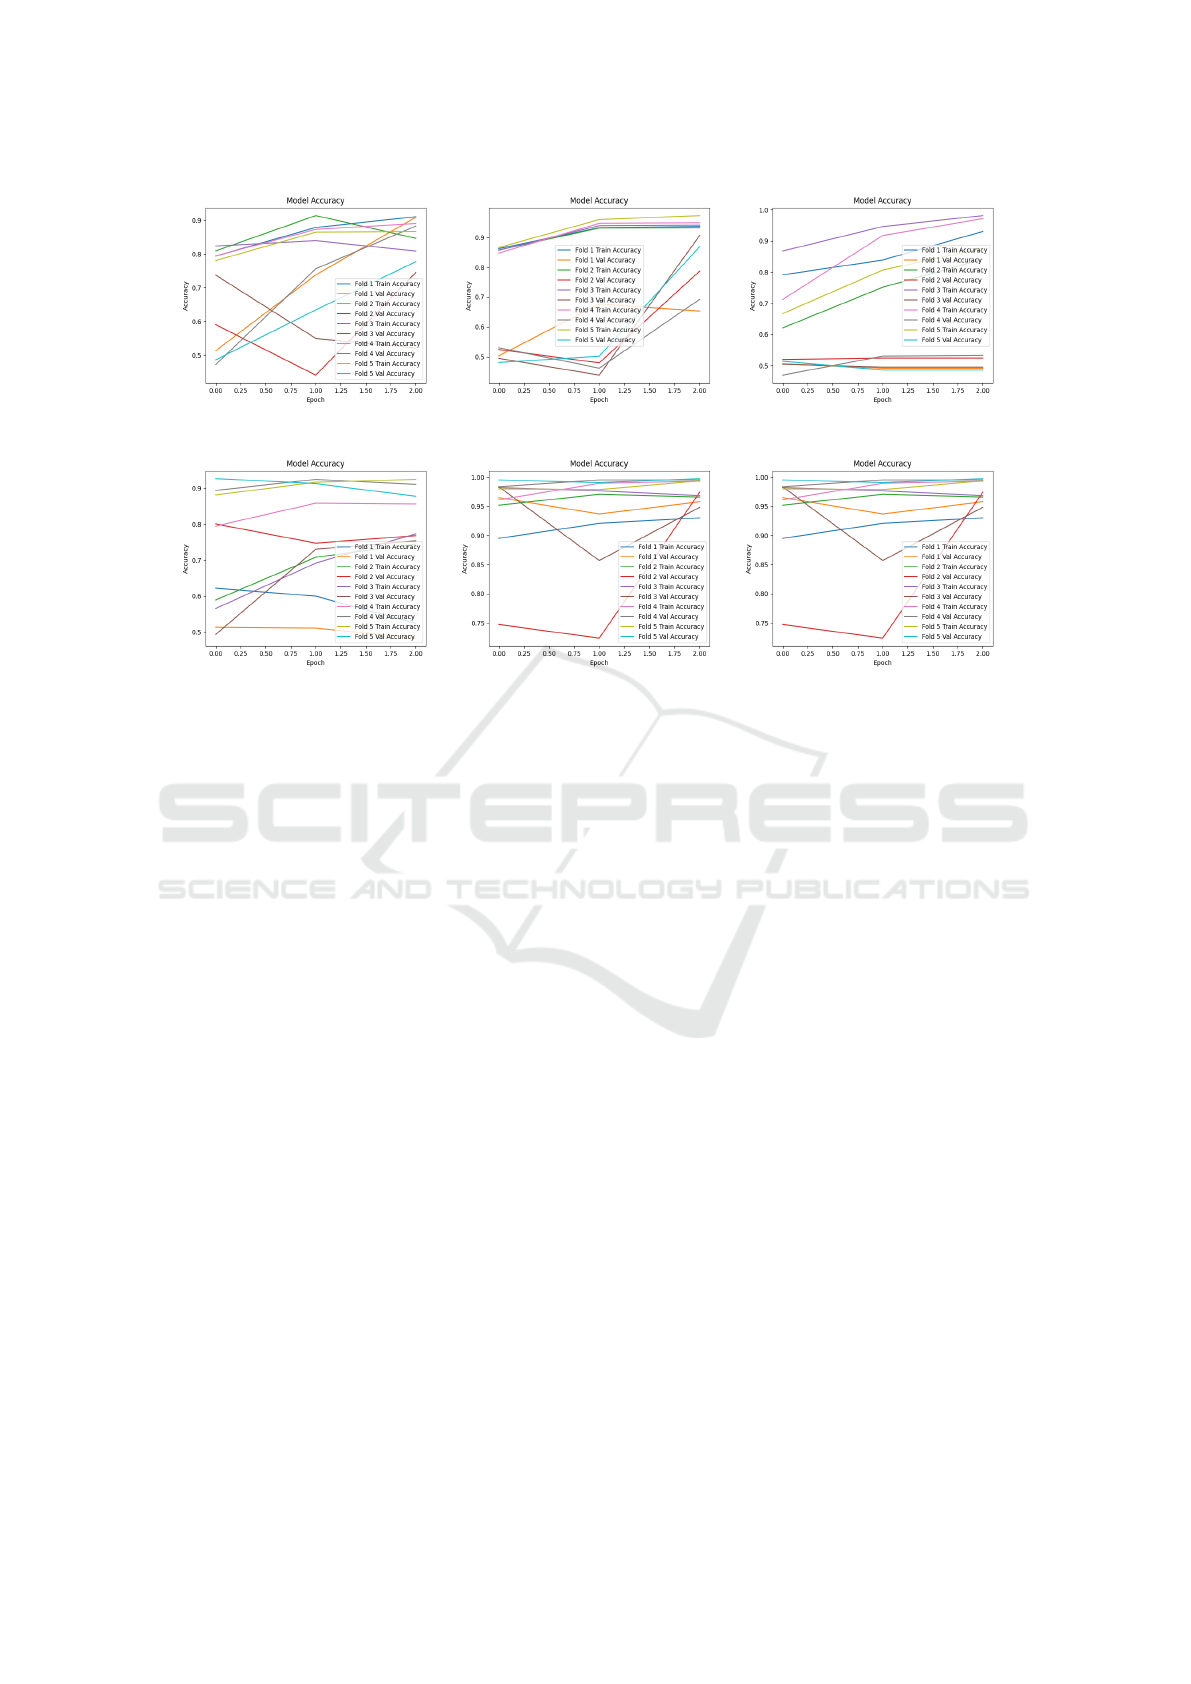
(a) MobileNetV2 (b) EfficientNetB0 (c) ResNet101
(d) DenseNet121 (e) VGG16 (f) Ensemble Model
Figure 5: Accuracy plots for comparator models across all k-values during the training and validation process.
critical scenarios. MobileNetV2, with the highest
sensitivity but lower specificity, is useful for initial
screenings. EfficientNetB0 and VGG16 had speci-
ficity issues, making them less suitable for clinical
settings but potentially valuable in preliminary diag-
nostics. The Ensemble Model proved effective, com-
bining multiple models to enhance diagnostic accu-
racy.
5.2 K-Fold Cross Validation
This paper examines the impact of data distribution on
validation performance using 5-fold cross-validation.
In this approach, the dataset was divided into 5 equal
subsets (folds), where each fold served as the valida-
tion set once while the remaining folds were used for
training. This process was repeated five times, and
the results were averaged to provide a robust evalu-
ation of model performance. The analysis highlights
how the model generalizes across different subsets of
the dataset, ensuring reliability and accuracy while re-
ducing the risk of overfitting.
Figure 4 illustrates the 5-fold cross-validation pro-
cess, while Figure 5 shows accuracy plots for com-
parator models across the training and validation sets
for each fold. Additionally, Table 4 presents a com-
parative summary of the performance across all five
folds, demonstrating the model’s ability to generalize
effectively and maximize data utility.
6 CONCLUSION
This work examines different deep learning classifica-
tion models and their performance in detecting retino-
plostoma from publicly available datasets. We found
that MobileNetV2 demonstrates exceptional sensitiv-
ity, making it highly effective at detecting cases of
retinoblastoma. However, its low specificity may re-
sult in a higher number of false positives. In contrast,
EfficientNetB0 achieves perfect sensitivity but lacks
specificity entirely, rendering it unsuitable for clini-
cal use without substantial adjustments. To improve
EfficientNetB0’s performance, strategies such as ex-
panding the training dataset with more normal eye
images, employing data augmentation methods, im-
plementing regularization techniques like L1/L2 reg-
ularization or dropout, and considering simpler model
architectures like MobileNetV2 could be used. These
approaches aim to balance sensitivity and specificity,
leading to a more reliable retinoblastoma classifica-
tion system.
ResNet101 emerges as the best overall performer,
offering an optimal balance between sensitivity and
specificity, thereby making it an ideal candidate
for practical applications. Similarly, DenseNet121
strikes a commendable balance between sensitivity
and specificity, proving to be a robust choice for sce-
narios where both accuracy and the minimization of
false positives are critical. VGG16, while exhibiting
Retinoblastoma Detection: Leveraging Deep Learning and Residual Connections for Enhanced Diagnostic Accuracy
277

Table 4: Summary comparing validation metrics across all k-values.
CNN Classification
K
Evaluation Matrix
Model Accuracy Precision Recall Specificity F1-Measure AUC
MobileNetV2 (DSandler et al., 2018)
1 79.86% 72.61% 100% 56.78% 84.13% 0.78
2 79.70% 72.54% 99.3% 56.50% 83.8% 0.71
3 78.80% 71.84% 98.51% 55.70% 82.46% 0.68
4 77.64% 70.64% 97.78% 54.85% 72.96% 0.64
5 76.46% 69.74% 96.80% 53.93% 62.88% 0.61
Mean 78.49% 71.47% 98.48% 55.55% 77.25% 0.68
EfficientNetB0 (Tan and Le, 2019)
1 52.86% 52.98% 88.40% 12.58% 69.45% 0.63
2 53.10% 53.27% 89.85% 12.95% 69.58% 0.64
3 52.40% 53.40% 90% 13% 69.62% 0.65
4 52.10% 53.33% 89.98% 12.98% 69.48% 0.62
5 51.98% 52.94% 89.88% 12.85% 69.34% 0.61
Mean 52.49% 53.18% 89.62% 12.87% 69.49% 0.63
ResNet101 (He et al., 2016)
1 97.42% 100% 95.18% 100% 97.53% 0.98
2 97.35% 99.98% 95.12% 99.97% 97.50% 0.97
3 97.02% 99.88% 94.98% 99.87% 97.47% 0.96
4 96.98% 99.82% 94.87% 99.81% 97.38% 0.95
5 96.87% 98.97% 94.82% 98.96% 97.13% 0.94
Mean 97.13% 99.73% 94.99% 99.72% 97.40% 0.96
DenseNet121 (Huang et al., 2017)
1 92.98% 91.63% 96.19% 90.15% 93.86% 0.89
2 93.42% 91.76% 96.28% 90.24% 93.91% 0.90
3 93.56% 91.94% 96.35% 90.38% 94.13% 0.91
4 93.68% 92.05% 96.49% 90.45% 94.22% 0.93
5 93.18% 91.96% 96.36% 90.31% 94.11% 0.92
Mean 93.36% 91.87% 96.33% 90.31% 94.05% 0.91
VGG16 (Simonyan and Zisserman, 2014)
1 80.89% 75.84% 93.98% 65.83% 83.98% 0.76
2 80.96% 75.97% 94.11% 65.95% 84.11% 0.77
3 81.03% 76.04% 94.20% 66.10% 84.22% 0.78
4 81.11% 76.13% 94.26% 66.23% 84.27% 0.79
5 81.26% 76.24% 94.30% 66.33% 84.31% 0.80
Mean 81.05% 76.04% 94.17% 0.66.09% 84.18% 0.78
Ensemble Model (Dietterich, 2000)
1 87.97% 98.61% 87.30% 88.56% 88.55% 0.84
2 88.03% 98.76% 87.42% 88.67% 88.63% 0.85
3 88.18% 98.84% 87.55% 88.77% 88.77% 0.86
4 88.20% 98.97% 87.61% 88.86% 88.86% 0.87
5 88.29% 90.09% 87.72% 88.94% 88.89% 0.88
Mean 88.13% 97.05% 87.52% 88.76% 88.74% 0.86
∗
Bold font indicates the best fold value for each models.
good sensitivity, falls short in specificity compared to
other models, which diminishes its effectiveness in
reducing false alarms. Lastly, the ensemble model
provides a well-balanced performance across all met-
rics, suggesting that integrating multiple model out-
puts can enhance overall performance and reliability.
However, despite our results, some factors should
be taken into account. This research was conducted
using only one dataset. The conclusions drawn from
this dataset may not be representative of the entire
population. In order to ensure the accuracy of the
results, further research should be conducted with a
larger sample size. Future research could consider
expanding data collection to multiple sources or col-
laborating with other research teams to combine data
sets. Moreover, implementing more diverse partic-
ipant selection processes and increasing recruitment
efforts will help ensure a representative sample.
REFERENCES
Abadi, M., Barham, P., Chen, J., Chen, Z., Davis, A., Dean,
J., Devin, M., Ghemawat, S., Irving, G., Isard, M.,
et al. (2016). Tensorflow: a system for large-scale
machine learning. In Osdi, volume 16, pages 265–
283, Savannah, GA, USA.
Aldughayfiq, B., Ashfaq, F., Jhanjhi, N., and Humayun, M.
(2023). Explainable ai for retinoblastoma diagnosis:
interpreting deep learning models with lime and shap.
Diagnostics, 13(11):1932.
Chollet, F. et al. (2015). Keras: Deep learning library
for theano and tensorflow. URL: https://keras. io/k,
7(8):T1.
Dietterich, T. G. (2000). Ensemble methods in machine
learning. In International workshop on multiple clas-
sifier systems, pages 1–15, Cagliari, Italy.
DSandler, M., Howard, A., Zhu, M., Zhmoginov, A., and
Chen, L.-C. (2018). Mobilenetv2: Inverted residu-
als and linear bottlenecks. In IEEE/CVF Conference
BIOIMAGING 2025 - 12th International Conference on Bioimaging
278

on Computer Vision and Pattern Recognition, pages
4510–4520, Salt Lake City, UT, USA.
Durai, C., Jebaseeli, T. J., Alelyani, S., and Mubharakali, A.
(2021). Early prediction and diagnosis of retinoblas-
toma using deep learning techniques. arXiv preprint
arXiv:2103.07622.
Duraivenkatesh, S., Narayan, A., Srikanth, V., and Made,
A. F. (2023). Retinoblastoma detection via image pro-
cessing and interpretable artificial intelligence tech-
niques. In 2023 IEEE Conference on Artificial Intelli-
gence (CAI), pages 166–167, Santa Clara, California,
USA.
Goodfellow, I., Bengio, Y., and Courville, A. (2016). Deep
learning. MIT press.
He, K., Zhang, X., Ren, S., and Sun, J. (2016). Deep resid-
ual learning for image recognition. In Proceedings of
the IEEE conference on computer vision and pattern
recognition, pages 770–778, Las Vegas, NV, USA.
Huang, G., Liu, Z., Van Der Maaten, L., and Weinberger,
K. Q. (2017). Densely connected convolutional net-
works. In Proceedings of the IEEE conference on
computer vision and pattern recognition, pages 4700–
4708, Honolulu, HI, USA.
Kaliki, S., Vempuluru, V. S., Ghose, N., Patil, G., Viriyala,
R., and Dhara, K. K. (2023). Artificial intelligence
and machine learning in ocular oncology: Retinoblas-
toma. Indian Journal of Ophthalmology, 71(2):424–
430.
Ketkar, N. and Ketkar, N. (2017). Introduction to keras.
Deep learning with python: a hands-on introduction,
pages 97–111.
Mistry, J. and Ramakrishnan, R. (2023). The automated eye
cancer detection through machine learning and image
analysis in healthcare. Journal of Xidian University,
17(8):763–763.
Pol, N., Pandya, B., Craig, J., Walter, J., Kahrs, L., and
Mallipatna, A. (2024). Automated segmentation of
retinoblastoma from optical coherence tomography
images. Investigative Ophthalmology & Visual Sci-
ence, 65(7):2410–2410.
Shanthini, J., Poovizhi, P., Kavitha, M. S., and Karthik, S.
(2024). An approach towards the detection of eye can-
cer using configured convolution neural network with
sine cosine fitness gray wolf optimizer. Journal of In-
telligent & Fuzzy Systems, (Preprint):1–17.
Shields, C. L. and Shields, J. A. (2004). Diagnosis
and management of retinoblastoma. Cancer control,
11(5):317–327.
Simonyan, K. and Zisserman, A. (2014). Very deep con-
volutional networks for large-scale image recognition.
arXiv preprint arXiv:1409.1556.
Tan, M. and Le, Q. (2019). Efficientnet: Rethinking model
scaling for convolutional neural networks. In Interna-
tional conference on machine learning, pages 6105–
6114, Long Beach, California, USA.
Zhang, R., Dong, L., Li, R., Zhang, K., Li, Y., Zhao, H., Shi,
J., Ge, X., Xu, X., Jiang, L., et al. (2023). Automatic
retinoblastoma screening and surveillance using deep
learning. British Journal of Cancer, 129(3):466–474.
Retinoblastoma Detection: Leveraging Deep Learning and Residual Connections for Enhanced Diagnostic Accuracy
279
