
Adaptive Out-of-Distribution Detection with Coarse-to-Fine Grained
Representation
Kohei Fukuda and Hiroaki Aizawa
Graduate School of Advanced Science and Engineering,
Hiroshima University, Higashi-Hiroshima, Japan
{m231319, hiroaki-aizawa}@hiroshima-u.ac.jp
Keywords:
Machine Learning, Out-of-Distribution Detection, Representation Learning.
Abstract:
Out-of-distribution (OOD) detection, which aims to identify data sampled from a distribution different from
the training data, is crucial for practical machine learning applications. Despite the coarse-to-fine structure of
OOD data, which includes features at various granularities of detail, such as object shapes (coarse features)
and textures (fine features), most existing methods represent an image as a fixed-length feature vector and
perform detection by calculating a single OOD score from this vector. To consider the coarse-to-fine structure
of OOD data, we propose a method for detecting OOD data that uses feature vectors that contain information
at different granularities obtained by Matryoshka representation learning. Adaptive sub-feature vectors are
selected for each OOD dataset. The OOD scores calculated from these vectors are taken as the final OOD
scores. Experiments show that the proposed method outperforms existing methods in terms of OOD detection.
Moreover, we analyze the relationship between each OOD dataset and the sub-feature vectors selected by our
method.
1 INTRODUCTION
Out-of-distribution (OOD) detection is a fundamental
task in the field of machine learning, that aims to iden-
tify data sampled from a distribution different from
that of the training data. In particular, OOD detec-
tion is crucial for practical machine learning appli-
cations to ensure model safety and reliability. Many
sophisticated OOD detection methods have been pro-
posed. To distinguish between In-Distribution (ID)
and OOD data, some methods use the OOD score,
defined based on model characteristics and statistical
metrics (Hendrycks and Gimpel, 2016; Liang et al.,
2017; Lee et al., 2018; Liu et al., 2020; Hendrycks
et al., 2019; Huang et al., 2021). Methods for training
ID data and large-scale OOD data (Hendrycks et al.,
2018; Chen et al., 2021; Zhang et al., 2023) have
achieved remarkable OOD detection performance.
Despite advances in OOD detection methods us-
ing deep learning, modeling OOD data remains gen-
erally challenging due to their unknown properties.
For instance, OOD image samples have a coarse-to-
fine structure, which contains features at various gran-
ularities of detail, such as objects (global coarse fea-
tures) and textures (local fine features). The perfor-
mance of OOD detection thus strongly depends on the
structure and characteristics of the OOD data. How-
ever, most existing methods represent a given image
as a fixed-length feature vector and perform detection
by calculating a single OOD score from this vector.
Therefore, these methods may often ignore the intrin-
sic structure of the OOD data and the distribution dif-
ferences characterized by this structure.
In this paper, based on the assumption that OOD
data have a coarse-to-fine structure and suitable di-
mensions for representing their structure, we pro-
pose an OOD detector that utilizes nested representa-
tions considering the OOD data feature granularities
and an adaptive OOD detection framework to iden-
tify suitable dimensional partial feature vectors. For
the OOD detector, to consider the feature granulari-
ties, we incorporate Matryoshka representation learn-
ing (MRL) (Kusupati et al., 2022) into an existing
feature extractor. MRL is a method that trains a net-
work by partitioning the feature vectors with a coarse-
to-fine structure obtained from the feature extractor,
creating different classification heads for each, and
minimizing the error values defined from them. This
method enables the learning of coarse-to-fine feature
vectors where the low-dimensional part contains the
overall structure and global information and the high-
dimensional part contains more detailed patterns and
local information of ID data.
Fukuda, K. and Aizawa, H.
Adaptive Out-of-Distribution Detection with Coarse-to-Fine Grained Representation.
DOI: 10.5220/0013100100003912
Paper published under CC license (CC BY-NC-ND 4.0)
In Proceedings of the 20th International Joint Conference on Computer Vision, Imaging and Computer Graphics Theory and Applications (VISIGRAPP 2025) - Volume 2: VISAPP, pages
19-26
ISBN: 978-989-758-728-3; ISSN: 2184-4321
Proceedings Copyright © 2025 by SCITEPRESS – Science and Technology Publications, Lda.
19
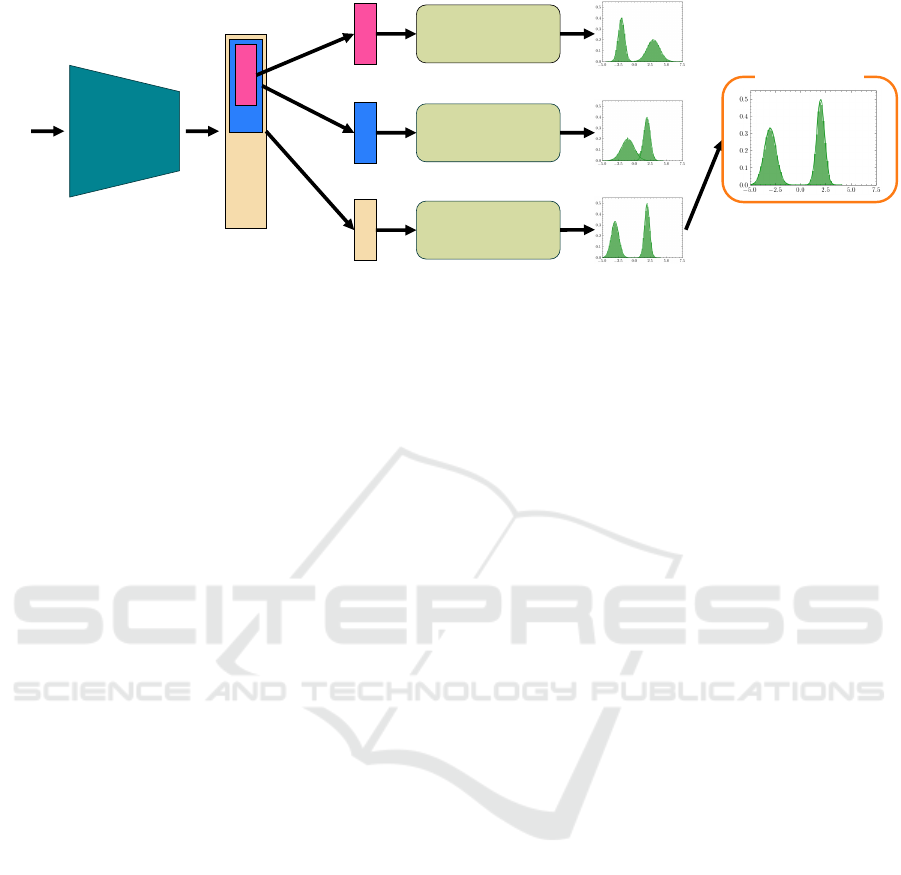
Feature
Extractor
𝒙
Feature 𝑧
OOD Score Function
𝑆(𝒚)
OOD Score Function
𝑆(𝒚)
OOD Score Function
𝑆(𝒚)
Silhouette Score=0.65
Silhouette Score=0.5
Silhouette Score=0.7
Final OOD Score
Head
Figure 1: Overview of proposed method. Using a model trained using Matryoshka representation learning, OOD scores are
calculated for each feature vector. Based on the assumption that a histogram of the OOD scores has two peaks, the OOD scores
are classified into two clusters using the k-means method. OOD scores with the highest silhouette score, which represents the
cluster performance, are taken as the final OOD scores.
For the adaptive OOD detection method, assum-
ing that multiple OOD data points are included in the
detection target, we calculate an OOD score for de-
tecting OOD data from the selected coarse-to-fine fea-
ture vectors. Specifically, for all data in the detection
target, the OOD score is calculated from each sub-
feature vector and classified into one of two clusters
using the k-means (MacQueen et al., 1967) method.
Based on the silhouette scores (Rousseeuw, 1987) of
the two clusters, the sub-feature vectors with the best
dimension are selected. The OOD scores obtained
from these vectors are used as the final OOD scores.
This method allows for obtaining OOD scores from
feature vectors of a suitable dimension independent of
OOD data. Additionally, our OOD detection method
can be trained only on ID data.
We conducted experiments on several datasets to
verify the effectiveness of our MRL-based OOD de-
tector and the selection method. With MRL used
to select the best dimensional sub-feature vectors for
OOD detection, we achieved higher detection accu-
racy than that of the original methods in most OOD
detection tasks, improving the false positive rate at
95% true positive rate (FPR95) by up to 5.12%.
2 PRELIMINARIES
2.1 Definition
In this paper, we consider OOD detection in super-
vised multi-class classification. The data used for
training D
train
id
= {x
i
,t
i
}
N
train
i=1
are N
train
dataset in-
dependently obtained from a joint data distribution
P
X ×T
, where X ∈ R
n
is the input space and T =
{1, ..., k} is the label space. When training with these
data, we optimize the parameter θ of the classifier
model f (x, θ) : X → R
k
. The distribution followed
by the data used for this training D
train
id
is called ID
and the distribution not followed by the data is called
OOD. We define OOD data as D
ood
.
2.2 Out-of-Distribution Detection
OOD detection is the task of classifying whether
the input to the model belongs to the distribution of
D
train
id
. When some unknown data x are input to the
model during evaluation, the OOD score S(x) is cal-
culated from the information available from the model
(e.g., softmax probability, logit, gradients). The ID or
OOD is classified based on whether it is larger than
an arbitrary threshold τ, as follows.
S(x) =
(
in, if S(x) ≥ τ
out, if S(x) < τ
. (1)
Improvement in the accuracy of OOD detection
leads to an increase in the safety and reliability of ma-
chine learning models. Methods related to OOD de-
tection include post-hoc methods for post-processing
the trained model (Hendrycks and Gimpel, 2016;
Liang et al., 2017; Lee et al., 2018; Liu et al., 2020;
Hendrycks et al., 2019; Huang et al., 2021), training-
based methods that facilitate OOD detection (DeVries
and Taylor, 2018; Wei et al., 2022), and methods that
use large-scale OOD datasets for training (Hendrycks
et al., 2018; Chen et al., 2021; Zhang et al., 2023). To
improve the accuracy of OOD detection, we propose a
method that uses models trained with MRL (Kusupati
et al., 2022) and existing OOD score methods.
VISAPP 2025 - 20th International Conference on Computer Vision Theory and Applications
20

3 PROPOSED METHOD
We propose an OOD detector based on a nested repre-
sentation of coarse-to-fine vectors using MRL (Kusu-
pati et al., 2022) (Sec. 3.1) and a method for select-
ing partial dimensions for OOD detection based on
the assumption that OOD data have a coarse-to-fine
structure and adaptive dimensions (Sec. 3.2).
3.1 OOD Detector with Coarse-to-Fine
Representation
To consider the intrinsic coarse-to-fine structure of
OOD data, we design an OOD detector based on
MRL (Kusupati et al., 2022). This method aims to
learn the fixed-length representation containing infor-
mation about the input data at various granularities.
This enables various downstream tasks to be solved
using only low-dimensional feature vectors, thus re-
ducing the memory cost.
We now describe the MRL used in the proposed
method in a multi-class classification problem set-
ting. By feeding the input data x ∈ R
n
into the fea-
ture extractor G
θ
: R
n
→ R
d
, a d-dimensional fixed-
length feature vector z ∈ R
d
can be obtained. This
feature vector is then partitioned, for example into
z
1:M [0]
, z
1:M [1]
, ..., z
1:M [−1]
based on the nesting di-
mension M (in this paper M = {8, 16, 32, ..., 256}).
Here, these segmented feature vectors are called sub-
feature vectors. For all generated sub-feature vectors,
we create a trainable linear classifier head W
(m)
(m ∈
M ) and calculate the prediction probability for the
number of nesting dimensions. The loss function of
MRL, which consists of the above, is as follows,
L = E
(x,t)∼D
train
id
[
∑
m∈M
L
CE
(W
(m)
· G(x; θ);t)], (2)
where L
CE
is the cross-entropy loss function for
multi-class classification. By updating the weight pa-
rameters to minimize Eq. (2), a coarse-to-fine feature
vector can be obtained in which the low-dimensional
vectors contain essential information about the task
to be solved. As, as the dimensions are increased, in-
formation necessary for identifying individual data is
added.
3.2 Feature Selection for Adaptive OOD
Detection
As mentioned, MRL enables us to obtain a coarse-to-
fine feature vector in which the low-dimensional part
contains the overall structure and global information
and the high-dimensional part contains more detailed
patterns and local information. To utilize such global
and local information, we introduce a method for se-
lecting feature vectors with the most suitable dimen-
sion for OOD detection from a Matryoshka represen-
tation consisting of feature vectors of multiple nested
dimensions, depending on OOD data.
The algorithm for selecting a dimension of the
suitable feature vector for OOD detection is given in
Algorithm 1. For the whole dataset (D
test
id
∪ D
ood
),
as explained in Sec. 3.1, a feature vector G
𭟋
is ob-
tained using the feature extractor G
θ
trained by MRL
and divided into |M | sub-feature vectors according
to the nesting dimension M . Then, for each sub-
feature vector, OOD scores are calculated using OOD
score functions such as maximum softmax proba-
bility(MSP) (Hendrycks and Gimpel, 2016) and En-
ergy (Liu et al., 2020). For each sub-feature vector,
the calculated OOD scores for all data are used to
group the data into two clusters using the k-means
method (MacQueen et al., 1967). The silhouette score
(Rousseeuw, 1987), defined below, is calculated to
evaluate the cluster performance.
S
silhouette
(a, b) =
b − a
max(a, b)
, (3)
where a is the degree of condensation, defined as the
average distance from each point to other points in
the cluster to which the point belongs, and b is the
degree of separation, defined as the average distance
from each point to all points in the nearest other clus-
ter. The sub-feature vector with the highest silhouette
score is selected and the OOD score obtained from
this sub-feature vector is the final OOD score. It is im-
portant to note that unlike the original OOD scoring
methods, our method is designed to enhance detection
accuracy under the assumption that multiple OOD
data points are included. To verify whether the target
data contains OOD data, it is necessary to examine
metrics such as the false positive rate or histograms
derived from the OOD scores obtained from the fea-
ture vectors across all dimensions. If these analyses
suggest the presence of OOD data, our method can be
employed to improve detection accuracy.
4 EXPERIMENTS
In this section, we validate the effectiveness of the
proposed method and conduct a performance com-
parison for various dimensions of the feature vectors.
The evaluation uses scenarios where there are multi-
ple OOD data points in the detection target.
Adaptive Out-of-Distribution Detection with Coarse-to-Fine Grained Representation
21

Algorithm 1: An algorithm for the selection of optimal dimensional feature vectors and the calculation of the final OOD score.
Data: D
all
= D
test
id
∪ D
ood
, Pre-trained feature extractor G(θ), Nesting List M
Result: Final OOD Score
ˆs
silhouette
← −1 ;
ˆ
S
ood
← {} ;
for each nesting dimensions m ∈ M do
for x ∈ D
all
do
S
ood
← {};
z ← G(θ, x);
Calculate OOD score s from z
1:m
;
S
ood
← S
ood
∪ {s} ;
end
Cluster S
ood
into two clusters using k-means algorithm ;
Calculate silhouette score s
silhouette
of S
ood
;
if ˆs
silhouette
< s
silhouette
then
ˆs
silhouette
← s
silhouette
;
ˆ
S
ood
← S
ood
;
end
end
return
ˆ
S
ood
4.1 Experimental Settings
4.1.1 Datasets
Following benchmarks for OOD detection in multi-
class image classification, we use CIFAR-10 and
CIFAR-100(Krizhevsky and Hinton, 2009) as ID
datasets. In addition, to measure OOD detec-
tion accuracy, Places (Zhou et al., 2017), LSUN,
LSUN-resize (Yu et al., 2015), iSUN (Xu et al.,
2015), Texture (Cimpoi et al., 2014), and SVHN (Net-
zer et al., 2011) as OOD data.
4.1.2 Details
The model used in these experiments is a wide resid-
ual network (Zagoruyko and Komodakis, 2016). The
neural network parameters are updated using Nes-
terov’s accelerated gradient descent method with a
momentum of 0.9 and a weight decay of 1.0 × 10
−4
.
Both CIFAR-10 and CIFAR-100 are used to train the
model for 100 epochs. The initial learning rate is 0.1;
it is multiplied by 0.1 at 50, 75, and 95 epoch. The
batch size is set to 64. Experiments are conducted us-
ing five different seeds. The average values are used
as the evaluation values.
4.1.3 Evaluation Metrics
To measure OOD detection performance, we use
FPR95 and the area under the receiver operating char-
acteristic curve(AUROC).
4.1.4 OOD Score Function
To compare the OOD detection accuracy of the base-
line training method and the proposed method, three
OOD score functions are used for evaluation, namely
MSP(Hendrycks and Gimpel, 2016), an energy-based
score (Energy) (Liu et al., 2020), and maximum logit
score (MaxLogit) (Hendrycks et al., 2019).
4.2 Results
In this section, we show the results obtained using the
evaluation metrics calculated for the baseline training
method (baseline) and those for the proposed method
using the three OOD score functions introduced in
Sec. 4.1.4.
4.2.1 Main Results
The average scores of the evaluation metrics for six
OOD datasets are summarized in Table 1. This table
shows that the proposed method improves the accu-
racy of OOD detection, except for the AUROC value
when ID data are CIFAR-100 and the OOD score
function is MSP. When the ID data are CIFAR-10,
our method improved the FPR95 by up to 5.12% and
the AUROC by up to 2.12. When the ID data are
CIFAR-100, our method improved the FPR95 by up
to 4.8% and the AUROC by up to 0.64. In particu-
lar, the accuracy improves significantly when Energy
and MaxLogit scores are used. These results, confirm
that the proposed method is effective for OOD detec-
tion, it improves accuracy in most cases. A compar-
VISAPP 2025 - 20th International Conference on Computer Vision Theory and Applications
22
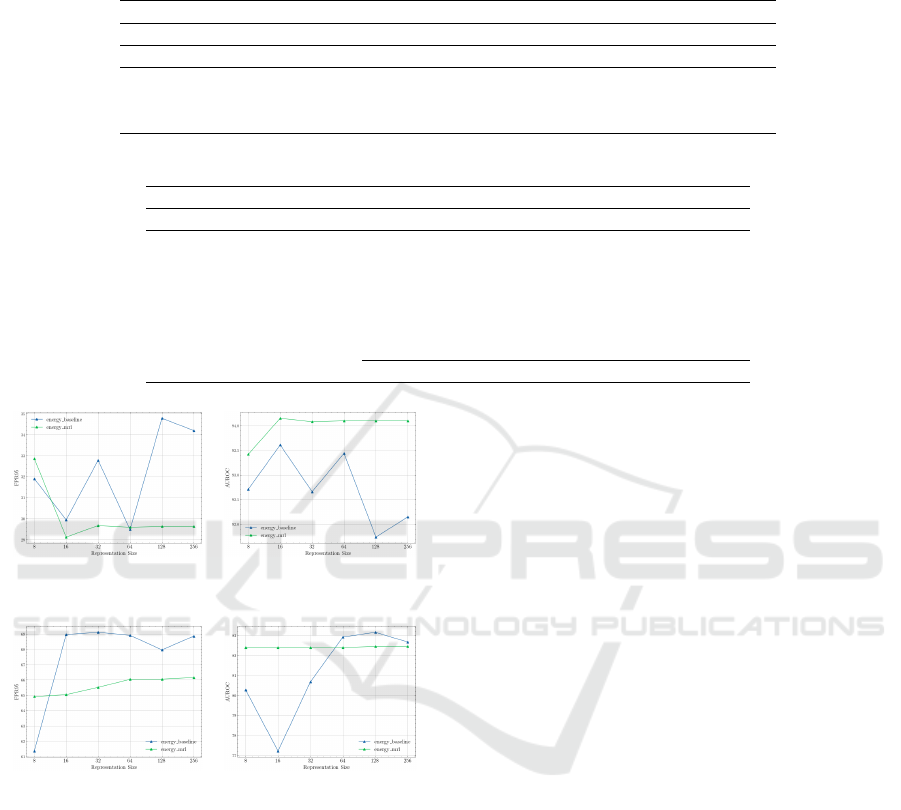
Table 1: Comparison by averages of evaluation metrics. We use Maximum Softmax Probability, Energy, and MaxLogit score.
From this table, the detection accuracy is improved in most of the cases compared to the baseline, and these results show the
effectiveness of our proposed method.
ID dataset CIFAR-10 CIFAR-100
Metrics FPR95 AUROC FPR95 AUROC
baseline / ours
MSP 52.25 / 50.87 91.10 / 91.75 80.78 / 79.88 76.17 / 75.86
Energy 33.96 / 28.84 92.15 / 94.27 68.16 / 64.12 82.81 / 83.23
MaxLogit 34.19 / 29.12 92.15 / 94.25 68.86 / 64.06 82.67 / 83.31
Table 2: The results of OOD detection accuracy when using MSP (CIFAR-10).
ID dataset OOD Score OOD dataset FPR95 AUROC
baseline / ours
CIFAR-10 MSP
places365 60.02 / 58.76 88.65 / 89.06
LSUN 31.02 / 28.37 95.86 / 96.24
LSUN-resize 49.53 / 50.41 92.15 / 92.36
iSUN 53.70 / 54.22 91.02 / 91.21
Texture 60.60 / 60.06 88.74 / 88.98
SVHN 58.62 / 53.39 90.15 / 92.66
average 52.25 / 50.87 91.10 / 91.75
Figure 2: OOD detection performance for various dimen-
sions when CIFAR-10 is used for training.
Figure 3: OOD detection performance for various dimen-
sions when CIFAR-100 is used for training.
ison of the accuracy for each OOD dataset when the
ID data are CIFAR-10 is summarized in Tables 2, 3,
and 4 for MSP, Energy, and MaxLogit, respectively.
MSP shows an improvement in the average evalua-
tion value, although the accuracy of MSP varies de-
pending on the dataset. On the other hand, when
MaxLogit and Energy scores are used, the accuracy
is improved for all OOD datasets, confirming their
effectiveness. Moreover, a comparison of the ac-
curacy for each OOD dataset when the ID data are
CIFAR-100 is summarized in Tables5, 6, and 7.
4.2.2 Comparison of OOD Performance by
Number of Features’ Dimensions
In this section, we evaluate the performance of OOD
methods and the difference in OOD detection accu-
racy for each dimension between the baseline training
method and MRL. Figs. 2 and 3 show the evaluation
results obtained with CIFAR-10 and CIFAR-100, re-
spectively. “energy baseline” in these figures repre-
sents the OOD detection performance of the method
trained using a classifier that is created from the fea-
ture vector (256 dimensions in these experiments)
output from the feature extractor, with M dimen-
sions (8, 16, ..., 256) from the top. These figures show
that the OOD detection performance of the baseline
depends on the dimension, whereas MRL shows con-
sistently high OOD detection performance regardless
of the dimension. The OOD data show that MRL is
effective for selecting the feature vector with the best
dimension for OOD detection, which is computation-
ally inexpensive and maintains constant accuracy for
any dimension.
5 ANALYSIS
5.0.1 Silhouette Score and OOD Detection
Performance
In this section, we analyze whether the silhouette
score, which indicates the clustering performance of
the proposed method, is effective for selecting a suit-
able dimension for OOD detection. Fig. 4 shows the
Adaptive Out-of-Distribution Detection with Coarse-to-Fine Grained Representation
23
Table 3: The results of OOD detection accuracy when using Energy score (CIFAR-10).
ID dataset OOD Score OOD dataset FPR95 AUROC
baseline / ours
CIFAR-10 Energy
places365 42.35 / 37.97 89.54 / 91.41
LSUN 4.13 / 2.28 99.04 / 99.38
LSUN-resize 26.62 / 22.91 95.08 / 95.98
iSUN 31.83 / 27.81 94.0 / 95.04
Texture 53.70 / 49.26 85.85 / 89.05
SVHN 45.13 / 32.78 89.36 / 94.76
average 33.96 / 28.84 92.15 / 94.27
Table 4: The results of OOD detection accuracy when using MaxLogit score (CIFAR-10).
ID dataset OOD Score OOD dataset FPR95 AUROC
baseline / ours
CIFAR-10 MaxLogit
places365 42.75 / 38.23 89.54 / 91.39
LSUN 4.45 / 2.41 98.98 / 99.33
LSUN-resize 27.22 / 23.35 95.05 / 95.94
iSUN 32.26 / 28.33 93.96 / 94.99
Texture 53.40 / 49.18 85.96 / 89.10
SVHN 45.05 / 33.25 89.40 / 94.75
average 34.19 / 29.12 92.15 / 94.25
Table 5: The results of OOD detection accuracy when using MSP (CIFAR-100).
ID dataset OOD Score OOD dataset FPR95 AUROC
baseline / ours
CIFAR-100 MSP
places365 83.61 / 83.26 75.62 / 75.10
LSUN 65.36 / 63.67 85.56 / 85.78
LSUN-resize 84.31 / 82.04 72.98 / 73.07
iSUN 85.83 / 84.14 71.82 / 71.22
Texture 85.19 / 84.75 74.11 / 73.20
SVHN 81.38 / 81.44 76.89 / 76.79
average 80.78 / 79.88 76.17 / 75.86
Table 6: The results of OOD detection accuracy when using Energy score (CIFAR-100).
ID dataset OOD Score OOD dataset FPR95 AUROC
baseline / ours
CIFAR-100 Energy
places365 80.24 / 79.17 77.80 / 76.97
LSUN 18.95 / 24.01 96.84 / 96.10
LSUN-resize 73.10 / 59.50 82.14 / 84.90
iSUN 77.57 / 69.96 80.28 / 80.11
Texture 85.29 / 80.22 75.40 / 76.85
SVHN 73.79 / 71.87 84.38 / 84.47
average 68.16 / 64.12 82.81 / 83.23
Table 7: The results of OOD detection accuracy when using MaxLogit score (CIFAR-100).
ID dataset OOD Score OOD dataset FPR95 AUROC
baseline / ours
CIFAR-100 MaxLogit
places365 80.09 / 78.76 77.89 / 76.96
LSUN 21.86 / 25.55 96.44 / 95.85
LSUN-resize 74.0 / 60.14 81.87 / 84.78
iSUN 78.16 / 68.43 80.06 / 80.89
Texture 84.97 / 79.82 75.53 / 76.86
SVHN 74.05 / 71.63 84.23 / 84.54
average 68.86 / 64.06 82.67 / 83.31
VISAPP 2025 - 20th International Conference on Computer Vision Theory and Applications
24
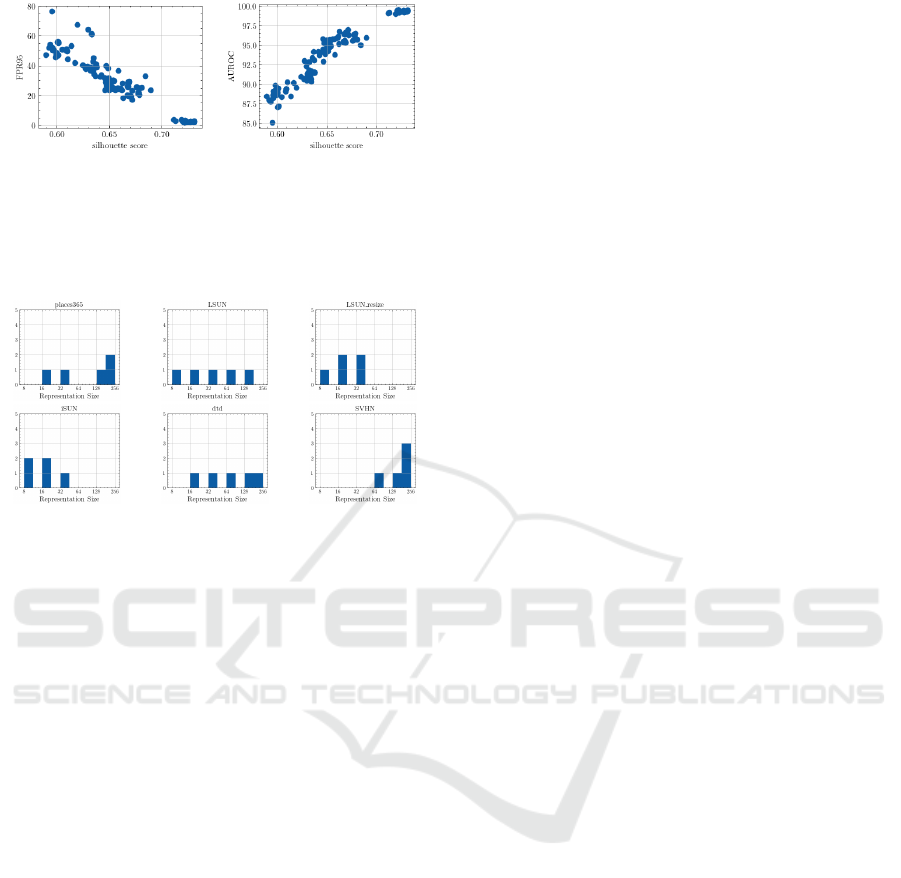
Figure 4: Scatter plots of silhouette score (x-axis) and eval-
uation metrics of OOD detection (y-axis) when ID dataset
is CIFAR-10 and Energy score is used. Smaller FPR95 val-
ues and larger AUROC indicate better performance. These
scatter plots show that an increase in the silhouette score
corresponds to an improvement in OOD detection accuracy.
Figure 5: Histogram of dimensions chosen for final OOD
score when Energy score is used. This histogram and Ta-
ble 3 show that higher dimensions are often chosen for data
with relatively low accuracy. and that lower dimensions are
often chosen for data with high accuracy.
relationship between the silhouette score (Rousseeuw,
1987) and OOD detection accuracy. These plots con-
sist of 180 points, derived from six OOD datasets,
five experimental seeds, and six sub-feature vectors
divided based on M . A smaller FPR95 (left) indi-
cates better detection accuracy and a larger AUROC
(right) indicates better detection performance. These
figures show a robust correlation between the silhou-
ette score and OOD detection accuracy. When cal-
culating the correlation coefficient with the silhouette
score, FPR95 is −0.94 and AUROC is 0.95. There-
fore, the silhouette score obtained by dividing OOD
scores into two clusters is strongly correlated with
OOD detection accuracy. This insight may also ap-
ply to other methods.
5.0.2 Optimal Dimension for OOD Detection
Task
This section examines how the suitable dimension
varies with OOD dataset. This verification uses
the Energy score, which showed improved accuracy.
Since the experiments were conducted with five dif-
ferent seeds, we compared the number of times each
dimension was selected across these five runs using
histograms (Fig 5). Higher dimensions tend to be se-
lected for data with relatively low detection accuracy
and lower dimensions tend to be selected for data with
high detection accuracy. However, this tendency is
not observed for LSUN with the highest detection ac-
curacy. This phenomenon is considered to be caused
by the lack of a significant difference in OOD detec-
tion accuracy between dimensions.
6 CONCLUSION
In this paper, we proposed an adaptive OOD detec-
tion framework with coarse-to-fine features and the
selection of its feature dimension based on the sil-
houette score. In experiments, we compared the pro-
posed method with existing methods using three OOD
score functions and found that the proposed method
achieved significant improvements in most cases. Our
analysis revealed a strong correlation between the sil-
houette score obtained by dividing OOD scores into
two clusters and OOD detection accuracy. Addition-
ally, it was found that the dimensions that are more
likely to be selected depend on the OOD dataset and
are somewhat related to the relative OOD detection
accuracy. However, for OOD scores with inherently
low detection accuracy, such as MSP, the improve-
ment in accuracy was minimal, and in some cases, a
decrease in accuracy was observed. The drawbacks
of our method are the high computational cost associ-
ated with training MRL and the long time required to
select a suitable dimension using the k-means method.
Additionally, since our method is based on the as-
sumption that there are multiple OOD data in the de-
tection target, its effectiveness may be limited when
the number of OOD data is very small. In the fu-
ture, we will address these limitations while exploring
OOD detection methods that consider the coarse-to-
fine structure unique to Matryoshka representation.
REFERENCES
Chen, J., Li, Y., Wu, X., Liang, Y., and Jha, S. (2021).
Atom: Robustifying out-of-distribution detection us-
ing outlier mining. In Machine Learning and Knowl-
edge Discovery in Databases. Research Track: Euro-
pean Conference, ECML PKDD 2021, Bilbao, Spain,
September 13–17, 2021, Proceedings, Part III 21,
pages 430–445. Springer.
Cimpoi, M., Maji, S., Kokkinos, I., Mohamed, S., and
Vedaldi, A. (2014). Describing textures in the wild.
In Proceedings of the IEEE conference on computer
vision and pattern recognition, pages 3606–3613.
DeVries, T. and Taylor, G. W. (2018). Learning confidence
for out-of-distribution detection in neural networks.
arXiv preprint arXiv:1802.04865.
Adaptive Out-of-Distribution Detection with Coarse-to-Fine Grained Representation
25

Hendrycks, D., Basart, S., Mazeika, M., Zou, A., Kwon, J.,
Mostajabi, M., Steinhardt, J., and Song, D. (2019).
Scaling out-of-distribution detection for real-world
settings. arXiv preprint arXiv:1911.11132.
Hendrycks, D. and Gimpel, K. (2016). A baseline for de-
tecting misclassified and out-of-distribution examples
in neural networks. arXiv preprint arXiv:1610.02136.
Hendrycks, D., Mazeika, M., and Dietterich, T. (2018).
Deep anomaly detection with outlier exposure. arXiv
preprint arXiv:1812.04606.
Huang, R., Geng, A., and Li, Y. (2021). On the impor-
tance of gradients for detecting distributional shifts in
the wild. Advances in Neural Information Processing
Systems, 34:677–689.
Krizhevsky, A. and Hinton, G. (2009). Learning multiple
layers of features from tiny images. Technical Re-
port 0, University of Toronto, Toronto, Ontario.
Kusupati, A., Bhatt, G., Rege, A., Wallingford, M., Sinha,
A., Ramanujan, V., Howard-Snyder, W., Chen, K.,
Kakade, S., Jain, P., et al. (2022). Matryoshka rep-
resentation learning. Advances in Neural Information
Processing Systems, 35:30233–30249.
Lee, K., Lee, K., Lee, H., and Shin, J. (2018). A simple uni-
fied framework for detecting out-of-distribution sam-
ples and adversarial attacks. Advances in neural infor-
mation processing systems, 31.
Liang, S., Li, Y., and Srikant, R. (2017). Enhancing the reli-
ability of out-of-distribution image detection in neural
networks. arXiv preprint arXiv:1706.02690.
Liu, W., Wang, X., Owens, J., and Li, Y. (2020). Energy-
based out-of-distribution detection. Advances in neu-
ral information processing systems, 33:21464–21475.
MacQueen, J. et al. (1967). Some methods for classification
and analysis of multivariate observations. In Proceed-
ings of the fifth Berkeley symposium on mathematical
statistics and probability, volume 1, pages 281–297.
Oakland, CA, USA.
Netzer, Y., Wang, T., Coates, A., Bissacco, A., Wu, B., Ng,
A. Y., et al. (2011). Reading digits in natural images
with unsupervised feature learning. In NIPS workshop
on deep learning and unsupervised feature learning,
volume 2011, page 7. Granada, Spain.
Rousseeuw, P. J. (1987). Silhouettes: a graphical aid to
the interpretation and validation of cluster analysis.
Journal of computational and applied mathematics,
20:53–65.
Wei, H., Xie, R., Cheng, H., Feng, L., An, B., and Li,
Y. (2022). Mitigating neural network overconfidence
with logit normalization. In International conference
on machine learning, pages 23631–23644. PMLR.
Xu, P., Ehinger, K. A., Zhang, Y., Finkelstein, A., Kulkarni,
S. R., and Xiao, J. (2015). Turkergaze: Crowdsourc-
ing saliency with webcam based eye tracking. arXiv
preprint arXiv:1504.06755.
Yu, F., Seff, A., Zhang, Y., Song, S., Funkhouser, T., and
Xiao, J. (2015). Lsun: Construction of a large-scale
image dataset using deep learning with humans in the
loop. arXiv preprint arXiv:1506.03365.
Zagoruyko, S. and Komodakis, N. (2016). Wide residual
networks. arXiv preprint arXiv:1605.07146.
Zhang, J., Inkawhich, N., Linderman, R., Chen, Y., and Li,
H. (2023). Mixture outlier exposure: Towards out-of-
distribution detection in fine-grained environments. In
Proceedings of the IEEE/CVF Winter Conference on
Applications of Computer Vision, pages 5531–5540.
Zhou, B., Lapedriza, A., Khosla, A., Oliva, A., and Tor-
ralba, A. (2017). Places: A 10 million image database
for scene recognition. IEEE transactions on pattern
analysis and machine intelligence, 40(6):1452–1464.
VISAPP 2025 - 20th International Conference on Computer Vision Theory and Applications
26
