
Ground Awareness in Deep Learning for Large Outdoor Point Cloud
Segmentation
Kevin Qiu
1 a
, Dimitri Bulatov
1 b
and Dorota Iwaszczuk
2 c
1
Fraunhofer IOSB Ettlingen, Gutleuthausstrasse 1, 76275 Ettlingen, Germany
2
Technical University of Darmstadt, Civil and Environmental Engineering Sciences, Darmstadt, Germany
Keywords:
Remote Sensing, RandLA-Net, DTM.
Abstract:
This paper presents an analysis of utilizing elevation data to aid outdoor point cloud semantic segmentation
through existing machine-learning networks in remote sensing, specifically in urban, built-up areas. In dense
outdoor point clouds, the receptive field of a machine learning model may be too small to accurately determine
the surroundings and context of a point. By computing Digital Terrain Models (DTMs) from the point clouds,
we extract the relative elevation feature, which is the vertical distance from the terrain to a point. RandLA-Net
is employed for efficient semantic segmentation of large-scale point clouds. We assess its performance across
three diverse outdoor datasets captured with varying sensor technologies and sensor locations. Integration of
relative elevation data leads to consistent performance improvements across all three datasets, most notably in
the Hessigheim dataset, with an increase of 3.7 percentage points in average F1 score from 72.35% to 76.01%,
by establishing long-range dependencies between ground and objects. We also explore additional local fea-
tures such as planarity, normal vectors, and 2D features, but their efficacy varied based on the characteristics
of the point cloud. Ultimately, this study underscores the important role of the non-local relative elevation
feature for semantic segmentation of point clouds in remote sensing applications.
1 INTRODUCTION
Semantic segmentation of outdoor point clouds, cap-
tured by airborne or terrestrial sensor platforms, is
an important task with use cases in urban planning,
mapping, digital twin creation, and vegetation analy-
sis. They also have applications in vehicle navigation,
infrastructure management and augmented or virtual
reality, where a precise semantic representation of
the real environment is required. Point clouds, as
opposed to 2D orthophotos or 2.5D representations,
enhance spatial understanding and allow delineation
of vertical structures. Outdoor point clouds usu-
ally cover large areas with a considerable number of
points from either LiDAR (Light Detection and Rang-
ing) sensors or computed through photogrammetry.
Therefore, segmentation methods need to be fast and
efficient. Semantic segmentation models based on
deep learning (DL) became widely used with the ad-
vancement of computer processing power and sophis-
a
https://orcid.org/0000-0003-1512-4260
b
https://orcid.org/0000-0002-0560-2591
c
https://orcid.org/0000-0002-5969-8533
ticated architectures, such as PointNet++ (Qi et al.,
2017b), KPConv (Thomas et al., 2019), or RandLA-
Net (Hu et al., 2020). However, these methods may
struggle when applied to very large and dense point
clouds. For example, differentiating a large horizon-
tal (concrete) roof from an asphalt road may require
a large receptive field and thus an exaggerated depth
and memory footprint of the neural network, result-
ing in a high computational cost. In point cloud deep
learning, the receptive field is characterized by the
number of points rather than metric distances. For
a point cloud with very high point density, this means
that the receptive field may only encompass points
within a relatively small spatial area.
One solution could lie in the integration of addi-
tional features into DL pipelines as surrogates for re-
liably large receptive fields. Fortunately, remote sens-
ing offers a few tools providing long-range context
about the vertical dimension of the environment. In
particular, elevation over ground is the difference be-
tween the vertical distance of a point with its clos-
est terrain point and is considered one of the most
crucial features for class differentiation. Since this
closest terrain point can still be arbitrarily far away
Qiu, K., Bulatov, D. and Iwaszczuk, D.
Ground Awareness in Deep Learning for Large Outdoor Point Cloud Segmentation.
DOI: 10.5220/0013101200003912
Paper published under CC license (CC BY-NC-ND 4.0)
In Proceedings of the 20th International Joint Conference on Computer Vision, Imaging and Computer Graphics Theory and Applications (VISIGRAPP 2025) - Volume 1: GRAPP, HUCAPP
and IVAPP, pages 29-38
ISBN: 978-989-758-728-3; ISSN: 2184-4321
Proceedings Copyright © 2025 by SCITEPRESS – Science and Technology Publications, Lda.
29

for large off-terrain objects, a so-called Digital Ter-
rain Model (DTM) is required, which involves eval-
uating points over large areas, leading to larger re-
ceptive fields. There are good conventional methods
for the computation of DTM, without the need for
any labeled points (Bulatov et al., 2014; Piltz et al.,
2016) while our segmantic segmentation workflow is,
of course, agnostic to the method of DTM derivation.
Further local features popular in point cloud analy-
sis, like planarity or point densities and distributions
along the z-axis, can also be derived. In DL-based im-
age processing, it has been shown that adding sensi-
ble hand-crafted features improves the overall perfor-
mance (Audebert et al., 2018). One goal of the article
is to find out which features are useful in the context
of point cloud segmentation.
We argue that RandLA-Net is an efficient network
with practical relevance in remote sensing, which can
also be easily extended with (hand-crafted) point fea-
tures. Our contributions are as follows: 1) We ex-
tend this network with the relative elevation h
r
of a
point as well as other point-based 2D and 3D local
features, whereby to calculate h
r
for airborne point
clouds, we rely on a state-of-the-art point filtering
method (Bulatov et al., 2014). 2) We demonstrate, on
three diverse datasets differing in sensor location, sen-
sor type, landscape type, etc., a consistent improve-
ment of semantic segmentation performance with the
addition of h
r
; in contrast, the additional value of the
local features varies depending on the dataset.
2 RELATED WORKS
2.1 Point Cloud Semantic Segmentation
Using DL
Convolutional neural networks were extremely suc-
cessful for the segmentation of 2D images, the reason
why some of the first approaches for 3D data seman-
tic segmentation were projection-based, like Snap-
Net (Boulch et al., 2018). Also inspired by 2D neu-
ral networks, 3D convolutions discretize the point
cloud into voxels and apply 3D kernels for convolu-
tion (Tchapmi et al., 2017).
The first network to directly operate on the points
was the pioneering framework called PointNet (Qi
et al., 2017a), using only shared Multi-Layer Percep-
trons (MLPs) to process the point features. Its succes-
sor, PointNet++ (Qi et al., 2017b), learns hierarchi-
cal local features through multiple layers and down-
sampling using Farthest Point Sampling (FPS). Point-
NeXt (Qian et al., 2022) then improves upon Point-
Net++ with a better training strategy. Other meth-
ods like KPConv (Thomas et al., 2019) use sophis-
ticated learnable kernel-point convolutions. A down-
side of all above-mentioned methods is the large pro-
cessing cost. These networks can either only handle
a small number of points at once due to high mem-
ory use or are computationally expensive, for exam-
ple due to their choice of point sampling method. The
fastest sampling method is random sampling, which
RandLA-Net (Hu et al., 2020) employs. With less
than a tenth of the parameters as KPConv, for exam-
ple, it is optimized for high point throughput and is
therefore well suited for remote sensing applications.
Even though RandLA-Net was published in 2019, no
network surpasses it in both speed and performance
on the S3DIS 6-fold segmentation task as of the re-
cent publication of PointNeXt, as shown in Table 1
in (Qian et al., 2022).
Most recently, transformer-based networks like
PCT (Guo et al., 2021) have become popular in the
research community. The basic transformer archi-
tecture calculates global attention between all input
tokens, which is immensely computationally expen-
sive. Networks like Point Transformer (Zhao et al.,
2021) improve on this by only calculating attention
between neighboring tokens, similar to SWIN Trans-
former (Liu et al., 2021) in the image domain. The
self-attention mechanisms of transformers open the
way to self-supervised methods, where the model
learns inherent features through pretext tasks from
the training data without labels. For example, Point-
MAE (Pang et al., 2022) and Point-M2AE (Zhang
et al., 2022) use point cloud reconstruction as the pre-
text task. Unfortunately, all transformer methods have
a high computational demand and do not yet have a
practical relevance in large outdoor point cloud pro-
cessing.
2.2 Elevation Data and Local Features
in Semantic Segmentation
Digital Elevation Models (DEMs) have long been
used in object detection. In the age of DL in the
2D image domain, the effect of different fusion tech-
niques of RGB and NDSM (Normalized Digital Sur-
face Model, essentially h
r
in 2D) in the semantic
segmentation of orthophotos was explored in (Qiu
et al., 2022), where the addition of NDSM and IR
information improved the performance of the U-Net
and DeepLabV3+ model; (Audebert et al., 2018)
come to a similar conclusion. In the 3D domain,
many experiments with hand-crafted feature sets have
been performed. Examples are covariance-based fea-
tures (Maas and Vosselman, 1999), fast point feature
GRAPP 2025 - 20th International Conference on Computer Graphics Theory and Applications
30

histograms (Rusu et al., 2009), or signatures of a his-
togram of orientations (Tombari et al., 2010). These
features can be subject to a conventional classifier,
such as Random Forest (Breiman, 2001), whereby
e.g., (Mongus et al., 2013) have not even learned
any thresholds, but have used 3D morphological pro-
files for detecting buildings in LiDAR point clouds.
With DL-based approaches, hand-crafted features re-
lying on local neighborhoods have been superfluous,
and therefore features exploiting non-local interac-
tions between points gained popularity. For exam-
ple, (Niemeyer et al., 2014) test different features, and
they find that the height above ground is the most
important feature in a Random Forest-based work-
flow, where the neighborhood features of a point
were also considered. However, the receptive field
in a Random Forest approach is typically smaller
than in DL, where network depth significantly in-
creases the receptive field. Furthermore, (Wu et al.,
2019) employ a multi-section plane fitting approach
to roughly extract ground points to assist segmenta-
tion of objects on the ground, whereby ground fil-
tering has been accomplished implicitly in a weakly-
supervised way, such that ground-aware features were
utilized with a suitable attention module. The au-
thors of (Yousefhussien et al., 2018) developed a
network based on PointNet that consumes terrain-
normalized points along with spectral information.
In (Jiang et al., 2022), the ground is detected using a
point-based FCN, and a ground aware attention mod-
ule was added to the segmentation model. In (Liu
et al., 2023), RandLA-Net is trained with additional
remote sensing features. On a LiDAR dataset col-
ored with RGB information, the addition of a sur-
face normal feature brings a slight improvement in
overall mIoU (mean Intersection over Union). The
authors of (Mitschke et al., 2022) use RandLA-Net
in a hyperspectral urban dataset, where the spectral
bands are reduced to an input dimension of 64 us-
ing PCA. Due to its efficient handling of large point
clouds, RandLA-Net is popular in remote sensing
(Chen et al., 2022; Grilli et al., 2023; Mei et al.,
2024).
3 METHODOLOGY
3.1 Preliminaries: RandLA-Net
According to (Qian et al., 2022), RandLA-Net
outperforms competing procedures, such as KP-
Conv (Thomas et al., 2019), PointNet++ (Qi et al.,
2017b), PointNeXt (Qian et al., 2022), its successor,
and Point Transformer (Guo et al., 2021) regarding
the trade-off between accuracy, efficiency, and mem-
ory requirements. Even the most recently published
PTv3 (Wu et al., 2024) has over 46M parameters, re-
quiring high-end GPUs while RandLA-Net with its
1.3M parameters is able to run on a single Nvidia
V100 GPU with only 16 GB of memory, which is our
setup. Since our point clouds are large and processing
needs to be fast and efficient, RandLA-Net is a sensi-
ble choice as the network for this paper with practical
relevance.
While we refer to (Hu et al., 2020) for an in-depth
understanding of the network architecture, we provide
here the most necessary details. RandLA-Net uses a
U-Net like structure consisting of an encoder and de-
coder, four layers each, with skip connections. In the
encoder, the number of points is sampled down and
the feature dimension of each point is increased to 512
at the final encoder layer. In the decoder, the num-
ber of points is increased back to the original point
cloud while the feature dimension is reduced to the
original eight, but with much higher semantic infor-
mation. Three fully connected layers, a dropout layer
and a softmax follow, resulting in class probabilities
for each point. The name RandLA-Net originates
from the use of Random sampling as the downsam-
pling method to discard 75% of the points after each
layer, reducing the input point size by a factor of 256
at the end of the encoder. Besides, in each encoder
layer, a so-called Local feature Aggregation module
encodes the relative positions and features of neigh-
boring points of each point using only computation-
ally efficient MLPs.
This network is able to process point features ad-
ditional to the x, y and z coordinates, like RGB values,
or those particular features described in the next sec-
tion. The features are first scaled to a dimension size
of eight using a fully connected layer and then passed
to the encoder, so the additional features barely affect
the computational complexity of the network. The
training procedure follows the original implementa-
tion with five layers, an input size of 40,000 points, a
learning rate of 1e-3 and data augmentation. We use a
PyTorch implementation by Idisia Robotics
1
, whereas
the original authors use TensorFlow.
3.2 Relative Elevation and Local
Features
In this section, we describe the additional point fea-
tures that are added to RandLA-Net to aid the seman-
tic segmentation task. We compute the relative ele-
vation h
r
and other local features that are popular in
1
https://github.com/idsia-robotics/
RandLA-Net-pytorch
Ground Awareness in Deep Learning for Large Outdoor Point Cloud Segmentation
31

traditional point cloud processing and remote sensing
methods.
For h
r
, we first need to derive the Digital Sur-
face Model (DSM) and DTM. The DSM is calculated
by sampling the 3D points into a rectangular, equal-
spaced 2D grid of a suitable resolution. Each grid cell,
or pixel p, therefore defines a neighborhood U (p) of
3D points. The height value for the DSM of each pixel
is determined as the mean z-value of the at most n = 4
highest points within U. This is to avoid random se-
lection of height values at vertical surfaces, like walls,
and to reduce noise. Because U (p) may be empty, in-
painting is done using the heat equation.
The derivation of DTMs is challenging for noisy
point clouds with different types of objects. There are
nowadays efficient DL-based approaches allowing to
deal with difficult terrains (Gevaert et al., 2018), how-
ever, they usually need some reference data, which
was not available in our case. Thus, we apply a two-
step procedure of (Bulatov et al., 2014) to the DSM,
which we briefly describe in what follows. First,
we identify ground points by considering the circular
neighborhood and applying a minimum filter. The fil-
ter size should have an order of magnitude that corre-
sponds to the size of the largest off-terrain region, for
example, the largest building, to ensure that at least
one ground point is within the filter. If it is too small,
points of a building can be spuriously included into
the list of ground points, and if it is too large, smaller
hills and other elevated regions of the DTM may get
lost. Here, some too-large buildings may be interac-
tively masked out. In spite of this, this approach may
have problems in densely built-up regions and also
when there is a high percentage of outliers in the ele-
vation map. As a consequence, the functional that ap-
proximates the ground points should be robust against
outliers in the data. We chose the 2.5D cubic spline
surface computed by minimization of a functional as
in (Bulatov and Lavery, 2010) in the L
1
-norm:
L(z) = (1 − λ)
M
∑
m=1
|
z(x
m
, y
m
) − z
m
|
+
+λ
Z
x,y
(
|
z
xx
|
+ 2
|
z
xy
|
+
|
z
yy
|
)dxdy+
ε
∑
nodes
(
|
z
x
|
+
|
z
y
|
),
(1)
where {(x
m
, y
m
, z
m
)}
M
m=1
are the coordinates of the
ground points, z = z(x, y) is the function value of the
point (x, y) for a Sibson-element of a cubic spline,
λ ≈ 0.7 is a data fidelity parameter, and ε is a small
positive scalar, supposed to guarantee numerical sta-
bility. The DTM value for each pixel p is given by the
spline parameters. The difference between the z coor-
dinate of a point and the DTM of the corresponding
pixel yields its relative elevation h
r
.
Table 1: Description of the point-wise input features for
RandLA-Net that are utilized in this paper. Abbreviations:
NNs = Nearest neighbors, NV = Normal Vector, Feat. =
Feature, ?D = Dimensionality.
Feat. Description ?D
color RGB information 3D
h
r
Rel. height above the terrain 3D
η
Planarity calculated using cova-
riance matrix of 10 NNs
3D
n
z
Absolute value of NV
z
computed over 100 NNs
3D
σ(z) Variance of the points in U 2D
ν Number of points in U 2D
Using the same neighborhood U, the number of
points per pixel ν and the variance of their elevations
σ(z) are determined. These local features are calcu-
lated in the 2D plane and assigned to every point in
U.
Planarity η and normals n
z
are derived directly
from the point cloud. From K nearest neighbors of ev-
ery point, we compute the structure tensor. Its eigen-
values λ
1
, λ
2
, λ
3
, sorted in descending order, and the
corresponding eigenvectors v
1
, v
2
, v
3
are used to cal-
culate
η =
λ
2
− λ
3
λ
1
, n
z
= (v
3
)
z
, (2)
as well as a few other measures (omnivariance, linear-
ity, etc.) mentioned in the implementation of (Wein-
mann et al., 2015). We chose η and n
z
in (2) because
planarity turned out to be the most distinctive mea-
sure in many publications (Weinmann et al., 2017),
among others, while the normal vector direction is
not directly coupled to the eigenvalues. Note that
we decided to make this feature invariant with re-
spect to rotations around the xy-plane and modulo
π around z-axis. All 3D features are calculated on
the full point clouds without any downsampling such
as grid sampling. Due to the extreme irregularity of
the point cloud in the terrestrial Toronto3D dataset
(see next section), especially in regions further away
from the sensor path, we decided not to use our two-
step method for DTM computation. Instead, a sim-
ple RANSAC algorithm was used to find the ground
plane of each of the four tiles. The resulting elevation
data is not as accurate as in the other datasets, since
the ground is not perfectly flat.
Figure 1 shows the 2D features ν and σ(z) as well
as the steps needed to calculate the relative elevation
information on a tile of the Swiss3DCities dataset.
The number-of-points feature in Fig. 1b, for example,
has high values at building walls and tall vegetation,
where many points are stacked in the z-direction. Ta-
ble 1 shows all features that are used in this paper to
aid semantic segmentation.
GRAPP 2025 - 20th International Conference on Computer Graphics Theory and Applications
32
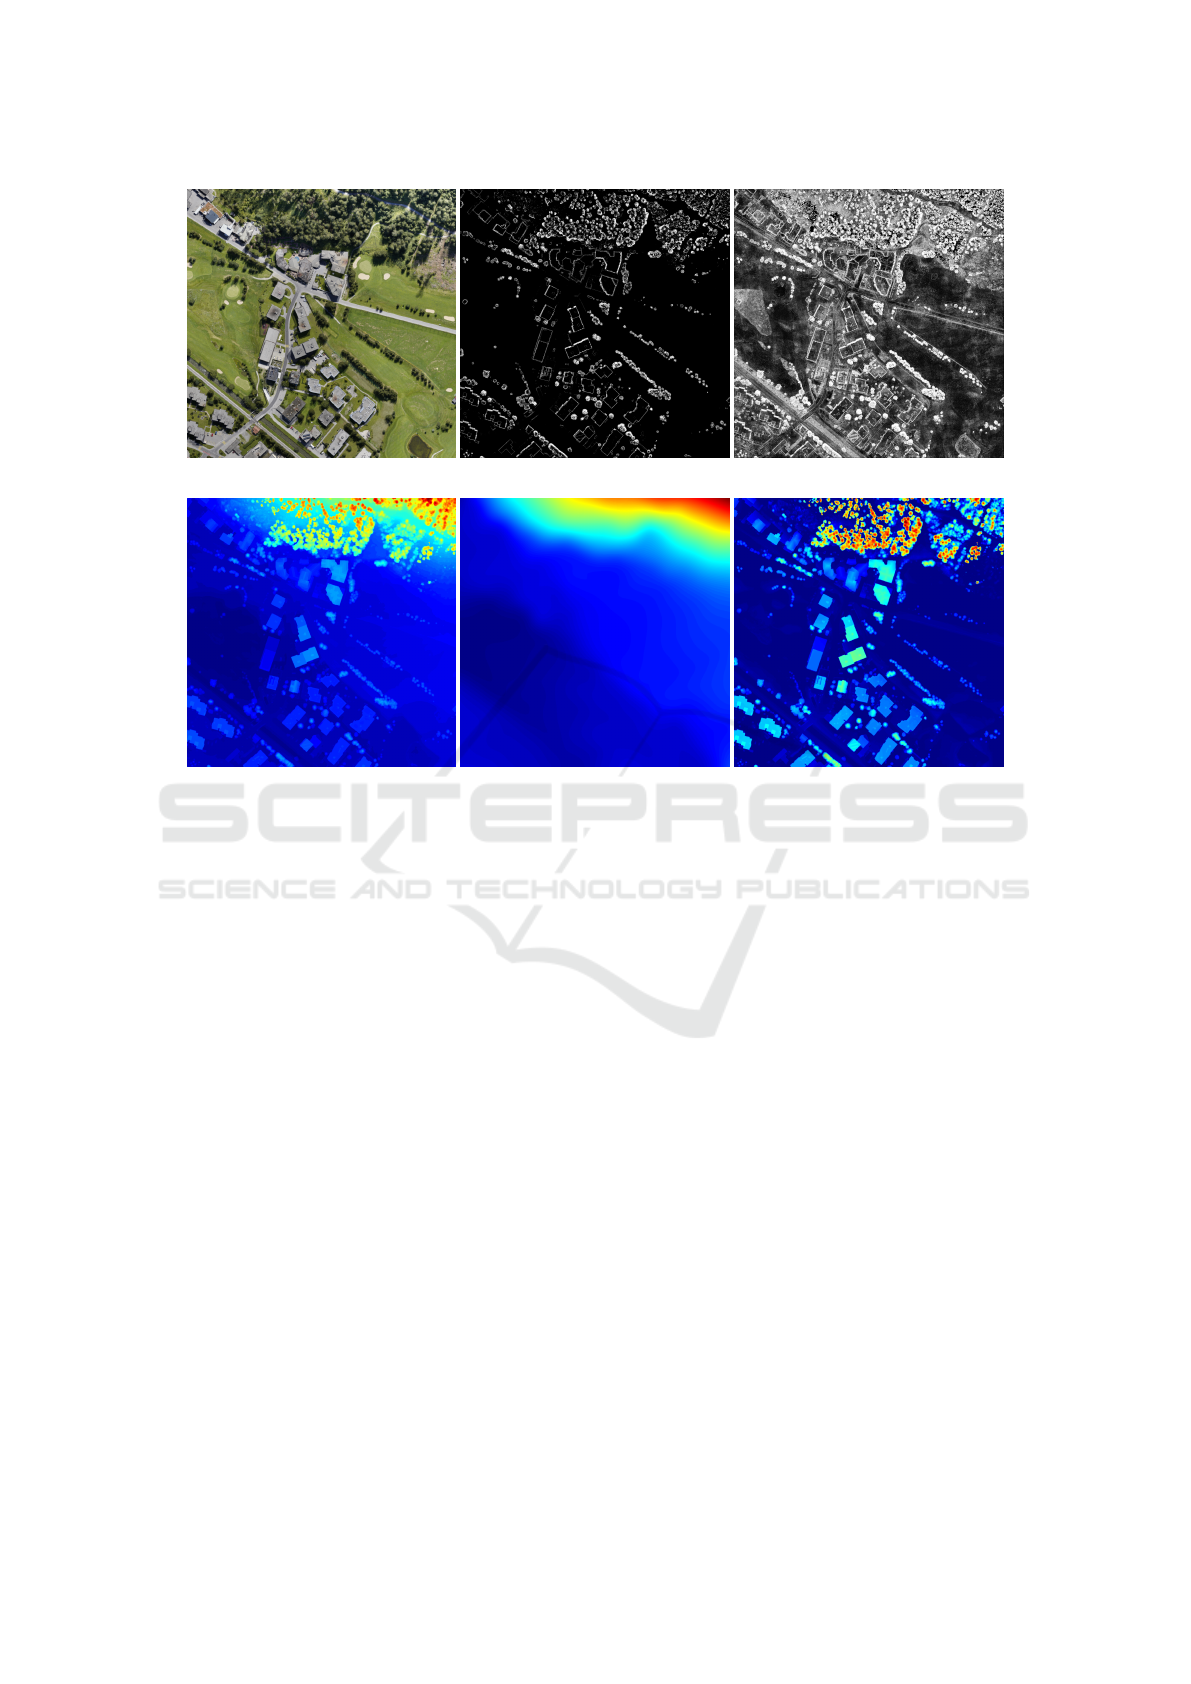
(a) Orthoprojection (b) ν (c) σ(z)
(d) DSM (e) DTM (f) Normalized DSM
Figure 1: View of the orthoprojection, DSM, DTM, NDSM, and 2D features (number of points ν and variance of the points
σ(z) in a “pixel” of an 2D grid) of the fifth Davos tile of the Swiss2DCities dataset. The Normalized DSM, or NDSM, is
two-dimensional and calculated by subtracting the DTM from the DSM.
4 DATASETS
A diverse selection of datasets, listed in Table 2,
were chosen for comprehensive analysis. Different
capturing techniques, e.g. LiDAR vs. Photogramme-
try, and sensor location, e.g. aerial or terrestrial, yield
very different point configurations.
Swiss3DCities (Can et al., 2021) is an UAV-based
dataset, covering a total area of 2.7 km
2
from three
different Swiss cities with a ground sampling dis-
tance (GSD) of 1.28 cm. The high-resolution point
clouds were derived photogrammetrically and labeled
into five classes. The authors emphasize uniform den-
sity and completeness, including on vertical surfaces,
through oblique captures. We use the “medium” den-
sity point clouds and only the five tiles from the city of
Davos to speed up the training time. For validation,
we use the fifth Davos tile, which consists of about
12.5M points.
The Hessigheim dataset (K
¨
olle et al., 2021) is an
airborne RGB LiDAR dataset of the city Hessigheim
in Germany, with a GSD of 2 cm to 3 cm. The point
density is about 800 points per square meter, but is
quite heterogeneous along the vertical dimension. We
chose the most popular March 2018 capture and cal-
culated the local features using the same parameters
as in Swiss3DCities. The dataset consists of a train,
validation, and test set, but the labels for the latter are
not publicly available, requiring submission for eval-
uation of the approximately 52M points.
The Toronto3D dataset (Tan et al., 2020) is also
captured using LiDAR. However, the sensor was
mounted on a driving vehicle, resulting in large den-
sity variations due to vastly different distances from
the car to the scene. The LiDAR and RGB camera
scans along a 1 km stretch of road are merged, re-
sulting in even more density variation due to varying
speed of the vehicle. The authors deliberately kept all
points of the entire approximately 100 m scan radius
to mimic real life point clouds. The dataset is divided
into four tiles, with the second tile used as validation,
as was instructed by (Tan et al., 2020).
Ground Awareness in Deep Learning for Large Outdoor Point Cloud Segmentation
33

Table 2: Comparison of the three outdoor point cloud datasets used in this paper.
Dataset Platform Sensor #Points Classes Year
Swiss3DCities Air- Photogram-
67.7M 5 2020
Davos borne metric
Hessigheim Air- Riegl VUX-1LR
125.7M 11 2021
March 2018 borne LiDAR
Toronto3D Vehicle Teledyne Optech
78.3M 8 2020
March 2018 MMLS Maverick LiDAR
5 RESULTS
In the Davos subset of the Swiss3DCities dataset, as
shown in Table 3, the addition of the relative informa-
tion h
r
feature significantly improves the mIoU from
66.70% with just color features to 69.81%. This jump
is larger than after the addition of color features to
the configuration containing point coordinates only.
Adding elevation and all local features improves the
results even more, to an mIoU of 71.20%. The largest
jump in IoU score can be seen in the small urban as-
set class, with the terrain class not far behind. Fig-
ure 2 shows the qualitative results along with the RGB
point cloud and ground truth. The “all” configura-
tion, using all features listed in Tab 1, in Fig. 2d
shows fewer artifacts, mostly of the urban asset class
(red), than the “color” configuration in Fig. 2c, mak-
ing most other classes like building (blue) and vegeta-
tion (green) more accurate. It should be noted that the
ground truth data provided may not be entirely accu-
rate or comprehensive, partially due to inherent ambi-
guities. For instance, certain objects such as hedges,
man-made structures like walls or entrances to under-
ground parking facilities have been mislabeled as ter-
rain. These areas are however predicted as either ur-
ban asset or building, like in the bottom right corner
of the Figures.
As shown in Table 4, three variations on the Hes-
sigheim dataset were submitted and evaluated. First,
to establish the baseline, a model with just color was
trained, reaching an average F1 score of 72.35%.
Adding relative elevation, the average F1 score im-
proves substantially by almost 4 pp. to 76.01%.
The largest improvements with relative elevation are
the shrub, gravel, and vertical surface class. All of
these classes benefit from the elevation information,
shrubs for example can be better distinguished from
the ground and tree. Most other classes improve as
well. It should be noted that the improvement of large
classes, like of buildings, trees, and the ground, in the
Hessigheim dataset as well as in the Swiss3DCities
dataset, will be less pronounced. This is because the
improvements mainly affect the challenging ambigu-
ous points, which represent a small fraction in large
classes and thus have limited influence on the overall
score. Adding both elevation and local features, how-
ever, degrades the performance of the network, but
it is still better in terms of mF1 than the color only
configuration. This is attributed to the fact that the
point density, especially on vertical surfaces, is very
heterogeneous in the Hessigheim dataset due to more
down facing LiDAR scan sweeps, whereas the pho-
togrammetric Swiss3DCities dataset has a quite ho-
mogeneous point cloud. This makes features like ν or
σ(z) inconsistent. Furthermore, hand-crafted features
require setting parameters like the number of neigh-
bors, for which sensible choices may differ between
datasets.
Figure 3 shows the qualitative results of the base-
line “color” and “color+h
r
” configuration, along with
the RGB input point cloud. Since this is the test set, a
ground truth cannot be shown. The detection of roofs
(red) with relative elevation in Figure 3c is slightly
improved, showing less confusion with the urban fur-
niture class (purple). Facades (orange) are also less
confused with the vertical surface class (yellow). The
uneven point density is apparent in the figures, where
individual LiDAR sweeps can be seen on the verti-
cal surfaces as well as occluded areas like underneath
protruding roofs.
On the last dataset, Toronto3D, relative elevation
brings a small improvement, as seen in Table 5, where
the mIoU jumps over 0.5 pp. to 72.10%. The small
improvement could be explained by the relative ele-
vation not being fully accurate due to the RANSAC
approximation. The addition of local features, how-
ever, severely degrades the performance, making it
worse than the color configuration. One reasonable
explanation is that the features are calculated on the
full point cloud, where the point density varies wildly,
while for RandLA-Net the points and features are first
grid sampled (grid size 6 cm, just like the original au-
thors of RandLA-Net did). The downsampling also
increases the receptive field in terms of metric dis-
tance, since the point density is drastically reduced,
making h
r
less impactful. No downsampling was ap-
GRAPP 2025 - 20th International Conference on Computer Graphics Theory and Applications
34
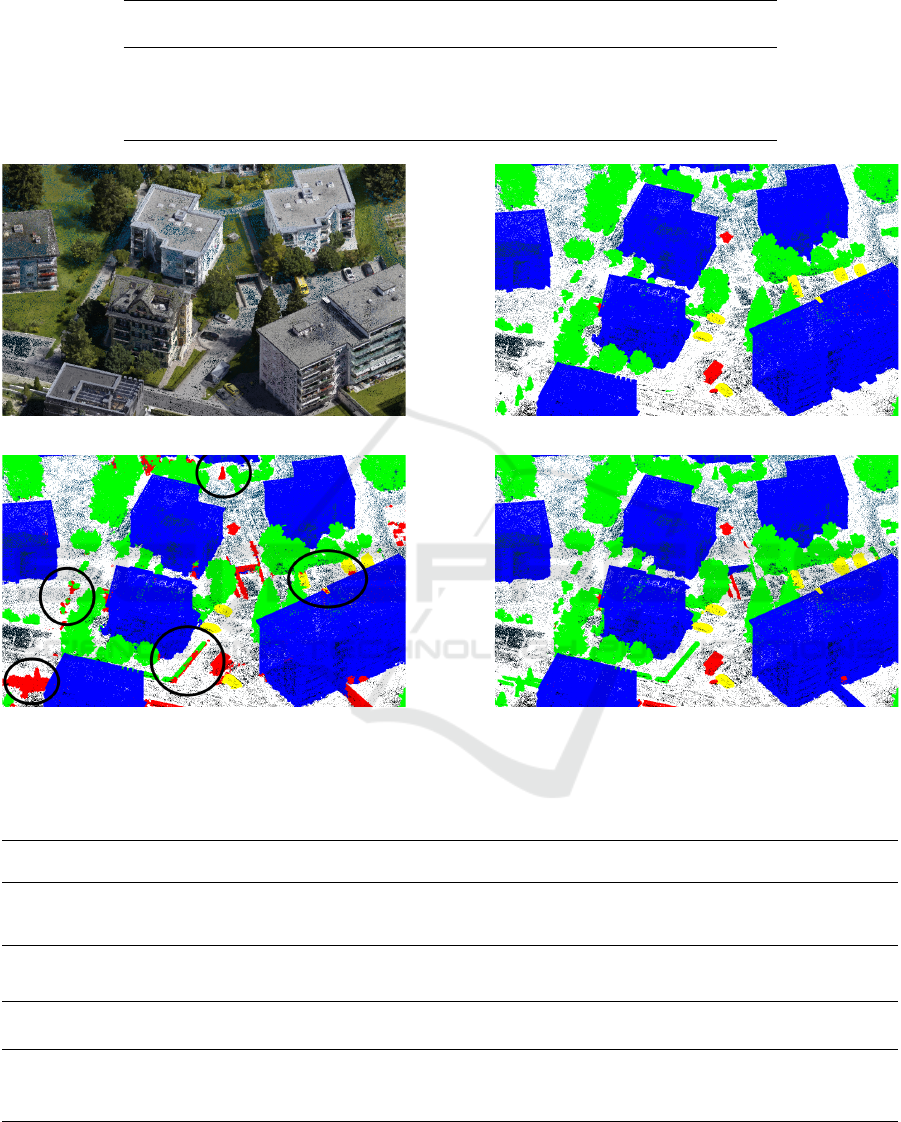
Table 3: Performance of RandLA-Net with different feature configurations on the Davos subset validation tile of the
Swiss3DCities dataset. The first configuration only uses the xyz point coordinates.
Features
OA
Mean
IoU
IoU
terrain
IoU
constr.
IoU
urban a.
IoU
veget.
IoU
vehicle
- 91.77 66.23 86.54 81.55 17.24 92.43 53.51
color 91.31 66.70 84.76 82.17 16.49 92.17 57.91
color+h
r
93.08 69.81 87.95 83.17 25.30 94.13 58.50
all 93.31 71.20 88.06 85.19 32.30 93.40 57.15
(a) RGB (b) Ground truth
(c) Prediction “color” (d) Prediction “all”
Figure 2: The results on the fifth Davos validation tile of the Swiss3DCities dataset, with predictions of two configurations
and corresponding ground truth. Some errors in Fig. 2c that are not present in Fig. 2d are circled in black.
Table 4: Performance of RandLA-Net with different input features on the Hessigheim March 2018 test set.
Feat. OA mF1
F1 L.
Veg.
F1 I.
Surf.
F1
Car
F1 U.
Furn.
F1
Roof
F1
Fac.
F1
Shr.
F1
Tree
F1
Grav.
F1 V.
Surf.
F1
Chi.
color 86.00 72.35 91.53 86.88 61.78 50.64 94.72 79.07 56.75 96.45 30.06 69.30 88.68
color+h
r
87.67 76.01 92.40 87.52 55.61 49.63 96.52 79.09 64.84 96.76 45.86 78.47 89.42
all 85.24 74.62 90.17 84.11 60.56 49.74 94.63 79.57 63.93 95.70 40.67 72.34 89.42
Table 5: Performance of RandLA-Net on the Toronto 3D L002 validation tile.
Feat. OA
Mean
IoU
IoU
uncl.
IoU
road
IoU
r. ma.
IoU
natu.
IoU
build.
IoU
ut. l.
IoU
pole
IoU
car
IoU
fence
color 92.80 71.52 41.47 92.30 56.23 91.95 88.67 83.88 78.37 87.97 22.84
color+h
r
93.43 72.10 44.52 93.35 62.32 92.67 89.81 84.84 73.73 86.10 21.60
all 90.26 61.66 19.58 90.11 17.78 89.25 81.17 81.01 69.44 84.79 21.78
plied to the other datasets for training or evaluation.
Another reason is that the strong density variation and
occlusion effects make less useful features, especially
the 2D features like ν or σ(z). Density variations are
Ground Awareness in Deep Learning for Large Outdoor Point Cloud Segmentation
35
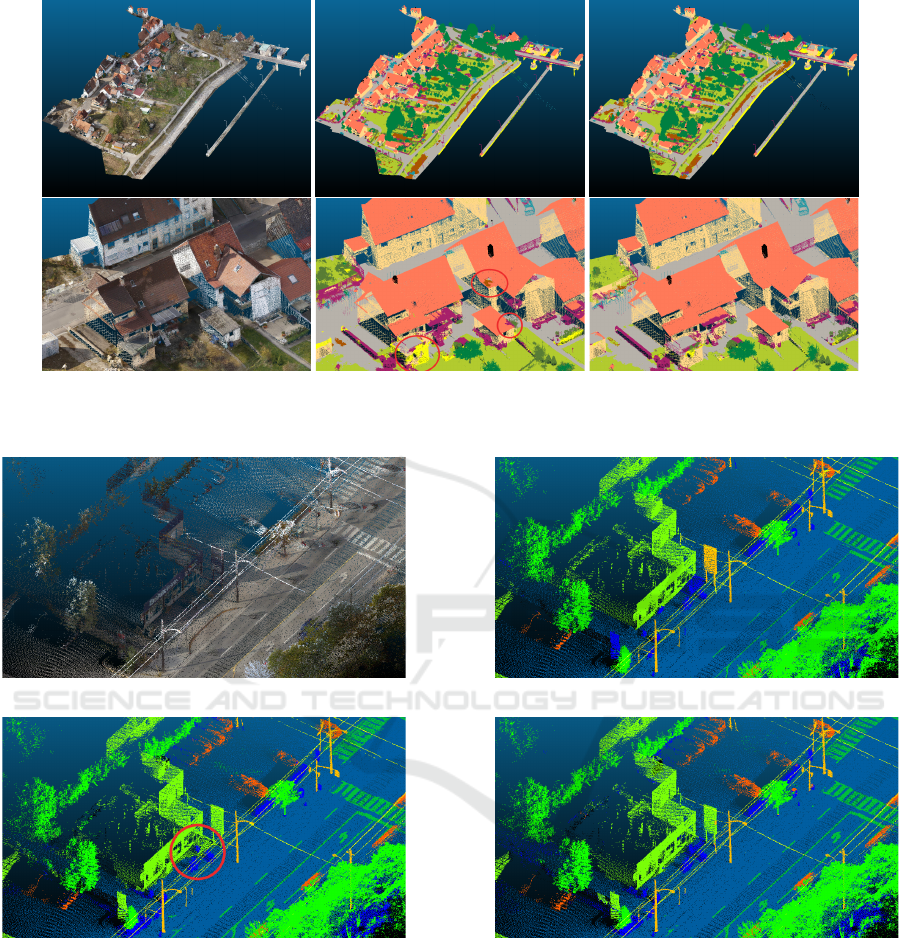
(a) RGB (b) Pred. “color” (c) Pred. “color+h
r
”
Figure 3: The test set of the Hessigheim March 2018 capture and predictions with different configurations in its entirety, and
a zoomed in area. Errors in Fig. 3b are circled in red. Ground truth is not publicly available.
(a) RGB (b) Ground truth
(c) Prediction “color” (d) Prediction “color+h
r
”
Figure 4: A zoomed in area of the Toronto3D L002 validation tile with the predictions of two configurations and ground truth.
The tile has been downsampled using grid sampling. An error in Fig. 4c is circled in red.
also caused by the distance from the vehicle and ve-
hicle speed, both of which are not correlated to useful
information for semantic segmentation. Note that the
results of Toronto3D on vanilla RandLA-Net do not
reach the mIoU of the original authors. This may be
due to weaker hardware or a different implementation
of RandLA-Net. The RGB point cloud, ground truth
and qualitative results are shown in Fig. 4. Small im-
provements can be seen in the delineation of road and
ground. The point density is, of course, highest along
the road, where the vehicle was driven.
6 CONCLUSION AND OUTLOOK
With 3D outdoor point clouds, it is relatively straight-
forward to compute a Digital Terrain Model, or DTM,
using well established methods. Then, the relative el-
GRAPP 2025 - 20th International Conference on Computer Graphics Theory and Applications
36

evation of individual points of the point cloud with re-
spect to the ground surface can be determined. A con-
sistent and large improvement in semantic segmen-
tation accuracy of aerial point clouds is achieved by
integrating this relative elevation information into an
existing deep learning network, such as RandLA-Net,
without needing to modify its architecture. This ap-
proach renders the source or method of DTM deriva-
tion irrelevant. It could utilize traditional numerical
methods, DL techniques, or even DTMs from pub-
licly available government data sources. The addi-
tion of the relative elevation feature ensures ground
awareness through a long-range dependency between
ground and object points, especially in cases where
the receptive field does not capture the terrain. In
the Hessigheim dataset, the addition of the eleva-
tion information increases the mF1 from 72.35% to
76.01%, and in the Swiss3DCities dataset the mIoU
from 66.70% to 69.81%. Other local features are
less reliably beneficial. Using these local features can
even degrade network performance in more datasets
with more inhomogeneous point distributions, like in
both LiDAR datasets of Hessigheim and Toronto3D.
There are two main reasons for this, which contrast
the relative elevation: 1) The local features depend on
the structure of the point cloud 2) they are quite local-
ized and easily captured by the receptive field of the
network.
It is therefore advisable to incorporate relative el-
evation information into classification and segmenta-
tion tasks in large outdoor point clouds, which are
typical for remote sensing, whenever feasible. This
recommendation holds not only for 2D scenarios, as
demonstrated in (Qiu et al., 2022) and (Audebert
et al., 2018), but also for 3D point cloud segmentation
tasks using modern deep learning networks, as evi-
denced by the findings presented in this paper, even
though the input point cloud already implicitly con-
tains the information necessary to derive the DTM.
The effect of relative elevation could be even more
apparent in datasets with larger or taller buildings and
higher resolution.
The prevailing direction in Computer Vision in-
volves shifting towards methods that require fewer
or even no annotated labels at all, as the process of
labeling is often prohibitively expensive. In future
work, we therefore may integrate elevation features
into other point cloud segmentation models and even
explore their effect on self-supervision tasks and in
transformer models.
REFERENCES
Audebert, N., Le Saux, B., and Lef
`
evre, S. (2018). Beyond
rgb: Very high resolution urban remote sensing with
multimodal deep networks. ISPRS Journal of Pho-
togrammetry and Remote Sensing, 140:20–32.
Boulch, A., Guerry, J., Le Saux, B., and Audebert, N.
(2018). SnapNet: 3D point cloud semantic labeling
with 2D deep segmentation networks. Computers &
Graphics, 71:189–198.
Breiman, L. (2001). Random forests. Machine learning,
45:5–32.
Bulatov, D., H
¨
aufel, G., Meidow, J., Pohl, M., Solbrig, P.,
and Wernerus, P. (2014). Context-based automatic
reconstruction and texturing of 3D urban terrain for
quick-response tasks. ISPRS J. of Photogrammetry
and Remote Sensing, 93:157–170.
Bulatov, D. and Lavery, J. E. (2010). Reconstruction
and texturing of 3D urban terrain from uncalibrated
monocular images using L
1
splines. Photogrammet-
ric Engineering and Remote Sensing, 76(4):439–449.
Can, G., Mantegazza, D., Abbate, G., Chappuis, S.,
and Giusti, A. (2021). Semantic segmentation on
Swiss3DCities: A benchmark study on aerial pho-
togrammetric 3D pointcloud dataset. Pattern Recog-
nition Letters, 150:108–114.
Chen, J., Zhao, Y., Meng, C., and Liu, Y. (2022). Multi-
feature aggregation for semantic segmentation of an
urban scene point cloud. Remote Sensing, 14(20).
Gevaert, C., Persello, C., Nex, F., and Vosselman, G.
(2018). A deep learning approach to DTM extraction
from imagery using rule-based training labels. ISPRS
J. of Photogrammetry and Remote Sensing, 142:106–
123.
Grilli, E., Daniele, A., Bassier, M., Remondino, F., and
Serafini, L. (2023). Knowledge enhanced neural net-
works for point cloud semantic segmentation. Remote
Sensing, 15(10).
Guo, M.-H., Cai, J.-X., Liu, Z.-N., Mu, T.-J., Martin, R. R.,
and Hu, S.-M. (2021). Pct: Point cloud transformer.
Computational Visual Media, 7:187–199.
Hu, Q., Yang, B., Xie, L., Rosa, S., Guo, Y., Wang, Z.,
Trigoni, N., and Markham, A. (2020). Randla-net:
Efficient semantic segmentation of large-scale point
clouds. In Proceedings of the IEEE/CVF Conference
on Computer Vision and Pattern Recognition, pages
11108–11117.
Jiang, T., Wang, Y., Liu, S., Cong, Y., Dai, L., and Sun,
J. (2022). Local and global structure for urban als
point cloud semantic segmentation with ground-aware
attention. IEEE Transactions on Geoscience and Re-
mote Sensing, 60:1–15.
K
¨
olle, M., Laupheimer, D., Schmohl, S., Haala, N., Rot-
tensteiner, F., Wegner, J. D., and Ledoux, H. (2021).
The Hessigheim 3D (H3D) benchmark on semantic
segmentation of high-resolution 3D point clouds and
textured meshes from UAV LiDAR and Multi-View-
Stereo. ISPRS Open Journal of Photogrammetry and
Remote Sensing, 1:1–11.
Liu, C., Zhang, Q., Shirowzhan, S., Bai, T., Sheng, Z.,
Wu, Y., Kuang, J., and Ge, L. (2023). The influ-
ence of changing features on the accuracy of deep
Ground Awareness in Deep Learning for Large Outdoor Point Cloud Segmentation
37

learning-based large-scale outdoor lidar semantic seg-
mentation. In IEEE International Geoscience and
Remote Sensing Symposium (IGARSS), pages 4443–
4446. IEEE.
Liu, Z., Lin, Y., Cao, Y., Hu, H., Wei, Y., Zhang, Z., Lin,
S., and Guo, B. (2021). Swin transformer: Hierarchi-
cal vision transformer using shifted windows. In Pro-
ceedings of the IEEE/CVF International Conference
on Computer Vision, pages 10012–10022.
Maas, H.-G. and Vosselman, G. (1999). Two algorithms for
extracting building models from raw laser altimetry
data. ISPRS Journal of Photogrammetry and Remote
Sensing, 54(2-3):153–163.
Mei, Q., Qiu, K., Bulatov, D., and Iwaszczuk, D. (2024).
Improving deep learning based point cloud classifi-
cation using Markov Random Fields with Quadratic
Pseudo-Boolean Optimization. ISPRS Annals of Pho-
togrammetry, Remote Sensing & Spatial Information
Sciences, 229-236.
Mitschke, I., Wiemann, T., Igelbrink, F., and Hertzberg, J.
(2022). Hyperspectral 3D point cloud segmentation
using RandLA-Net. In Proc. International Conference
on Intelligent Autonomous Systems (IAS-17). Interna-
tional Conference on Intelligent Autonomous Systems.
IAS.
Mongus, D., Luka
ˇ
c, N., Obrul, D., and
ˇ
Zalik, B. (2013).
Detection of planar points for building extraction from
LiDAR data based on differential morphological and
attribute profiles. ISPRS Annals of the Photogramme-
try, Remote Sensing and Spatial Information Sciences,
2:21–26.
Niemeyer, J., Rottensteiner, F., and Soergel, U. (2014).
Contextual classification of lidar data and building ob-
ject detection in urban areas. ISPRS Journal of Pho-
togrammetry and Remote Sensing, 87:152–165.
Pang, Y., Wang, W., Tay, F. E., Liu, W., Tian, Y., and
Yuan, L. (2022). Masked autoencoders for point cloud
self-supervised learning. In Proceedings of the Euro-
pean Conference on Computer Vision, pages 604–621.
Springer.
Piltz, B., Bayer, S., and Poznanska, A.-M. (2016). Vol-
ume based DTM generation from very high resolution
photogrammetric DSMs. The International Archives
of the Photogrammetry, Remote Sensing and Spatial
Information Sciences, 41:83–90.
Qi, C. R., Su, H., Mo, K., and Guibas, L. J. (2017a). Point-
net: Deep learning on point sets for 3d classification
and segmentation. In Proceedings of the IEEE Con-
ference on Computer Vision and Pattern Recognition,
pages 652–660.
Qi, C. R., Yi, L., Su, H., and Guibas, L. J. (2017b). Point-
net++: Deep hierarchical feature learning on point sets
in a metric space. Advances in neural information pro-
cessing systems, 30.
Qian, G., Li, Y., Peng, H., Mai, J., Hammoud, H., Elho-
seiny, M., and Ghanem, B. (2022). Pointnext: Revis-
iting pointnet++ with improved training and scaling
strategies. Advances in Neural Information Process-
ing Systems, 35:23192–23204.
Qiu, K., Budde, L. E., Bulatov, D., and Iwaszczuk, D.
(2022). Exploring fusion techniques in U-Net and
DeepLab V3 architectures for multi-modal land cover
classification. In Earth Resources and Environmen-
tal Remote Sensing/GIS Applications XIII (SPIE), vol-
ume 12268, pages 190–200. SPIE.
Rusu, R. B., Blodow, N., and Beetz, M. (2009). Fast point
feature histograms (FPFH) for 3D registration. In
IEEE International Conference on Robotics and Au-
tomation, pages 3212–3217. IEEE.
Tan, W., Qin, N., Ma, L., Li, Y., Du, J., Cai, G., Yang,
K., and Li, J. (2020). Toronto-3D: A large-scale mo-
bile LiDAR dataset for semantic segmentation of ur-
ban roadways. In Proceedings of the IEEE/CVF Con-
ference on Computer Vision and Pattern Recognition
Workshops, pages 202–203.
Tchapmi, L., Choy, C., Armeni, I., Gwak, J., and Savarese,
S. (2017). Segcloud: Semantic segmentation of 3d
point clouds. In International Conference on 3D Vi-
sion (3DV), pages 537–547. IEEE.
Thomas, H., Qi, C. R., Deschaud, J.-E., Marcotegui, B.,
Goulette, F., and Guibas, L. J. (2019). Kpconv: Flex-
ible and deformable convolution for point clouds. In
Proceedings of the IEEE/CVF International Confer-
ence on Computer Vision, pages 6411–6420.
Tombari, F., Salti, S., and Di Stefano, L. (2010). Unique
signatures of histograms for local surface description.
In European Conference on Computer Vision, pages
356–369. Springer.
Weinmann, M., Jutzi, B., Hinz, S., and Mallet, C. (2015).
Semantic point cloud interpretation based on optimal
neighborhoods, relevant features and efficient classi-
fiers. ISPRS Journal of Photogrammetry and Remote
Sensing, 105:286–304.
Weinmann, M., Jutzi, B., and Mallet, C. (2017). Geomet-
ric features and their relevance for 3D point cloud
classification. ISPRS Annals of the Photogramme-
try, Remote Sensing and Spatial Information Sciences,
4:157–164.
Wu, J., Jiao, J., Yang, Q., Zha, Z.-J., and Chen, X. (2019).
Ground-aware point cloud semantic segmentation for
autonomous driving. In Proceedings of the 27th ACM
International Conference on Multimedia, pages 971–
979.
Wu, X., Jiang, L., Wang, P.-S., Liu, Z., Liu, X., Qiao, Y.,
Ouyang, W., He, T., and Zhao, H. (2024). Point trans-
former v3: Simpler faster stronger. In Proceedings
of the IEEE/CVF Conference on Computer Vision and
Pattern Recognition, pages 4840–4851.
Yousefhussien, M., Kelbe, D. J., Ientilucci, E. J., and Sal-
vaggio, C. (2018). A multi-scale fully convolutional
network for semantic labeling of 3D point clouds. IS-
PRS Journal of Photogrammetry and Remote Sensing,
143:191–204. ISPRS Journal of Photogrammetry and
Remote Sensing Theme Issue “Point Cloud Process-
ing”.
Zhang, R., Guo, Z., Gao, P., Fang, R., Zhao, B., Wang, D.,
Qiao, Y., and Li, H. (2022). Point-m2ae: multi-scale
masked autoencoders for hierarchical point cloud pre-
training. Advances in Neural Information Processing
Systems, 35:27061–27074.
Zhao, H., Jiang, L., Jia, J., Torr, P. H., and Koltun, V. (2021).
Point transformer. In Proceedings of the IEEE/CVF
International Conference on Computer Vision, pages
16259–16268.
GRAPP 2025 - 20th International Conference on Computer Graphics Theory and Applications
38
