
Changes in Attention Levels While Driving a Car Estimated Using
Modelling Techniques with Features of Oculo-Motors
Minoru Nakayama
1 a
, Qian (Chayn) Sun
2 b
and Jianhong (Cecilia) Xia
3 c
1
Institute of Science Tokyo (Tokyo Tech.), O-okayama, Meguro-ku, Tokyo, 152–8552, Japan
2
RMIT University, Melborune, VIC 3000, Australia
3
Curtin University, Perth, WA 6102, Australia
Keywords:
Car Driving, Attention, Eye Movement, Pupil, Mental Workload, Modelling.
Abstract:
Changes in attention levels while driving a car were estimated using a modelling technique involving pupillary
changes and the frequency of saccades of 11 drivers. The driving route used in the experiment consisted of 19
sections of road divided into 5 groups: university campus, left turn, straight, right turn, and roundabout. The
sections of road with posted speed limits were divided into 6 conditional states, and model parameters were
estimated by assuming transitions across the states. The estimated model parameters were used to examine
changes in the level of attention resources used during each section of driving. The results of a comparison of
attention resources by section showed a significant decrease, in the following order: straight and roundabout,
within campus, left turn and right turn. In addition, the relationship between NASA-TLX was evaluated after
driving and attention resources were examined, and a significant correlation with the factor for “difficulty”
was confirmed. The relationship between the confidence interval of the change in attention resources and the
factor for “mental demand” was also confirmed.
1 INTRODUCTION
Eye movements of drivers and human visual acu-
ity have been studied in order to improve the safety
of motor vehicle operation (Kapitaniak et al., 2015;
Paeglis et al., 2011; Schmitt et al., 2015; Yamani
et al., 2016). A detailed analysis of images viewed
during driving has also been developed in order to un-
derstand driving behaviour (Palazzi et al., 2019; Hu
et al., 2022). Currently, safety aspects of various in-
telligent vehicles designs which use autonomous driv-
ing systems are frequent points of discussion (Deng
et al., 2020). While human behavioural factors dur-
ing motor vehicle operation may show possible prob-
lems, they can be used to better optimise safe driving
practices, even when autonomous operating systems
are employed. In particular, the driving behaviour
of elderly motorists should be considered when ad-
dressing the issue of safe driving. The relationship
between a driver’s workload and their driving actions
is often studied, and detailed analysis of the relation-
a
https://orcid.org/0000-0001-5563-6901
b
https://orcid.org/0000-0002-5421-5838
c
https://orcid.org/0000-0002-2593-9423
ship is limited (Sun et al., 2016a; Sun et al., 2016b;
Nakayama et al., 2022), however. Elderly motorists
may possess significant individual differences in abil-
ity to recognise workload levels, so the relationship
between their own impressions and behaviour-based
attention levels should be extracted.
The authors have introduced modelling techniques
in order to estimate the attention levels of drivers
(Nakayama et al., 2024a; Nakayama et al., 2024b),
though the notations used in the model should be up-
dated to recognise some of the behavioural factors of
some elderly motorists. In the previous study, factors
of road conditions and overall temporal changes were
still unclear. In order to emphasise these factors, the
calculation model for attention levels should be im-
proved.
This paper shows the features of some model pa-
rameters of the experimental driving conditions using
an updated model and a state-space modelling tech-
nique.
The following topics are addressed in this paper.
1. Estimation of attention levels across segments of
driving routes using a state-space model, which is
based on measured saccade rates of eyes and pupil
sizes of individuals while driving a car.
846
Nakayama, M., Sun, Q. C. and Xia, J. C.
Changes in Attention Levels While Driving a Car Estimated Using Modelling Techniques with Features of Oculo-Motors.
DOI: 10.5220/0013101400003911
Paper published under CC license (CC BY-NC-ND 4.0)
In Proceedings of the 18th International Joint Conference on Biomedical Engineering Systems and Technologies (BIOSTEC 2025) - Volume 1, pages 846-852
ISBN: 978-989-758-731-3; ISSN: 2184-4305
Proceedings Copyright © 2025 by SCITEPRESS – Science and Technology Publications, Lda.

2. The relationship between estimated attention lev-
els and surveyed workload scores are analysed in
order to provide an overall impression of partici-
pating drivers.
2 RELATED WORKS
Eye movement has often been analysed to assess driv-
ing behaviour in various environments, in order to
support safe motor vehicle operation (Palazzi et al.,
2019; K
¨
ubler et al., 2021). In particular, dynamic
visual information processing ability depends on eye
movement behaviour while driving (Kapitaniak et al.,
2015; Paeglis et al., 2011). Driving ability and cogni-
tive performance are sometimes influenced by ageing.
Behavioural monitoring of aged drivers is necessary
to ensure safe operation of motor vehicles (Schmitt
et al., 2015; Yamani et al., 2016). Some studies have
been conducted to measure the driving speed and de-
viations in position of cars on the road using a global
positioning system (GPS) installed in cars, and mea-
surement of eye movements while driving (Sun et al.,
2015; Sun et al., 2018b). Also, route factors were dis-
cussed when considering elderly drivers, such as pay-
ing attention and perception of the situational envi-
ronment (Sun et al., 2016b; Sun et al., 2018c). Cogni-
tive performance is sometimes considered as a factor
affecting individual drivers. For elderly drivers, vi-
sual perception performance and cognitive functions
are often focused on through the use of eye track-
ing. Manoeuvre index, useful filed of view (UFOV)
and mini-mental state examination (MMSE) of indi-
vidual drivers was measured, and the contributions of
these to driving performance has been discussed (Ball
and Owsley, 1993; Wood and Owsley, 2014; Mom-
baugh and McIntyre, 1992; Adler et al., 2005). The
factors affecting eye movement during driving have
been discussed and some contributions to the evalu-
ation of individual performance have been examined
(Yamaguchi et al., 2019).
In driving situations, the cognitive workload or at-
tention payment required by drivers for safe motor
vehicle operation has also been measured and dis-
cussed. Most assessments were focused on aspects
of viewing behaviour as mention above, as measure-
ment of cognitive workload or attention level is not
easy during driving, however. The cognitive work-
load is usually measured as overall assessment using
NASA-TLX or other metrics (Hart, 2006). Change
of the cognitive workload or attention may be recog-
nised to affect behavioural reactions. Eye tracking has
been used to assess and analyse attention and view-
ing behaviour (Underwood, 2005; K
¨
ubler et al., 2021;
Table 1: Route segments.
No. Route label No. Route label
1 Straight on campus 11 Pass RoundAbout
2 Pass RoundAbout 12 TurnRight3
3 TurnLeft1 13 Straight two-lane2
4 Straight four-lane1 14 Turn RoundAbout
5 TurnLeft2 15 Straight two-lane3
6 TurnRight1 16 TurnLeft3
7 Straights 17 Straight four-lane2
8 TurnRight2 18 TurnLeft4
9 Pass RoundAbout 19 TurnRight+campus
10 Straight two-lane1
Group 1 [On-campus]:1,2,11,19; M
dur.
= 35.8sec.
Group 2 [Left-turn]:3,5,16,18; M
dur.
= 19.7sec.
Group 3 [Straight]:4,7,9,10,13,15,17; M
dur.
= 51.5sec.
Group 4 [Right-turn]:6,8,12; M
dur.
= 28.0sec.
Group 5 [Turn Roundabout]:14; M
dur.
= 31.1sec.
Hu et al., 2022). These contributions to driving ac-
tions were also extracted from the eye movements of
drivers (Nakayama et al., 2022).
Some modelling techniques can extract latent ac-
tivity such as attention level using a model hy-
pothesised for laboratory-based experiments in order
to conduct temporal change (Ueno and Nakayama,
2021; Dubiel et al., 2023). This technique can be
applied to ocular metrics during driving by introduc-
ing a hypothesised model and restrictions (Nakayama
et al., 2024a; Nakayama et al., 2024b). A more rea-
sonable assessment of the change in attention levels
during driving would require a detailed analyses us-
ing revised models since the model hypothesis was
insufficient in the previous study.
3 METHOD
Both driving behaviour and oculo-motors of older
drivers were measured while they drove their own
cars along the assigned route around the university
campus (Sun et al., 2016a; Sun et al., 2016b; Sun
et al., 2018a).
3.1 Measurements Recorded During
Driving Experiment
In order to measure the above metrics while driv-
ing (Sun et al., 2015; Sun et al., 2018b), 11 older
participants (7 males and 4 females, aged 62 to 76,
mean=67.3) drove the course under experimental con-
ditions (Sun et al., 2016a). Informed consent was ob-
tained from all participants prior to the experiment.
The entire course was divided into 19 separate
segment paths, which are called “routes”, as shown
in Table 1, and these routes were classified into five
groups according to driving actions. Simple duration
of driving statistics are summarised in the table below.
Changes in Attention Levels While Driving a Car Estimated Using Modelling Techniques with Features of Oculo-Motors
847

Saccade frequency / Relative pupil size
Pupil size
Saccade frequency
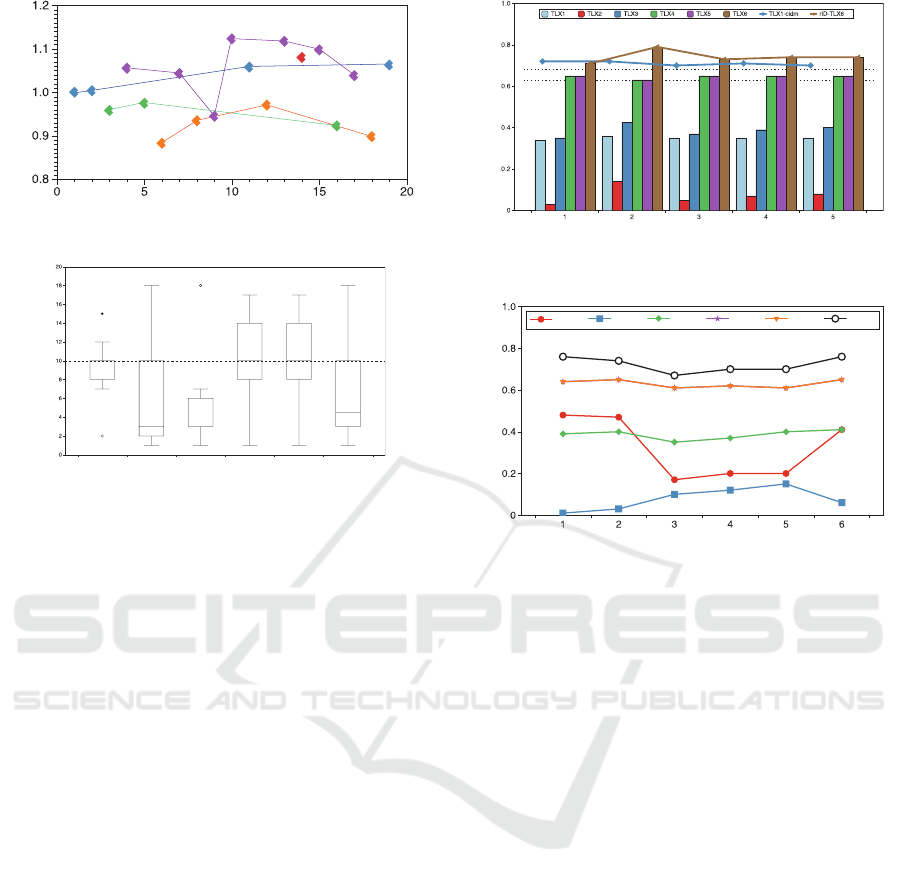
Figure 1: Changes in saccade rate and pupil size across 19
driving routes.
3.2 Experimental Measurements
The targeted data were eye movements including
pupil sizes, and ratings for NASA-TLX as a measure-
ment of cognitive workload, taken after all driving
had been completed.
3.2.1 Oculo-Motor Measurement
Both eye movement and pupil size were measured us-
ing a wearable eye tracker (Arrington, 30Hz) (Sun
et al., 2016a). This equipment can detect saccadic
eye movements in a time-line (Arrington Research,
2016).
Mean temporal changes in the two measured met-
rics (saccade frequency and pupil size) over the 19
routes are summarised in Figure 1, with confidence
intervals of 95%. While observing eye movements
recorded while driving, it was noticed that drivers in
turns or corners rotated their heads before moving
their eyes. Therefore, these vestibulo-ocular reflexes
(VOR) were recorded as saccades. Pupil size might be
influenced by the luminance of the road. As a result,
the averaged metrics remain almost constant over the
entire route.
3.2.2 Cognitive Workload After Driving
A version of NASA-TLX
4
using six 21-point scales
(0-20) was employed to measure the cognitive work-
load, which consists of Mental demand (MD), Phys-
ical demand (PD), Temporal demand (TD), Perfor-
mance (OP), Effort (EF) and Frustration (FR).
Other metrics were also measured, though there
were no significant differences between participants,
as all participants were healthy individuals.
4
https://humansystems.arc.nasa.gov/groups/tlx/downlo
ads/TLXScale.pdf
4 MODELLING ATTENTION
LEVELS
The estimated attention levels of drivers have been ex-
tracted using a state-space model based on both sac-
cade rates and relative pupil sizes (Dubiel et al., 2023;
Nakayama et al., 2024a; Nakayama et al., 2024b). A
definition of attention level with minor revisions is as
follows.
4.1 Model Description
Equation (1) introduces an inverse logit function
(inv logit) for six dimensional state changes in routes
(S level consists of 6 dimension) and individual fac-
tors (rID consists of 11 dimensions). However, route
factor (rRoute consists of 19 dimensions) could not
be implemented in an inverse logit function since the
range of the change was too large. This equation
is revised by introducing an inverse logit function
which normalises the factors of individual and tem-
poral changes, in order to emphasise the differences
in factors of the various routes.
The other conditions are the same as those in our
previous reports (Nakayama et al., 2024a; Nakayama
et al., 2024b). Changes in the index of the level of
attention within routes is represented by the 6 states.
Two measured metrics are simulated using base func-
tions together with attention levels. Saccade rates
(Nsac
times
: 0∼) are generated using Poisson distribu-
tions, and pupillary changes (Pupil
size
) around over-
all mean sizes are generated using Gaussian (Normal)
distributions (Dubiel et al., 2023). The validity of
model may be examined by obtaining an optimised
solution.
Attn = inv logit(S level + rPN + rID) + rRoute
(1)
State Model:
S level
i
∼ Normal(S level
i−1
, σ
s
)
(2)
Observation Model:
µ
noise
∼ Normal(Attn, σ
noise
)
λ = exp(µ
noise
)
NSac
times
∼ Poisson(λ)
Pupil
size
∼ Normal(Attn, σ
p
)
4.2 Parameter Estimation
Model parameters were estimated using sampling
based on measured experimental data with the
BIOSIGNALS 2025 - 18th International Conference on Bio-inspired Systems and Signal Processing
848

-10
-5
5
10
Source of Attention level
0
1 2 3 4 5 6
State
Figure 2: Estimated distributions of latent attention in 6
states (S level).
[2]
-0.2
-0.1
0.0
0.1
0.2
[1] [3] [4] [5] [6] [7] [8] [9] [10] [11] [12] [13] [14] [15] [16] [17] [18] [19]
Route Number
Estimated velue
Figure 3: Estimated distributions of route parameter
(rRoute).
Markov Chain Monte Carlo (MCMC) method. If the
hypothesised model is appropriate, all parameters can
be estimated to fit with the experimental data. In or-
der to compensate for the data insufficiency of 11 par-
ticipants, 7 sets of data of observations were gener-
ated by shifting the observed period by ±1 second in
increments of 0.33 seconds in order to obtain aver-
aged metrics of the 6 states (Nakayama et al., 2024b).
This data extension technique provides 7 times the
data of the original measurements. A sampling using
the Markov Chain Monte Carlo (MCMC) method was
conducted as 4 chains and 6,000 iterations (including
2,000 burn-ins) using the converged condition
ˆ
R < 1.1
for all parameters.
Distributions of estimated parameters for common
latent activity levels (S level) are illustrated in Figure
2, for route parameters (rRoute) in Figure 3 and for
individual factor parameters (rID) in Figure 4. Using
equation (1), attention levels (Attn) for each of the
routes are summarised in Figure 5. Changes in atten-
tion levels may depend on the parameters of the route
(rRoute), and the 5 route groups are indicated in Fig-
ure 6 using coloured lines. As the figure shows, the
rID[1]
rID[2]
rID[3]
rID[4]
rID[5]
rID[6]
rID[7]
rID[8]
rID[9]
rID[10]
rID[11]
-2 -1 0 1 2 3
Participant number
Estimated velue
Figure 4: Estimated distributions of individual parameter
(rID).
Level of Attention
Route number
Figure 5: Mean attention levels (Attn) over routes with con-
fidence intervals of 95%.
levels for [3] Straight and [5] Turn RoundAbout are
higher than the others, and the levels for [2] Left-turn
and [4] Right-turn are lower than the others. This sug-
gests that the level of attention for turns made while
driving is the lowest in order to devote these resources
to overall operation of the motor vehicle. In this sce-
nario, the results show that the level of attention de-
creases with the amount of the cognitive workload.
Attention levels paid while driving along each
route are compared using one-way ANOVA with a
factor of the 5 route groups. This route group factor is
statistically significant (F(4,1219)=112.6, p < 0.01).
In order to extract the relationship between the groups
of routes, the sub-effect test in Tukey method is ap-
plied. In the results, there are significant differences
between [1] On-campus and others, [2] Left-turn and
others except [4] Right-turn, and [4] Right-turn and
[5] Turn RoundAbout. This suggests that the atten-
tion level for turns made while driving is the lowest in
order to devote these resources to overall operation of
the motor vehicle.
However, the results and discussions depend on
the hypothesised model, which is defined as be-
havioural processing, and the validity assessment is
Changes in Attention Levels While Driving a Car Estimated Using Modelling Techniques with Features of Oculo-Motors
849
Route number
Level of Attention
on-Campus
Left-turn
Straight
Right-turn
turn RoundAbout
Figure 6: Mean attention levels (Attn) across route groups.
NASA-TLX score
1:MD 2:PD 3:TD 4:OP 5:EF 6:FR
Figure 7: NASA-TLX score measurements.
not easy to evaluate. Therefore, the results may have
some limitations in explaining the change in workload
under actual driving conditions.
5 MENTAL WORKLOAD
EVALUATION
The results of the assessment of the measurement of
cognitive workload are summarised in a box-plot, as
shown in Figure 7. Individual ratings correlate with
metrics of oculo-motors (Nakayama et al., 2022).
In this section, the contribution of the attention
level to the ratings (Nakayama et al., 2024b), and
the dependency of the estimation models examined.
Correlation coefficients between the ratings and mean
attention levels across all participants in the 5 route
groups are summarised in Figure 8 as a bar graph.
The levels of significance (p < 0.05, p < 0.10) are
illustrated in the figure using dotted lines.
Significant coefficients with a factor for Frus-
tration (FR) are confirmed across the 5 groups of
routes. Both coefficients of factors for Performance
(OP) and Effort (EF) show significant tendencies (p <
0.10). Therefore, most participants perceived some
of the cognitive workload during the driving experi-
ment. In particular, individual factor (r ID) also cor-
relates significantly with the factor rating for Frustra-
tion (FR). Since the attention level is estimated using
equation(1), which consists of a function for individ-
ual factor (rID), the distribution of estimated individ-
p<0.05
p<0.10
on-Campus Left-turn Straight Right-turn turn RoundAbout
Groups of routes
Correlation coefficient
Figure 8: Correlation coefficients between attention levels
and NASA-TLX scores.
TLX1
TLX2
TLX3
TLX4 TLX5 TLX6
Correlation coefficient
Number of state
Figure 9: Correlation coefficients between attention levels
during routes and NASA-TLX scores.
ual factors may affect the ratings.
In addition, the range of the confidence interval
for attention level (Attn) correlates with ratings for
Mental demand (MD). The mean of MD does not cor-
relate directly with attention level. The confidence in-
terval may deviate along the driving route, so it is in-
teresting that the range of the interval correlates with
the ratings for MD.
Regarding changes in correlation coefficients
along with segments of the routes, most coefficients
are maximised slightly during the final route driven
(No.19). Once again, these coefficients are almost
completely dependent on the first term in equation(1)
including individual factor (rID).
Dependency of change in the 6 states while driv-
ing the routes is examined by comparing the corre-
lation coefficients. The changes in coefficients for
attention level and ratings of cognitive workload are
summarised in Figure 9. As mentioned above, only
one rating for FR is a significant coefficient. For
other factors, coefficients change from route to route,
though these coefficients are not significant. More de-
tailed analyses including the revision of the model,
will be a subject of our further study.
BIOSIGNALS 2025 - 18th International Conference on Bio-inspired Systems and Signal Processing
850

6 SUMMARY
A procedure for estimating driver’s attention levels
over a driven course was developed using a state-
space modelling technique with saccade rates and
pupillary changes. In order to consider the interac-
tion of the model’s parameters, the attention estima-
tion model was revised. The estimated attention levels
are assessed along the routes driven. As a result, the
estimated attention level decreased during routes with
turns, such as Left-turn and Right-turn, in comparison
with the straight route.
Also, driver’s ratings for cognitive workload, such
as the Frustration factor, correlate with mean atten-
tion levels over all 5 route groups when surveyed after
driving as been completed. Some statistical informa-
tion regarding changes in levels of attention correlate
with some of the ratings for cognitive workload fac-
tors.
Examination of the contribution of route factors to
attention levels will be a subject of our further study.
REFERENCES
Adler, G., Rottunda, S., and Dysken, M. (2005). The older
driver with dementia: an updated literature review.
Journal of safety research, 36(4):399–407.
Arrington Research (2016). ViewPoint EyeTracker User-
Guide.
Ball, K. and Owsley, C. (1993). The useful field of view
test: A new technique for evaluating age-related de-
clines in visual function. Journal of the American Op-
tometric Association, 64(1):71–79.
Deng, T., Yan, H., Qin, L., Ngo, T., and Manjunath, B. S.
(2020). How do drivers allocate their potential at-
tention? driving fixation prediction via convolutional
neural networks. IEEE Trans. ITS, 21(5):2146–2154.
Dubiel, M., Nakayama, M., and Wang, X. (2023). Mod-
elling attention levels with ocular responses in a
speech-in-noise recall task. In Proc. ETRA 2023,
pages 89:1–89:7. ACM.
Hart, S. G. (2006). NASA-task load index (NASA-TLX);
20 years later. In Proceedings of the human factors
and Ergonomics Society 50th Annual meeting, pages
904–908.
Hu, Z., Lv, C., Hang, P., Huang, C., and Xing, Y.
(2022). Data-driven estimation of driver attention us-
ing calibration-free eye gaze and scene features. IEEE
Trans. Industorial Electronics, 69(2):1800–1808.
Kapitaniak, B., Walczak, M., Kosobudzki, M., J
´
o
´
zwiak,
Z., and Bortkiewicz, A. (2015). Application of eye-
tracking in drivers testing: a review of research. Inter-
national Journals of Occupational Medicine and En-
vironmental Health, 28(6):941–954.
K
¨
ubler, T. C., Fuhl, W., Wagner, E., and Kasneci, E. (2021).
55 rides: Attention annotated head and gaze data dur-
ing naturalistic driving. In Spencer, S. N., editor,
Proceedings of ACM Symposium on Eye-Tracking Re-
search & Applications (ETRA 2021), pages 17(1–8),
New York, USA. ACM.
Mombaugh, T. N. and McIntyre, N. J. (1992). The
mini-mental state examination: A comprehensive re-
view. Journal of the American Geriatrics Society,
40(9):922–935.
Nakayama, M., Sun, Q. C., and Xia, J. C. (2022). Es-
timation of older driver’s cognitive performance and
workload using features of eye movement and pupil
response on test routes. In Proc. IV 2022, pages 155–
160. IEEE.
Nakayama, M., Sun, Q. C., and Xia, J. C. (2024a). Car driv-
ing temporal cognitive workload estimation using fea-
tures of eye tracking. In Proc. Eye Tracking Research
& Applications (ETRA) 2024, pages 35:1–3. ACM.
Nakayama, M., Sun, Q. C., and Xia, J. C. (2024b). Using
oculo-motor features to estimate cognitive workload
while driving a test route. The Transactions of Human
Interface Society, 26(3):273–276.
Paeglis, R., Bluss, K., and Atvars, A. (2011). Driving expe-
rience and special skills reflected in eye movements.
In Proceedings of SPIE, pages 1–7.
Palazzi, A., Abati, D., Calderara, S., Solera, F., and Cuc-
chiara, R. (2019). Predicting the driver’s focus of at-
tention: The DR(eye)VE project. IEEE Trans. PAMI,
41(7):1720–1733.
Schmitt, K.-U., Seeger, R., Fischer, H., Lanz, C., Muser,
M., Walz, F., and Schwarz, U. (2015). Saccadic eye
movement performance as an indicator of driving abil-
ity in elderly drivers. Swiss Medical Weekly, 145:1–
10.
Sun, Q. C., Xia, J. C., Falkmer, T., and Lee, H. (2016a). In-
vestigating the spatial pattern of older drivers’ eye fix-
ation behaviour and associations with their visual ca-
pacity. Journal of Eye Movement Research, 9(6):2:1–
16.
Sun, Q. C., Xia, J. C., Foster, J., Falkmer, T., and Lee, H.
(2018a). Driving manoeuvre during lane maintenance
in older adults: Associations with neuropsychological
scores. Transportation Research Part F, 53:117–129.
Sun, Q. C., Xia, J. C., Foster, J., Falkmer, T., and Lee, H.
(2018b). A psycho-Geoinformatics approach for in-
vestigating older adults’ driving behaviours and un-
derlying cognitive mechanisms. European Transport
Research Review, 10(2)(36):1–11.
Sun, Q. C., Xia, J. C., He, J., Foster, J., Falkmer, T., and Lee,
H. (2018c). Towards unpacking older drivers’ visual-
motor coodination: A gaze-based integrated driving
assessment. Accident Analysis & Prevention, 113:85–
96.
Sun, Q. C., Xia, J. C., Nadarajah, N., Falkmer, T., and Lee,
H. (2016b). Assessing drivers’ visual-motor coordi-
nation using eye tracking, GNSS and GIS: a spatial
turn in driving psychology. Journal of Spatial Science,
61(2):299–316.
Sun, Q. C., Xia, J. C., Nadarajah, N., Foster, J., and
Lee, H. (2015). Positioning eye fixation and vehi-
cle movement: Visual-motor coordination assessment
Changes in Attention Levels While Driving a Car Estimated Using Modelling Techniques with Features of Oculo-Motors
851

in naturalistic driving. In Veenendaal, B. and Kealy,
A., editors, Research@Locate15, pages 90–99. CEUR
Workshop Proceedings. http://ceur-ws.org.
Ueno, T. and Nakayama, M. (2021). Estimation of visual at-
tention using microsaccades in response to vibrations
in the peripheral field of vision. In Proceedings of
ETRA2021, pages 1–6. ACM.
Underwood, G. (2005). Cognitive Processes in Eye Gudid-
ance. Oxford University Press, New York, USA.
Wood, J. M. and Owsley, C. (2014). Gerontology view-
point: Useful field of view test. Gerontology,
60(4):315–318.
Yamaguchi, K., Nakayama, M., Sun, Q., and Xia, J. (2019).
Prediction of cognitive performance of drivers using
eye fixation behaviours. In Proceedings of 23rd Inter-
national Conference Information Visualisation, pages
186–190, London, UK.
Yamani, Y., Horrey, W. J., Liang, Y., and Fisher, D. L.
(2016). Age-related differences in vehicle control
and eye movement patterns at intersections: older and
middle-aged drivers. PLOS ONE, 11:1–17.
BIOSIGNALS 2025 - 18th International Conference on Bio-inspired Systems and Signal Processing
852
