
Modeling HIF-ILK Interaction Using Continuous Petri Nets
Viktor Gilin
∗
, Sanne Laauwen
∗
, Yuying Xia
∗
, Noria Yousufi
∗
and Lu Cao
a
Leiden Institute of Advanced Computer Science, Leiden University, Einsteinweg 55, Leiden, The Netherlands
{v.gilin, a.m.l.laauwen, y.xia, n.s.yousufi}@umail.leidenuniv.nl, l.cao@liacs.leidenuniv.nl
Keywords:
Petri Nets, Breast Cancer, Hypoxia Response, Hypoxia-Inducible Factors, Integrin-Linked Kinase.
Abstract:
Oxygen concentration in tumor micro-environment is a well-established signal that can induce aggressive can-
cer behaviour. In particular, low oxygen levels (hypoxia) activate the Hypoxia-Inducible Factor(HIF) pathway
which has an array of target systems. One of these systems is Integrin-Linked Kinase (ILK) pathway, which
influences key signaling pathways for cell survival, proliferation, and migration. Hence, this paper aimed to
explore the interconnection between these two pathways. Using the Petri net modeling tool Snoopy, an es-
tablished HIF network model was transformed to be a continuous Petri net. Subsequently, the network was
expanded to incorporate a feedback element from the ILK pathway to HIF, based on gene expression data.
The resulting model conserved the oxygen switch response of the original HIF model and positively amplified
HIF’s output. Therefore, this model provides a starting point for establishing a system reflecting crucial effect
on hypoxia-induced cancer behavior, and could potentially serve as a basis for future drug development.
1 INTRODUCTION
Breast cancer is a significant global health concern
with an increasing trend in prevalence and mortality
rates (Azamjah et al., 2019). Hypoxia, a condition of
low oxygen within tumor micro-environments, plays
a role in its progression. Under low oxygen condi-
tions, the hypoxia-inducible factor-1 (HIF-1) plays a
role in regulating certain aggressive cancer traits (Lu
and Kang, 2010; Hanahan, 2022). It mainly activates
genes that are critical for tumor growth and survival,
including the integrin-linked kinase (ILK) gene (Per-
sad and Dedhar, 2003). The focus of this paper is to
explore the interplay between HIF-1 and ILK within
the context of breast cancer under hypoxic conditions.
This was done by transforming an established Petri
net for the HIF-1 pathway by Heiner et al. (Heiner
and Sriram, 2010), to be continuous and to include
mechanisms related to the ILK gene specifically. The
Petri net model, depicting the dynamics of the ILK
and HIF-1 pathways, was subsequently analyzed us-
ing the Snoopy and Charlie software tools (Heiner
et al., 2012; Heiner et al., 2015). This approach al-
lowed for the study of how variations in hypoxia af-
fect the expression of the ILK gene. To enhance the
accuracy and refine the network model, experimen-
tal results from Western blots were used to check the
a
https://orcid.org/0000-0002-1847-068X
∗
These authors contributed equally to this study.
presence of proteins in these pathways under differ-
ent oxygen conditions. This provided empirical veri-
fication and allowed for further improvements to the
model (Chou et al., 2015). This approach aims to im-
prove the understanding of the pathway dynamics, of-
fering insights that could be used in research towards
potential therapeutic strategies.
2 BIOLOGICAL BACKGROUND
A critical factor influencing the progression of breast
cancers is hypoxia, a condition of low oxygen preva-
lent within tumor micro-environments due to low dif-
fusion of oxygen to the tissue affected by the tumor
(Hanahan, 2022). This condition significantly influ-
ences the expression of numerous genes that are crit-
ical to the progression of breast cancer. This paper
specifically looks at the MCF-7 cell line, classified as
Luminal A cells. Although this sub-type is generally
considered less aggressive (Orrantia-Borunda et al.,
2022), there is a substantial amount of research to-
wards hypoxia performed using this specific cell line
(Chou et al., 2015; Raja et al., 2014; Hsu et al., 2016).
This abundance of research provides a solid founda-
tion for modeling, analysis, verification, and under-
standing the biological interactions. The following
subsections specifically discuss findings from this cell
line.
Gilin, V., Laauwen, S., Xia, Y., Yousufi, N. and Cao, L.
Modeling HIF-ILK Interaction Using Continuous Petri Nets.
DOI: 10.5220/0013102600003911
Paper published under CC license (CC BY-NC-ND 4.0)
In Proceedings of the 18th International Joint Conference on Biomedical Engineering Systems and Technologies (BIOSTEC 2025) - Volume 1, pages 537-544
ISBN: 978-989-758-731-3; ISSN: 2184-4305
Proceedings Copyright © 2025 by SCITEPRESS – Science and Technology Publications, Lda.
537

2.1 HIF Pathway
The transcriptional response to hypoxia is primarily
mediated by HIF-1, which is a transcription factor
regulated by oxygen levels (Lin et al., 2011). HIFs
consist of an oxygen-sensitive α-subunit and a consti-
tutively expressed β-subunit (Muz et al., 2015). Un-
der normoxic conditions, the HIF-1α subunit is unsta-
ble and hydroxylated by specific prolyl hydroxylases
(PHDs). This hydroxylation leads to ubiquitination
by the von Hippel-Lindau protein (VHL) and subse-
quent proteasome-mediated degradation (Majmundar
et al., 2010). In contrast, under hypoxic conditions,
the PHDs are inactivated, preventing the hydroxyla-
tion and degradation of HIF-1α. This allows HIF-1α
to accumulate.
Although HIF-1α can also degrade through
oxygen-independent pathways, these mechanisms are
less efficient. Meaning that under low oxygen condi-
tions, HIF-1α still accumulates. Under hypoxia, HIF-
1α initially binds with high affinity to PHDs, forming
a HIF-1α-PHD complex. However, due to the low
oxygen levels, this complex cannot be hydroxylated
and thus remains stable. Once the PHDs are satu-
rated, the excess HIF-1α binds to the β-subunit, also
referred to as the ARNT subunit, to form the HIF-
1α-ARNT complex, which actively binds to hypoxia
response elements (HREs) in the genome. This com-
plex also associates with PHDs to form a HIF-ARNT-
PHD complex, which similarly cannot be hydroxy-
lated due to the low oxygen content. The predomi-
nant form under hypoxic conditions is therefore HIF-
ARNT, which actively induces HREs. This differen-
tial binding behavior of HIF-1α between PHD and
ARNT subunits under varying oxygen levels crucially
regulates the cellular adaptation to hypoxia by activat-
ing genes that help the cell cope with reduced oxygen
availability. Figure 1 provides a schematic representa-
tion of the hypoxia response network. In this diagram,
HIF1-α is denoted as HIF, and HIF1-β is referred to as
ARNT. The diagram illustrates the protease-mediated
degradation pathways of HIF-1α (shown in black),
highlighting both oxygen-dependent (depicted in red
and blue) and oxygen-independent mechanisms for
degradation (illustrated in green).
2.2 ILK Gene
The integrin-linked kinase (ILK) gene functions as a
serine/threonine protein kinase that interacts with in-
tegrins and growth factor receptors to influence key
signaling pathways for cell survival, proliferation,
and migration (Persad and Dedhar, 2003; G
´
orska and
Mazur, 2022). In conditions of low oxygen, HIF-1α
Figure 1: Schematic diagram of hypoxia response network
(Heiner and Sriram, 2010). Three pathways, given in green
(oxygen-independent pathway), blue and red (oxygen-
dependent pathways) can degrade HIF transcription factor.
activates the expression of ILK, which in turn boosts
the levels of HIF-1α, stabilizing it during hypoxic
stress. This interaction is supported by Akt, which en-
hances HIF-1α expression through mTOR-mediated
translation, promoting aggressive tumor characteris-
tics and the potential for metastasis (Chou et al.,
2015). Additionally, ILK significantly influences the
epithelial-to-mesenchymal transition (EMT), a key
process in cancer metastasis, by modulating proteins
such as Snail and Twist and by suppressing the tumor
suppressor Foxo3a, thereby intensifying HIF-1α sig-
naling (Chou et al., 2015; Emerling et al., 2008).
In Figure 2, a simplified diagram illustrates the
mechanisms through which ILK influences HIF-1α
expression under hypoxic conditions. The diagram
shows the feedback loop where ILK, through the
phosphorylation of Akt at serine 473 (p-473S-Akt),
leads to the subsequent activation of mTOR (p-
mTOR), which in turn upregulates HIF-1α. The phos-
phorylation at Ser473 is a critical modification that
activates Akt, a kinase involved in various cellular
processes such as metabolism, proliferation, and sur-
vival. This activation enhances the mTOR pathway,
contributing to the upregulation of HIF-1α. Addi-
tionally, this pathway regulates downstream factors
involved in the EMT, further influencing cellular be-
havior under hypoxic conditions.
3 PETRI NETS MODELING
Petri nets are a well-established mathematical for-
malism initially introduced for modeling concurrent
systems in the field of computer science (Chaouiya,
2007). Petri nets represent concurrent, asynchronous
and distributed processes in a graphical way, which
help in understanding the structure of complex sys-
tems. In biology, Petri nets are widely used in model-
BIOINFORMATICS 2025 - 16th International Conference on Bioinformatics Models, Methods and Algorithms
538

Figure 2: Diagram depicting the mechanisms by which
ILK interacts with HIF-1α expression and the mesenchymal
phenotype of cancer cells under hypoxic conditions (Chou
et al., 2015).
ing and analyzing biological networks such as signal-
ing pathways (
ˇ
Sterberov
´
a et al., 2024) and metabolic
pathways. A Petri net can be defined mathematically
(Bl
¨
atke et al., 2011) as a tuple N = (P, T, F, W, M
0
).
P is the set of places. T is the set of transitions. A
relation F ⊆ (P × T ) ∪(T × P) shows how places and
transitions are related. A mapping W : F → N is the
weight function that assigns each arc(x, y) connecting
a place and a transition an integer W (x, y). The initial
marking M
0
: P → N assigns each place p its initial
token load M
0
(p).
Petri nets consist of active components (transi-
tions) and passive components (places), which re-
spectively describe biological activities and entities.
By simulating Petri nets, it becomes possible to pre-
dict the dynamic behavior of networks without con-
ducting actual experiments. Petri nets allow graphical
representation, where places are depicted as circles,
transitions as rectangles, and relations as directed arc.
Building on the framework of Petri nets, this pa-
per used continuous Petri net to study the dynamics
of the ILK and HIF pathways under varying hypoxia
conditions. A Continuous Petri net (CPN) is an ex-
tension of the basic Petri net. The structure is the
same as discrete Petri net. However, the marking of
a place is a positive real number, referred to as the
token value, which can be interpreted as a concentra-
tion (Heiner et al., 2008). Continuous Petri nets al-
low for the use of real-time reaction rates and contin-
uous changes in concentrations. In this context, each
place represents a variable in the ordinary differen-
tial equation (ODE) system, and each transition rep-
resents a rate of change in the equations. Reaction
rates are implemented through the firing rate func-
tion of the transitions. Firing rates can be specified
in various ways (Herajy and Heiner, 2018), including
mass-action kinetics, Michaelis-Menten kinetics, and
Hill kinetics (Herajy and Heiner, 2018). Mass-action
kinetics, which describes the firing rates of chemical
reactions based on the concentrations of reactants, is
used to define the firing rates in the continuous Petri
net model presented in this paper. We integrated firing
rates from previous simulation studies (Kohn et al.,
2004) and fine-tuned these firing rates based on ex-
perimental data. The model aims to provide a quanti-
tative simulation of how hypoxia levels influence ILK
expression through the interaction of the ILK and HIF
pathways. In the following subsections, we will dis-
cuss the modeling decisions and rationale behind the
continuous Petri net used in this case study.
3.1 Hypoxia Switch Response of HIF
A starting point for our model was the Petri net de-
veloped by Heiner et al. (Heiner and Sriram, 2010),
which has been shown to successfully model HIF’s
switch response to hypoxia. This model based on the
schematic diagram shown in Figure 1. While Heiner
et al. (Heiner and Sriram, 2010) designed the struc-
ture of the network, they only kept it as a discrete
Petri net and performed their analysis using different
numerical simulation tools. We intend to transform
their discrete network into a continuous one. Con-
tinuous token values are used to represent the con-
centrations of the network’s elements. This approach
allows for a more detailed depiction of the biochemi-
cal processes occurring within the system. The Mass-
action function is used to implement firing rate values
in the continuous transitions. The choice of reaction
rates was initially based on those used by Heiner et
al. (Heiner and Sriram, 2010). The k-value shown in
Table 1 represents the reaction rate constant obtained
by Kohn et al. (Kohn et al., 2004) through an iterative
search of parameter space that exhibits switch behav-
ior. The initial markings in Table 2 were the same as
those used by Heiner et al. and Kohn et al.. The re-
sulting transition to CPN showed correspondence to
Heiner et al. allowing us to continue with the imple-
mentation of ILK expression as part of the network.
Table 1: Firing Rate values set (k-values set) for each tran-
sition MassActionFunction.
Transition Final k-value Transition Final k-value
k1 0.1929 k19 0.1392
k2 0.0007 k19 0.1392
k3, k21 0.0148 k20 0.2144
k4, k22 1.6732 ILK tr1 1.0000
k5, k29 0.2681 ILK tr2 1.0000
k6, k30 0.0809 ILK deg 3.0000
k12, k15 1.5478 FL1 0.4181
k13, k16 0.0416 FL2 0.4181
k14, k17 0.0226 FL3 0.4181
k18 0.4738 pmTOR deg 3.0000
pAkt deg 0.2000
Modeling HIF-ILK Interaction Using Continuous Petri Nets
539

Table 2: Initial markings used. The value of oxygen varies
from 0.1 to 0.9 for the simulations. Places that had an initial
marking of zero are left out from the table.
Place Marking
VHL 10
PHD 10
ARNT 5
HRE 1
O2 0.1-0.9
3.2 ILK Expression
The first step in establishing ILK expression was to
define the ILK gene. As the original network already
includes a general HRE, this HRE in the context of
this project was treated as the binding site on the gene
encoding the ILK protein. While not applied in a Petri
net, transcription of an HRE has already been mod-
elled (Kohn et al., 2004; Yu et al., 2007) as a sequence
of intermediate reactions forming mRNA. The inter-
mediate reactions in this model serve solely as a time
delay for expression and do not represent any specific
biological processes. Similarly, Kohn et al. imple-
mented mRNA to model a VHL-dependent feedback
loop based on the concentration of HRE mRNA.
To implement a similar expression in the con-
text of Petri nets, two parallel transitions were in-
troduced which represented the transcription of the
ILK HRE to ILK coming from the two transcrip-
tion factor gene complexes (HIF:ARNT:HRE and HI-
FOH:ARNT:HRE). Because this reaction is not a con-
version of gene to its expressed protein a reverse arc
was added coming from the transition back to the
gene complex. While the intermediate steps imple-
mented by Kohn et al. are useful for studying the
complex dynamic behavior of their network. But a
time delay was deemed unnecessary for this model,
as the focus is primarily on the steady-state values
of the system. Therefore, only one transition repre-
senting transcription was included for each HIF:HRE
complex, termed “ILK tr1” and “ILK tr2”. An addi-
tional transition termed “ILK deg” was further added
representing the protein’s degradation. Such a degra-
dation term allows for eventually reaching a steady
state concentration value and prevents the resulting
ILK protein from increasing indefinitely. Given that
the complexity of gene expression was not central to
this study, the formation of an ILK protein was sim-
plified as a product of one “transcription” transition.
A final addition to the network was a change in the
k-value set (Table 1 Intermediate k-value and Final k-
value). Kohn et al (Kohn et al., 2004) obtained three
different sets of k-values with the third one tethered
for their extended network. This set of values was
considered a more accurate choice, given that the net-
work also implements transcription and a feedback
loop. A particularly significant change in these val-
ues is the increase in the k12 value, which appears to
compensate for the additional input of tokens towards
HIF due to the feedback loop.
The next step in the modeling process was to im-
plement an ILK feedback loop towards HIF, as de-
scribed by Chou et al. (Chou et al., 2015) (see
Fig.2). Two additional places were introduced into the
network: p-473S-Akt and p-mTOR, connecting ILK
with HIF through simple unidirectional transitions as
a starting point. These transitions were termed FL1,
FL2 and FL3. Since there was no specific reference
for choosing k-values for these transitions, an aver-
age value of the k-values from the core HIF network
was used. Applying average k-values provides a con-
sistent starting point, so the effect of the ILK feed-
back loop on HIF signaling could be explored with-
out guessing random values. A consequence of this
choice is that it might oversimplify how the ILK feed-
back loop works. However, it allows for the detection
of general patterns in the network.
To prevent the simplicity of the structure result-
ing in the net converging to the same steady-state
value, additional reverse arcs were introduced, similar
to the design of the transcription transition. Moreover,
degradation term is introduced to represent the natural
degradation of proteins and it acts as an interface for
the biological system. Therefore, degradation terms
(pmTOR deg and pAkt deg) for each feedback loop
protein were introduced. Initially the choice for these
terms was 0.2 as chosen for the HIF mRNA degrada-
tion term in the feedback loop from Kohn et al.. How-
ever, the value of pmTOR deg was increased to en-
sure lower steady-state concentration relative to HIF
as seen on Figure 4. This resulted in the final network
for this case study.
Petri model developed in this project were con-
structed using the Snoopy environment. The final
model is shown in Figure 3.
4 ANALYSIS AND RESULTS
Initial simulations in Snoopy were conducted for dif-
ferent marking sets to capture the dynamic behav-
ior of the network under varying oxygen conditions.
These simulation results were then compared with
Western blot data, which provided experimentally ob-
served expression levels. Lastly, Charlie software was
utilized for a structural analysis, exploring various
properties of the networks at hand.
BIOINFORMATICS 2025 - 16th International Conference on Bioinformatics Models, Methods and Algorithms
540
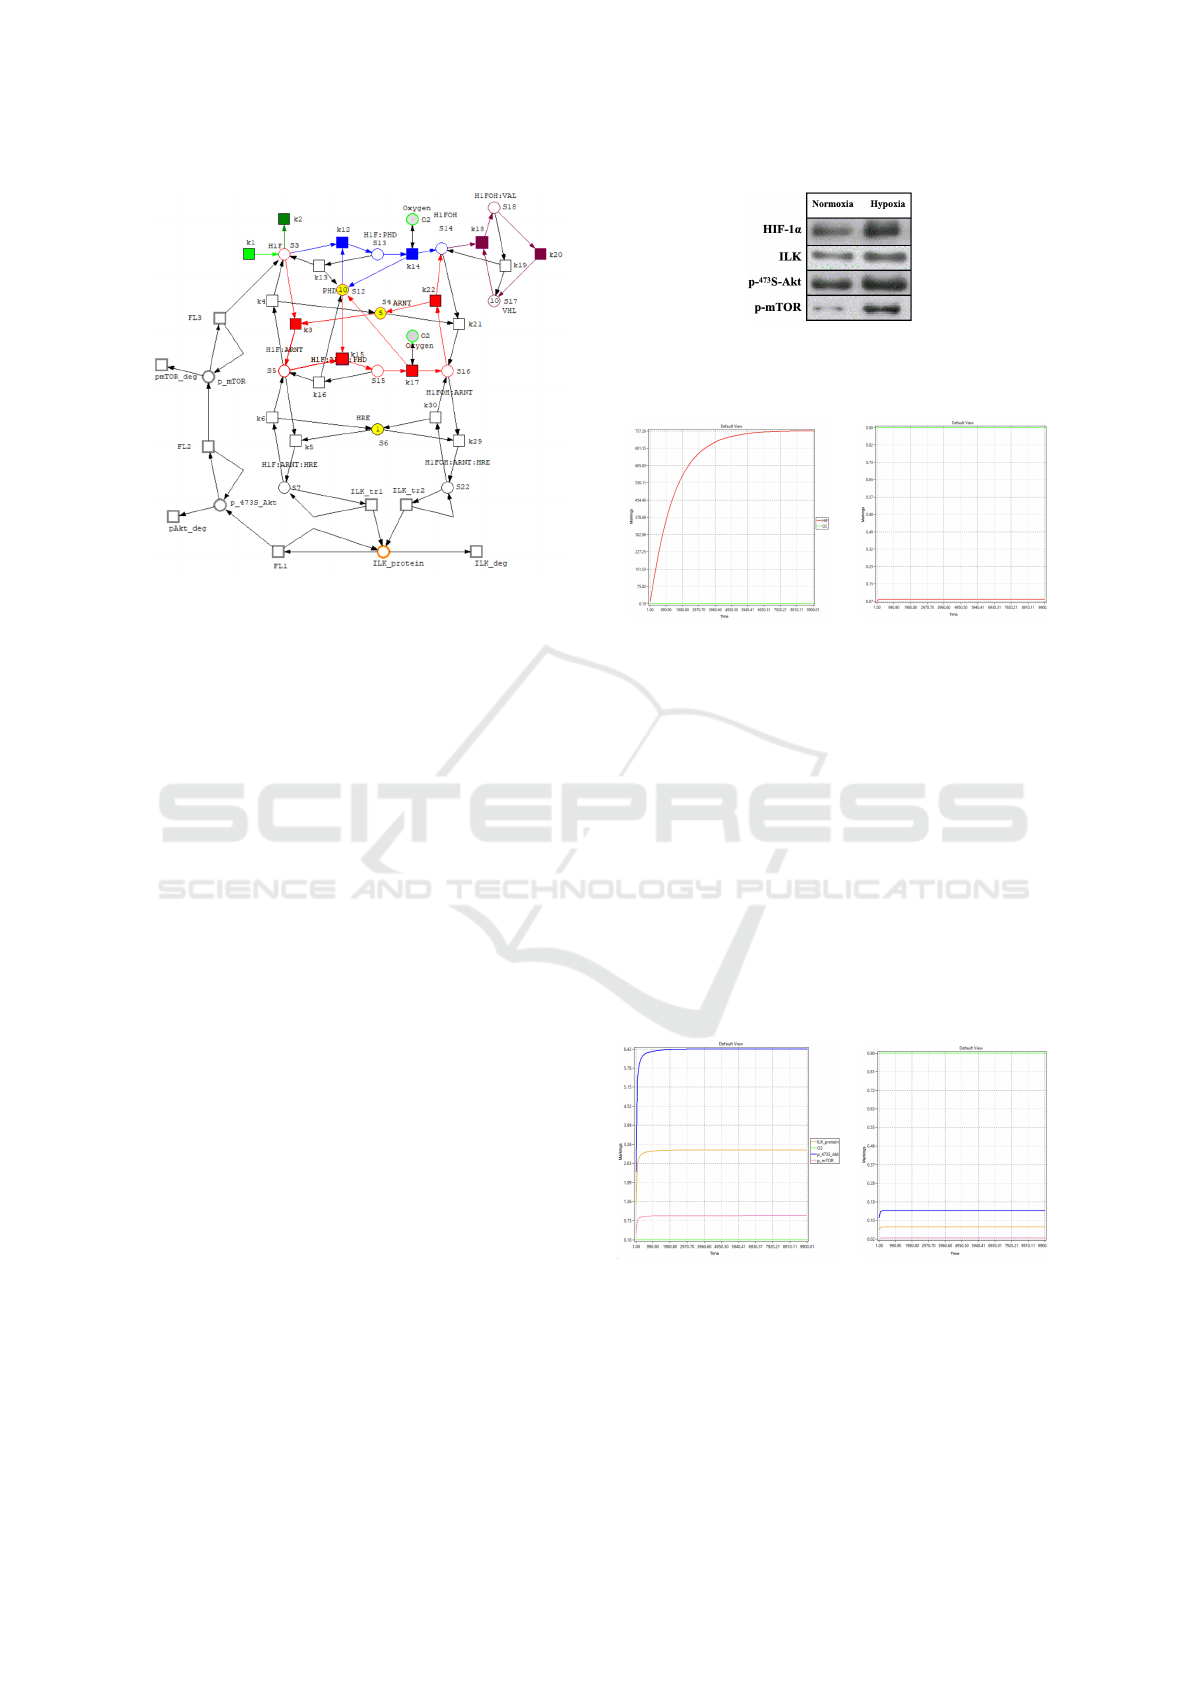
Figure 3: HIF-ILK feedback Petri net. Similar to Figure
1, the green pathway is oxygen-independent, while the blue
and red pathways are oxygen-dependent, all contributing to
HIF transcription factor degradation.
4.1 Simulations Using Snoopy
Simulations were performed for all values from 0.1
to 0.9 in increments of 0.1. This method allowed for
the simulation of different degrees of hypoxia within
the network. The behavior of HIF-1α in relation to
oxygen was observed. For simplicity, HIF-1α is rep-
resented as HIF in the Petri net and will be referred to
as HIF throughout this analysis. In addition, the be-
havior of the elements in the ILK feedback loop was
also analyzed.
To verify the biological accuracy of the network, a
comparison to an experimental Western blot was con-
ducted for four proteins of interest: HIF1-α, ILK, p-
473S-Akt, and p-mTOR. The results of this analysis
are presented in Figure 4.
These Western blots are sourced from a paper by
Chou et al. that investigates the regulatory loop be-
tween HIF-1α and ILK (Chou et al., 2015). It can
be observed that the intensity of the HIF-1α and ILK
bands is higher in hypoxia compared to normoxia,
which aligns with expectations. The p-mTOR also
shows much higher intensity under hypoxic condi-
tions. For p-473S-Akt, the intensity is slightly higher
in hypoxic conditions, but this change is not as no-
ticeable as the other molecules. The results of West-
ern blots suggest that the activation of Akt can be in-
fluenced by multiple signaling pathways, not solely
by hypoxia, which might mask any hypoxia-specific
changes.
The responses of HIF to hypoxia and normoxia for
the final Petri net are illustrated in Figure 5. HIF has a
steady-state expression level of 757.26 under hypoxia
Figure 4: Western blot analysis of the expression levels
of endogenous HIF1-α, ILK, p-473S-Akt, and p-mTOR in
MCF-7 cell line (Chou et al., 2015).
(a) Initial O
2
marking = 0.1. (b) Initial O
2
marking = 0.9.
Figure 5: Snoopy simulation of the final Petri net, with a
time range set to 10,000.
condition. The level of HIF under normoxia condi-
tions stays around 0.07.
The simulation of hypoxia and normoxia on the
proteins of the ILK feedback loop are displayed in
Figure 6. In general, the proteins are expressed more
in hypoxia condition than in normoxia condition. The
protein expression levels are consistent with the West-
ern blot results shown in Figure 4. Specifically, p-
473S-Akt is the most highly expressed, followed by
the ILK protein and p-mTOR is the least expressed.
This expression pattern was achieved by adjusting the
degradation transitions to simulate the observed be-
havior.
(a) Initial O
2
marking = 0.1. (b) Initial O
2
marking = 0.9.
Figure 6: Snoopy simulation of the final Petri net for the
ILK feedback loop, with a time range set to 10,000.
Modeling HIF-ILK Interaction Using Continuous Petri Nets
541

4.2 Steady State Comparison
A network reaches a steady state when it achieves a
stable equilibrium, these values are recorded and anal-
ysed in this section. Figure 7a compares the steady
state values of HIF in response to varying oxygen lev-
els ranging from 0.1 to 0.9, with increments of 0.1. In
the final network, HIF levels remain higher at lower
oxygen levels compared to the original and interme-
diate networks. The HIF value drops significantly
around oxygen level of 0.6, indicating a switch-like
behavior. After which the HIF level stays constant at
zero.
(a) (b)
Figure 7: (a)Steady-state graph of HIF response to varying
oxygen levels. Original network: the net incorporating the
Petri net from Heiner et al.; Intermediate network: adding
a complex feedback loop; Final network: further adding
degradation processes. (b)Steady state graph of proteins:
ILK, p-473S-Akt and p-mTOR, for the final network.
Figure 7b depicts the response of proteins in the
ILK pathway (ILK, p-473S-Akt, and p-mTOR) to
varying oxygen levels within the final network. In the
final network, the steady state values of the proteins
drop between oxygen level of 0.6 and 0.7.
4.3 Analysis Using Charlie
In this section, analysis results of our Petri net using
Charlie(Heiner et al., 2015) are displayed. Charlie
provides a qualitative analysis of the structural and
behavioral properties of the Petri nets. The conducted
analysis aims to elucidate the fundamental charac-
teristics and dynamic behaviors of biological net-
works. However, Charlie only accepts discrete Petri
net. Therefore, we converted our continuous Petri net
into a discrete Petri net for the analysis. The results
derived from the structural analysis properties can be
found in Table 3.
Properties like ORD (ordinary), HOM (homoge-
neous), CON (conservative), NBM (non-blocking),
FP0 (every place has a pre-transition), and PF0 (ev-
ery place has a post-transition) are present, indicat-
ing that the net maintains uniformity, conservation,
and avoids blocking in its structure. This reflects a
consistent and balanced distribution of tokens across
Table 3: Structural properties of final Petri Net calculated
using Charlie. ”T” denotes true for possessing the property,
while ”F” denotes false, indicating the property is absent.
Yellow indicates information beyond a binary classification.
Property Final Full name Definition
PUR F pure No two places are connected in both di-
rections.
ORD T ordinary The weight of all arcs equals to 1.
HOM T homogeneous All outgoing arcs of a place have the
same multiplicity.
CON T connected For every two places, there exists an
undirected path.
SC F strongly
connected
For every two places, there exists a di-
rected path.
NBM T non-
blocking
multiplicity
The minimum weight of incoming arcs
of a place is greater or equal to the max-
imum weight of outgoing arcs of that
place.
CSV F conservative Every transition adds the same number
of tokens to its post-places as it subtracts
from its pre-places.
SCF F structurally
conflict free
There are no two transitions sharing a
pre-place.
FT0 F Every transition has a pre-place.
TF0 F Every transition has a post-place.
FP0 T Every place has a pre-transition.
PF0 T Every place has a post-transition.
RKTH F rank theo-
rem
The rank of the incidence matrix of the
Petri net equals to
|
SCCS
|
− 1.
NC nES net class nES: not extended simple.
places and transitions. However, properties such as
PUR (pure), SC (strongly connected), CSV (conser-
vative), SCF (structurally conflict free), FT0 (Every
transition has a pre-place), TF0 (Every transition has
a post-place), and RKTH (rank theorem) are absent.
The absence of these properties suggests that the net
contains self-loops, lacks a strongly connected com-
ponent, has transition without pre-place or post-place,
has structural conflicts, and doesn’t satisfy the rank
theorem conditions. These absences highlight areas
where the net’s structure may not fully adhere to cer-
tain biological consistencies or principles.
The analysis of the behavioral properties of the
Petri nets under hypoxia and normoxia conditions re-
veals that the behavioral properties change between
oxygen levels. Key properties such as k-Boundedness
(k-B) and Structural Boundedness (SB) are absent
across all conditions, indicating that the nets are un-
bounded and have infinite state spaces, making reach-
ability graph visualization impractical. The Siphon-
Trap Property (STP) is present under normoxia but
absent under hypoxia, suggesting enhanced stability
and liveness in normoxic conditions. Reversibility
(REV) is false, indicating that the net cannot revert
to their initial state from any reachable state. Lastly,
the absence of dead states (Dst) under normoxia sug-
gests that normoxic conditions help maintain continu-
ous operation by avoiding states with no possible tran-
sitions. For the hypoxic conditions this property was
BIOINFORMATICS 2025 - 16th International Conference on Bioinformatics Models, Methods and Algorithms
542

not discovered.
The P-invariants are presented in Table 4. Each
P-invariant represents a set of places in the Petri net
where the total number of tokens remains constant,
reflecting the conservation of certain resources or
substances within the network. In our network, the
amount of oxygen (O
2
) remains constant throughout
the network’s processes. This constancy is based on
the assumption that the system operates in an envi-
ronment where oxygen levels are maintained based
on the original marking. Similarly, the total amount
of PHD proteins is conserved across places S
12
, S
13
,
and S
15
, representing free PHD, PHD bound to HIF1-
α, and PHD bound to the HIF1 complex (ARNT and
HIF) respectively. This consistency is logical since
the enzyme merely catalyzes the reaction without be-
ing consumed in the process. The ARNT is conserved
in multiple places, including S
4
, S
5
, S
7
, S
15
, S
16
, and
S
22
. These places again represent all the bound and
unbound versions of this protein. As it is part of a
transcription factor it again isn’t consumed but simply
just binds other elements in the Petri net. The VHL is
conserved in places S
17
and S
18
, indicating that the
total amount of the VHL protein remains constant in
these locations. Similarly, the HRE are conserved in
places S
6
, S
7
, and S
22
. HREs act as binding sites
for transcription factors but are not depleted during
the regulatory process. The conservation of specific
proteins and elements aligns with biological expecta-
tions, where certain quantities must remain stable to
maintain cellular functions under different conditions.
Table 4: P-invariants of the Petri net.
Invariant P-invariant
name
Places
1 Oxygen O
2
2 PHD
total
S
12
,S
13
,S
15
3 ARNT
total
S
4
,S
5
,S
7
,S
15
,S
16
,S
22
4 V HL
total
S
17
,S
18
5 HRE
total
S
6
,S
7
,S
22
The non-trivial T-invariants were presented in Ta-
ble 5. Each T-invariant represents a sequence of tran-
sitions in the Petri net that, when executed, return the
network to its original state. Biologically, T-invariants
represent consistent, repeatable behaviors. They iden-
tify sub-networks that either return to a given state
after a series of reactions or maintain a steady state
through continuous reactions. In the final network
four T-invariants were identified. The first two repre-
sent the oxygen-dependant degradation of HIF medi-
ated by PHD. The third and fourth T-invariants illus-
trate similar oxygen-dependent degradation pathways
of HIF. However, in these T-invariants, the HIF does
not come from the inflow into the system represented
by the Petri net, but from the positive feedback result-
ing from the ILK loop. These four T-invariants effec-
tively and intuitively show the input-output behavior
of the network.
Table 5: T-invariants of the Petri net.
Invariant Transitions
1 k
1
, k
12
, k
14
, k
18
, k
20
2 k
1
, k
3
, k
15
, k
17
, k
18
, k
20
, k
22
3 k
12
, k
14
, k
18
, k
20
, FL3
4 k
3
, k
15
, k
17
, k
18
, k
20
, k
22
, FL3
5 CONCLUSION
This paper aimed to investigate how variations in oxy-
gen levels affect the expression of HIF and ILK path-
ways through a continuous Petri net. The analysis
with the Snoopy simulations show that hypoxic con-
ditions result in higher expression of HIF and ILK
pathway compared to normoxic conditions. The fi-
nal network achieves a steady-state equilibrium, with
expression levels corresponding to the Western blot
used for validation, thereby confirming that the final
network functions as expected. When examining the
steady-state graphs of the final network, the expres-
sion levels of the HIF and ILK pathways switch from
hypoxic to normoxic conditions between an oxygen
concentration of 0.6 and 0.7. Additionally, the struc-
tural, behavioral, T-invariant, and P-invariant analyses
provide deeper insights into the network’s properties.
Overall, this study provides a robust model for under-
standing the dynamics of these pathways under differ-
ent oxygen conditions, which can be crucial for fur-
ther research in cancer biology and the development
of therapeutic strategies targeting hypoxia-induced
cancer behavior.
To broaden the scope and enhance the robustness of
the current Petri net model, future research should
integrate more experimental data and focus on ad-
ditional breast cancer cell lines, such as triple-
negative and HER2-positive. This expansion would
improve our understanding of varying hypoxia re-
sponses and ILK inhibitor sensitivities across differ-
ent subtypes, potentially uncovering novel therapeu-
tic targets within the HIF-ILK pathway. Furthermore,
incorporating the ILK inhibitor T315, as studied by
Chou et al. (Chou et al., 2015), into the model could
provide valuable insights into its ability to disrupt the
HIF-ILK loop. This integration would enhance the
model’s accuracy and offer implications for more ef-
fective therapeutic strategies against hypoxia-driven
cancer progression.
Modeling HIF-ILK Interaction Using Continuous Petri Nets
543

REFERENCES
Azamjah, N., Soltan-Zadeh, Y., and Zayeri, F. (2019).
Global trend of breast cancer mortality rate: a 25-
year study. Asian Pacific journal of cancer prevention:
APJCP, 20(7):2015.
Bl
¨
atke, M. A., Heiner, M., and Marwan, W. (2011). Petri
nets in systems biology. In Petri Net Basics, chapter 2.
Otto-von-Guericke University Magdeburg.
Chaouiya, C. (2007). Petri net modelling of biological net-
works. Briefings in bioinformatics, 8(4):210–219.
Chou, C.-C., Chuang, H.-C., Salunke, S. B., Kulp,
S. K., and Chen, C.-S. (2015). A novel hif-1α-
integrin-linked kinase regulatory loop that facilitates
hypoxia-induced hif-1α expression and epithelial-
mesenchymal transition in cancer cells. Oncotarget,
6(10):8271.
Emerling, B. M., Weinberg, F., Liu, J.-L., Mak, T. W., and
Chandel, N. S. (2008). Pten regulates p300-dependent
hypoxia-inducible factor 1 transcriptional activity
through forkhead transcription factor 3a (foxo3a).
Proceedings of the National Academy of Sciences,
105(7):2622–2627.
G
´
orska, A. and Mazur, A. J. (2022). Integrin-linked kinase
(ilk): the known vs. the unknown and perspectives.
Cellular and Molecular Life Sciences, 79(2):100.
Hanahan, D. (2022). Hallmarks of cancer: new dimensions.
Cancer discovery, 12(1):31–46.
Heiner, M., Gilbert, D., and Donaldson, R. (2008). Petri
nets for systems and synthetic biology. In Interna-
tional school on formal methods for the design of com-
puter, communication and software systems, pages
215–264. Springer.
Heiner, M., Herajy, M., Liu, F., Rohr, C., and Schwarick,
M. (2012). Snoopy–a unifying petri net tool. In Ap-
plication and Theory of Petri Nets: 33rd International
Conference, PETRI NETS 2012, Hamburg, Germany,
June 25-29, 2012. Proceedings 33, pages 398–407.
Springer.
Heiner, M., Schwarick, M., and Wegener, J.-T. (2015).
Charlie–an extensible petri net analysis tool. In Ap-
plication and Theory of Petri Nets and Concurrency:
36th International Conference, PETRI NETS 2015,
Brussels, Belgium, June 21-26, 2015, Proceedings 36,
pages 200–211. Springer.
Heiner, M. and Sriram, K. (2010). Structural analysis to
determine the core of hypoxia response network. PloS
one, 5:e8600.
Herajy, M. and Heiner, M. (2018). Adaptive and bio-
semantics of continuous petri nets: Choosing the ap-
propriate interpretation. Fundamenta Informaticae,
160(1-2):53–80.
Hsu, E.-C., Kulp, S. K., Huang, H.-L., Tu, H.-J., Chao,
M.-W., Tseng, Y.-C., Yang, M.-C., Salunke, S. B.,
Sullivan, N. J., Chen, W.-C., et al. (2016). Integrin-
linked kinase as a novel molecular switch of the il-6-
nf-κb signaling loop in breast cancer. Carcinogenesis,
37(4):430–442.
Kohn, K. W., Riss, J., Aprelikova, O., Weinstein, J. N.,
Pommier, Y., and Barrett, J. C. (2004). Properties
of Switch-like Bioregulatory Networks Studied by
Simulation of the Hypoxia Response Control System.
Molecular Biology of the Cell, 15(7):3042–3052.
Lin, Q., Cong, X., and Yun, Z. (2011). Differential hy-
poxic regulation of hypoxia-inducible factors 1α and
2α. Molecular Cancer Research, 9(6):757–765.
Lu, X. and Kang, Y. (2010). Hypoxia and hypoxia-inducible
factors: master regulators of metastasis. Clinical can-
cer research, 16(24):5928–5935.
Majmundar, A. J., Wong, W. J., and Simon, M. C. (2010).
Hypoxia-inducible factors and the response to hy-
poxic stress. Molecular cell, 40(2):294–309.
Muz, B., de la Puente, P., Azab, F., and Kareem Azab, A.
(2015). The role of hypoxia in cancer progression, an-
giogenesis, metastasis, and resistance to therapy. Hy-
poxia, pages 83–92.
Orrantia-Borunda, E., Anchondo-Nu
˜
nez, P., Acu
˜
na-
Aguilar, L. E., G
´
omez-Valles, F. O., and Ram
´
ırez-
Valdespino, C. A. (2022). Subtypes of breast cancer.
Breast Cancer [Internet].
Persad, S. and Dedhar, S. (2003). The role of integrin-
linked kinase (ILK) in cancer progression. Cancer
and Metastasis Reviews, 22:375–384.
Raja, R., Kale, S., Thorat, D., Soundararajan, G., Lo-
hite, K., Mane, A., Karnik, S., and Kundu, G.
(2014). Hypoxia-driven osteopontin contributes to
breast tumor growth through modulation of hif1α-
mediated vegf-dependent angiogenesis. Oncogene,
33(16):2053–2064.
Yu, Y., Wang, G., Simha, R., Peng, W., Turano, F., and
Zeng, C. (2007). Pathway Switching Explains the
Sharp Response Characteristic of Hypoxia Response
Network. PLOS Computational Biology, 3(8):e171.
Publisher: Public Library of Science.
ˇ
Sterberov
´
a, A., Dincu, A., Oudshoorn, S., van Duinen, V.,
and Cao, L. (2024). Modeling ipsc-derived endothe-
lial cell transition in tumor angiogenesis using petri
nets. In Proceedings of the 17th International Joint
Conference on Biomedical Engineering Systems and
Technologies, page 337–346. SCITEPRESS - Science
and Technology Publications.
BIOINFORMATICS 2025 - 16th International Conference on Bioinformatics Models, Methods and Algorithms
544
