
Analysis of 3D Urticaceae Pollen Classification Using Deep Learning
Models
Tijs Konijn*, Imaan Bijl*, Lu Cao†
a
and Fons Verbeek†
b
Leiden Institute of Advanced Computer Science, Leiden University, Einsteinweg 55, Leiden, The Netherlands
l.cao@liacs.leidenuniv.nl, {t.j.e.konijn, e.t.bijl}@umail.leidenuniv.nl, f.j.verbeek@liacs.leidenuniv.nl
Keywords:
Pollen Classification, Urticaceae Family, 3D Classification.
Abstract:
Due to the climate change, hay fever becomes a pressing healthcare problem with an increasing number of
affected population, prolonged period of affect and severer symptoms. A precise pollen classification could
help monitor the trend of allergic pollen in the air throughout the year and guide preventive strategies launched
by municipalities. Most of the pollen classification works use 2D microscopy image or 2D projection derived
from 3D image datasets. In this paper, we aim at using whole stack of 3D images for the classification and
evaluating the classification performance with different deep learning models. The 3D image dataset used in
this paper is from Urticaceae family, particularly the genera Urtica and Parietaria, which are morphologically
similar yet differ significantly in allergenic potential. The pre-trained ResNet3D model, using optimal layer
selection and extended epochs, achieved the best performance with an F1-score of 98.3%.
1 INTRODUCTION
Climate change results in warmer temperature which
induces higher amount of pollen production and
longer period of pollen season (D’Amato et al., 2020).
Pollen of different species vary in their allergenic
properties. The measured amount of pollen fur-
ther triggers severer allergic effect and becomes in-
creasingly concerned in healthcare worldwide. Since
pollen grains of various species possess different al-
lergenic properties, monitoring the species and the
amount of airborne pollen brings in-depth insight in
its correlation with the severity of symptoms that hay
fever patients experience (Li et al., 2023). Conse-
quently, pollen classification is a crucial step for air-
borne pollen monitoring. In palynology, pollen clas-
sification is mainly performed by highly skilled spe-
cialists. They manually classify and quantify pollen
grains using light microscopy (Barnes et al., 2023). It
is a time-consuming and sometimes error-prone pro-
cess since the pollen grains of different species may
show only subtle morphological differences (Li et al.,
2023). An automated pollen classification method is
very much needed to increase the efficiency and accu-
racy.
a
https://orcid.org/0000-0002-1847-068X
b
https://orcid.org/0000-0003-2445-8158
∗
These authors contributed equally to this study.
†
These authors are shared corresponding authors.
In recent years, machine learning and deep learn-
ing techniques have been used to tackle the challenge
of pollen classification. The research focus has been
on 2D classification. However, pollen grain is 3D
object by its nature. 3D classification models are
scarcely used in this field. When the specialists man-
ually identify pollen, they also go through the field of
depth in order to obtain a 3D impression of the pollen.
In this paper, we explore the possibility of using 3D
pollen images represented by a stack of 2D images
using widefield microscopy for pollen classification
and evaluate the classification performance between
different deep learning models.
2 RELATED WORK
There is a number of studies using state-of-the-art
deep learning classification models for pollen clas-
sification. Rostami et al. (Rostami et al., 2023)
applied various pre-trained CNN models, includ-
ing AlexNet (Krizhevsky et al., 2017), VGG16 (Si-
monyan and Zisserman, 2014), MobileNetV2 (San-
dler et al., 2018), ResNet (He et al., 2015), ResNeSt
(Zhang et al., 2020a), SE-ResNeXt (Hu et al., 2019),
and Vision Transformer (ViT) (Zhang et al., 2020b),
to classify pollen grains from the Great Basin Desert,
Nevada, USA. The dataset consisted of 10,000 im-
ages of 40 pollen species, and the ResNeSt-110 model
288
Konijn, T., Bijl, I., Cao, L. and Verbeek, F.
Analysis of 3D Urticaceae Pollen Classification Using Deep Learning Models.
DOI: 10.5220/0013102700003911
Paper published under CC license (CC BY-NC-ND 4.0)
In Proceedings of the 18th International Joint Conference on Biomedical Engineering Systems and Technologies (BIOSTEC 2025) - Volume 1, pages 288-295
ISBN: 978-989-758-731-3; ISSN: 2184-4305
Proceedings Copyright © 2025 by SCITEPRESS – Science and Technology Publications, Lda.

achieved the highest accuracy of 97.24%. They ob-
tained Z-stack images to capture spacial details of
pollen grains at different focus level. But the in-
put is still a 224x224 sized 2D image. Daood et
al. used a seven layer CNN model to classify 30
pollen types with a rather small dataset: 1,000 sam-
ples from light microscopy and 1,161 from scanning
electron microscopy (SEM). They achieved a clas-
sification rate of approximately 94%(Daood et al.,
2016). Astolfi et al. provided a public annotated
pollen image dataset with 73 pollen categories from
the Brazilian Savanna (Astolfi et al., 2020). Eight
different CNN models are compared to setup a base-
line for pollen classification. These CNN models in-
clude DenseNet-201 (Huang et al., 2016), Inception-
ResNet-V2 (Szegedy et al., 2016), Xception (Chollet,
2016), Inception-V3 (Szegedy et al., 2015), VGG16,
VGG19, ResNet50 and NasNet (Zoph et al., 2017) .
The results showed that ResNet50 with an accuracy of
94.0% and DenseNet-201 with an accuracy of 95.7%
performed best. Zu et.al proposed a SwinTransformer
(Liu et al., 2021) based model for pollen classifica-
tion (Zu et al., 2024). In order to diminish the intro-
duced blurry effect during image resizing, Enhanced
Super-Resolution Transformer (ESRT) was used to
improve the sharpness of the resized images before
feeding them into SwinTransformer. The training data
consisted of 2D microscopic pollen images stained
with Fuchsin. During the experiments, they compared
their model with ViT, F2T-ViT (Duan et al., 2022),
Efficient-NetV2 (Tan and Le, 2021), ConvNeXt (Liu
et al., 2022), ResNet50, and ResNet34. When us-
ing their model on pre-trained weights, they achieved
highest F1-scores and accuracies for both local and
public datasets.
Most of the previously mentioned works, how-
ever, focus on 2D pollen classification. Several works
have presented to make a good use of spacial informa-
tion captured by z-stack microscopy images. Gallardo
et al. designed a multifocus pollen detection model
to both localize and classify pollen grains in one go
(Gallardo et al., 2024). They used object detection
models from Detectron library (Wu et al., 2019) to
identify pollen for each layer in a z-stack and used a
decision algorithm to assign a pollen grain to a class.
The two deep learning models they have tested are
RetinaNet (Lin et al., 2017) and Faster R-CNN (Ren
et al., 2015). The system was trained to recognize 11
pollen types acquired from light microscopy. They
were able to locate the pollen with 97.6% success
and these pollen could be classified with an accuracy
of 96.3%. Polling et al. used deep learning model
to classify pollen at genus level in the Urticaceae
family where it hardly can be distinguished (Polling
et al., 2021). They captured Z-stacks with 20 layers
of the pollen grains and simplified the 3D informa-
tion into a 2D image through projection techniques
to extract most important feature from z-stack im-
ages. These projections included Standard Deviation,
Minimum Intensity and Extended Focus. Several
classification models, such as VGG16, MobileNetV1
and MobileNetV2, were compared in the experiment.
The best performing models were MobileNetV2 and
VGG19 reached accuracies of 98.30 and 98.45 re-
spectively using 10-fold cross-validation. Li et al. fur-
ther compared machine learning and deep learning-
based methods for classifying pollen from the Ur-
ticaceae family (Li et al., 2023). Machine learning
methods required the selection of hand-crafted fea-
tures. These features were selected based on the ob-
servable biological differences between the species,
including size, shape and texture. The three dif-
ferent projections were fed into the models as sep-
arate channels. The deep learning methods gener-
ally outperformed the machine learning methods. The
highest-scoring deep-learning method was ResNet50
with 0.994 accuracy on 10-fold cross-validation. This
model was closely followed by VGG19 with 0.986
accuracy and MobileNetV2 with 0.985 accuracy.
In this paper, we used the raw cropped z-stack as
the input of the model, without applying decision al-
gorithm or projection. Our hypothesis is that, by us-
ing the z-stack images as a whole, a minimal amount
of information is lost. Additionally, the sequence or-
der of z-stack images may contain information that
would be lost during projecting the z-stack into 2D
space.
3 METHOD
3.1 Data Collection
The dataset is originally derived from the work of
Polling et al (Polling et al., 2021; Li et al., 2023).
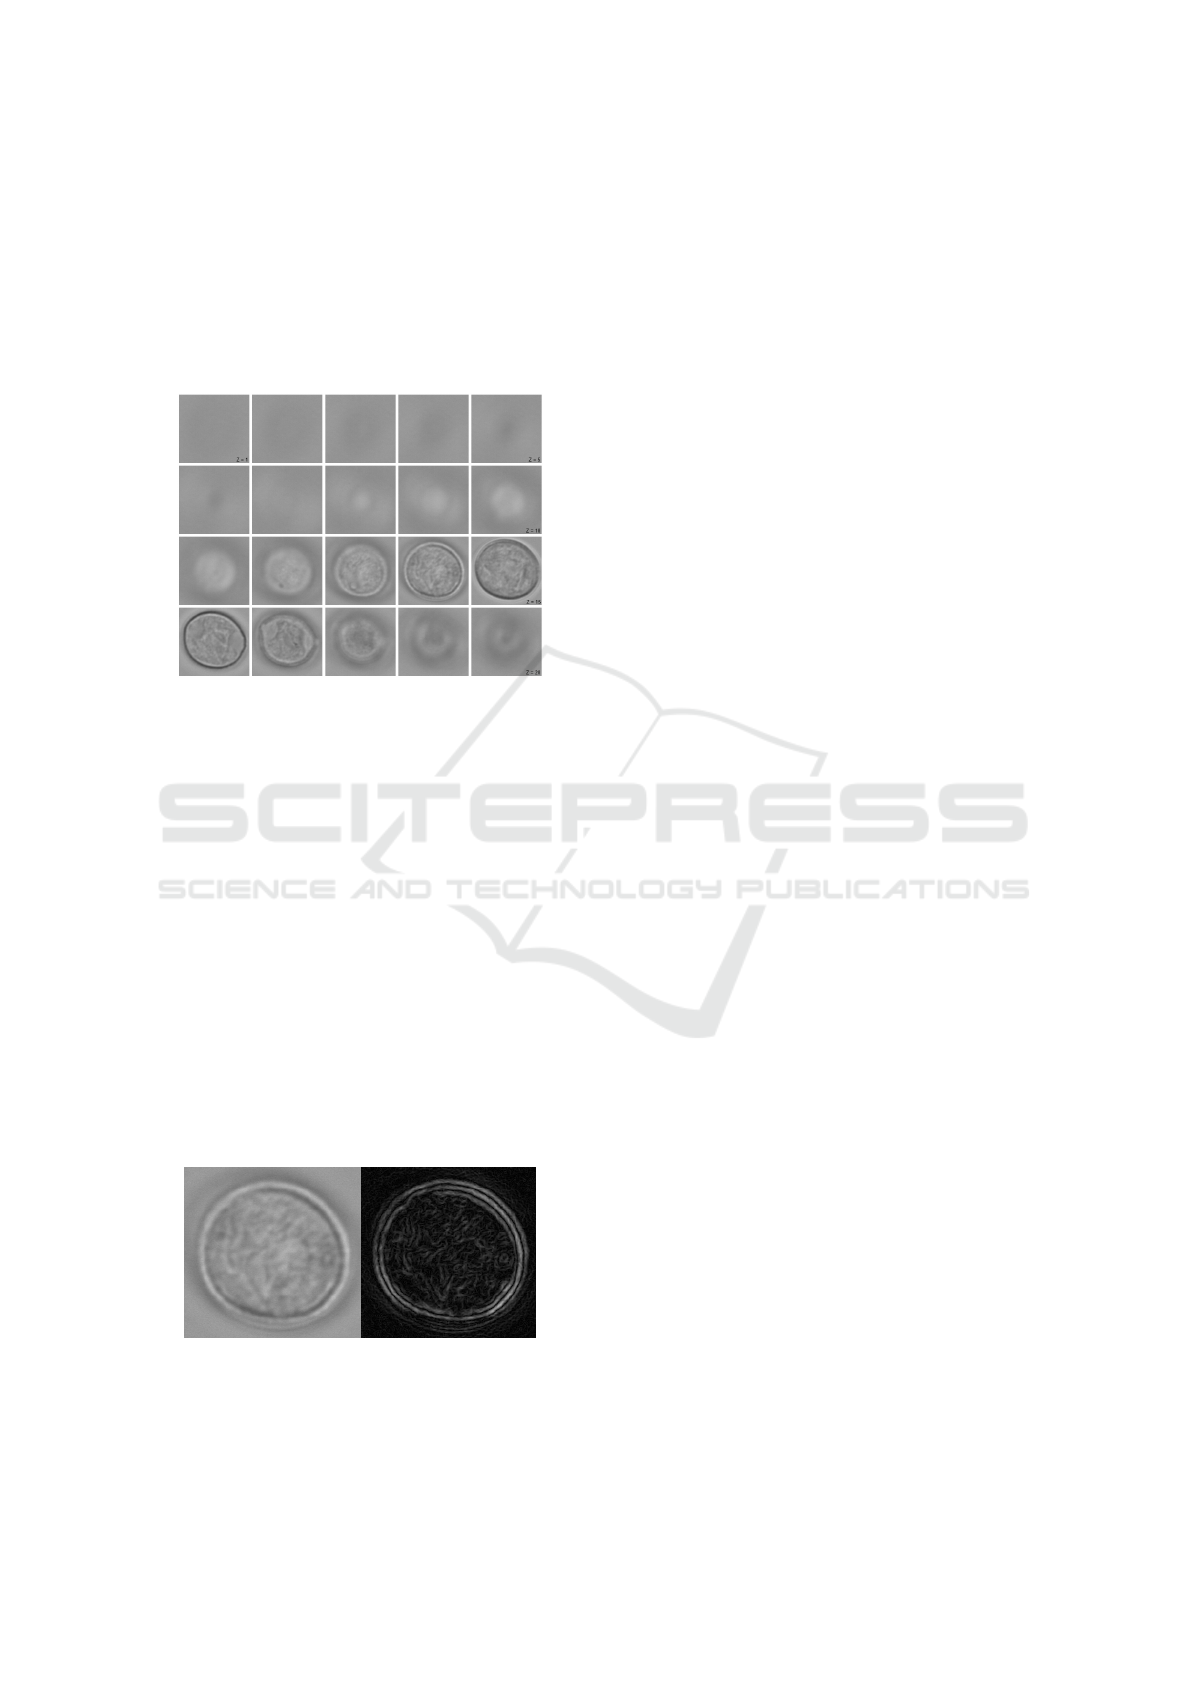
The data is kept in its 3D form that is 20 images in
a z-stack taken from different focus levels, as shown
in figure 1. The dataset incorporates five species from
two main genera of Urticaceae family. These are Ur-
tica and Parietaria. The two Species (Urtica urens, Ur-
tica dioica) from Urtica are grouped as the first class
and they are all low in allergic profile. However, The
two species (Parietaria judaica, Parietaria officinalis)
from Parietaria, as the second class, are highly aller-
gic and are the main cause of hay fever and asthma.
These two genera are hard to distinguish from mi-
croscopy and, therefore, challenging for image pollen
classification. The dataset also includes a third class
Analysis of 3D Urticaceae Pollen Classification Using Deep Learning Models
289
that is a specie from the genus Urtica called Urtica
membranacea. The reason for treating it as a single
class is because Urtica membranacea is morpholog-
ically highly distinguishable from other species be-
longing to aforementioned two genera. In total, 6472
pollen grains were collected and scanned. Each class
has about 2000 pollen grains from collection of wild
fresh plants so as to balance classes.
Figure 1: A z-stack example of pollen grain. The z-stack
contains 20 z-layers, with z-layer 1 on top left and z-layer
20 on bottom right.
3.2 Preprocessing
The z-stack images have the possibility to gain a bet-
ter classification accuracy because of the spacial de-
pendencies that can be captured in z direction. How-
ever, it also causes problems since some layers in z-
stack are out of focus. They may not contain much
useful information. In addition, the pollen grains re-
side at different depth level with varied size in z direc-
tion. It is not easy to define the focused subset of the
stack. Therefore, we firstly defined the central layer
of the stack as the layer that has the best focus level.
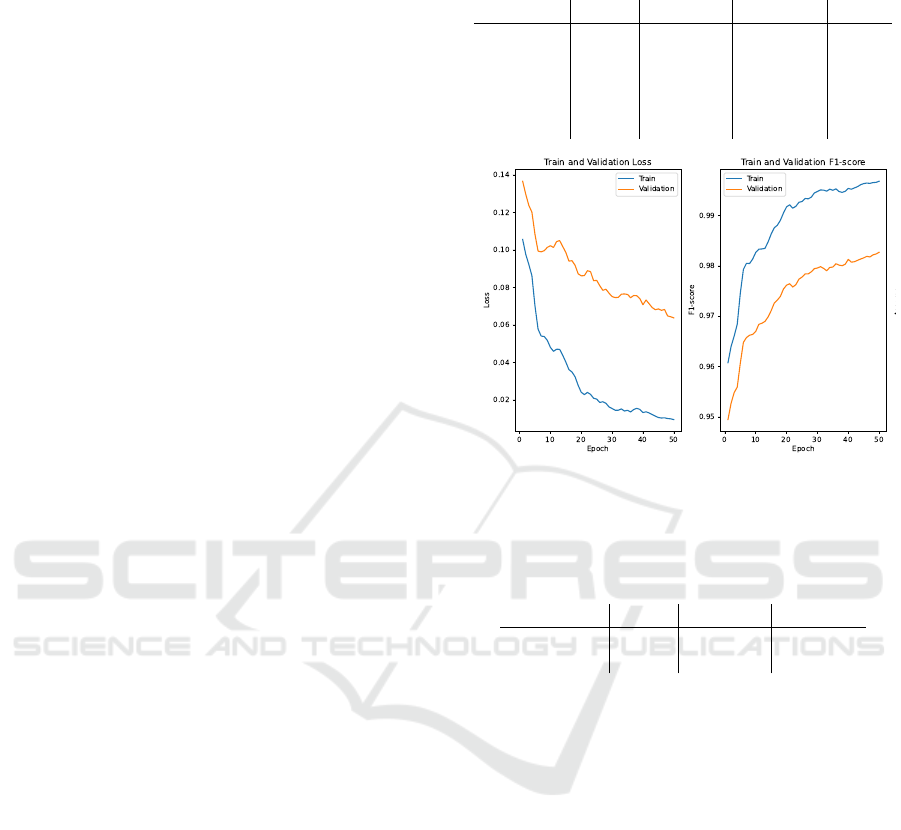
In our case, the sharpest image is found by measuring
edge strength that is derived from gradient magnitude
of Canny edge detection (Xuan and Hong, 2017) as
shown in Figure 2.
Figure 2: Example of edge detection on pollen grain. Figure
on the left side is the normal one layer image of a pollen
grain. On the right side is the result of edge detection.
Edge detection makes the central layer easy to
find. Different subset layer numbers are tested in this
paper to evaluate the change of classification perfor-
mance with different layer numbers.
The z-stack images in the dataset do not all have
the same size. We firstly sorted the images and ob-
tained the biggest image size. We used the biggest im-
age size of 224x224 pixels as the input size for deep
learning models. In order to import smaller images
into deep learning models with the same size, padding
step is applied. Average grayscale value of the image
is used to pad the edges of smaller images as shown
in Figure 2. The reason of choosing mean padding in-
stead of zero padding is to eliminate the influence of
introduced edge artifacts to the performance of pollen
classification.
3.3 Training
Since the pollen grains were collected from known
species, each palynological reference slide contains
pollen grains from a single specie. Thus, the ground
truth labels were created right after the microscopy
scanning. For training, the data is firstly split into
training, validation, and test sets. 10 % of the data
is kept as test set. We used 10-fold cross-validation
to evaluate the classification performance. At every
fold, a new training and validation split is used. The
training data is processed further with data augmen-
tation while the validation set is not processed. The
train/validation ratio is 9 to 1. The data augmenta-
tion is performed by vertically and horizontally flip-
ping the images to increase the diversity of the train-
ing dataset. Only horizontal and vertical flips were
performed so as to minimize the artifact introduction
to the training dataset.
We tested five 3D deep learning models for this
project. They are ResNet3D (Feichtenhofer et al.,
2018), MobileNetV2, SwinTransformer 3D (Yang
et al., 2023), the classification branches of RetinaNet
(Lin et al., 2017) and Faster R-CNN (Ren et al.,
2015). 18 layer Resnet3D model shows promising
pollen classification results in previous studies cf.
2. The default pre-trained weights were used. The
weights were obtained by pre-training the model on
two different datasets: the Kinetics (Carreira and Zis-
serman, 2017) and Sports-1M (Karpathy et al., 2014).
MobileNet is known for its light-weighted structure.
It has been carefully evaluated for pollen classifica-
tion (Polling et al., 2021; Li et al., 2023). We used
MobileNetV2 because it can use different input layer
size. We used 3D MobileNetV2 implemented by
K
¨
op
¨
ukl
¨
u, et al. (K
¨
op
¨
ukl
¨
u et al., 2019). Swintrans-
former is a representative model from vision trans-
BIOIMAGING 2025 - 12th International Conference on Bioimaging
290
formers, characterized by its hierarchical structure us-
ing shifted windows. In this study, SwinTransformer
3D is used. Two object detection models are included
in the evaluation as well since they have been reported
to work well for pollen identification and classifica-
tion. We only tested their classification branches in
this study. RetinaNet consists of a feature pyramid
network (FPN) backbone on top of a feed forward
ResNet architecture. The ResNet architectures used
here are ResNet50 and ResNet3D, since they allow
for 3D input. Compared to RetinaNet, Faster R-CNN,
depending on region proposal network, has a higher
identification performance of pollen grains but a bit
higher inference time (Gallardo et al., 2024). The
same backbones as RetinaNet are used for Faster R-
CNN.
Pytorch library is used to evaluate 3D deep learn-
ing models. Pytorch has ready-made 3D CNN models
that can be imported and has data augmentation. Py-
torch also allows for GPU acceleration which is nec-
essary for deep learning models that are computation-
ally very expensive. The time that it takes for a model
to complete one epoch was measured on a NVIDIA
RTX 4070Ti GPU. This GPU has 12GB of VRAM.
For all models we use metrics: accuracy, loss, and
F1 score of the model to evaluate the performance.
4 RESULTS
4.1 Optimal Number of Layers
The number of layers in a z-stack were evaluated to
observe if it makes a difference in classification per-
formance. We have tested the subsection of layers for
4, 6, 8 and 20 which is the total amount of the z-stack.
The results, summarized in table 1, showed that the
increase of layer numbers do not assure a better clas-
sification performance. Increasing the amount of lay-
ers only resulted in a 0.02 increase of accuracy from 6
layers to 10 layers. The sudden decline in accuracy at
20 layers and the fact that the model does not stagnate
has been a reason to test the model with more epochs.
Remainder of the research was performed with 6 op-
timal layers instead of the 10 layers, because we have
shown that improvement is marginal and extra time is
needed for training with 4 extra layers.
4.2 Increasing Amount of Epochs
In order to examine if the learning curves from
ResNet3D stagnate, 50 epochs of the model with 6
optimal layers was performed.
Table 1: ResNet3D model testing performance with varied
number of layers. Time: time for one epoch in seconds.
Layers loss F1-score accuracy Time
4 layers 0.055 0.980 0.980 90
6 layers 0.052 0.981 0.981 92
8 layers 0.050 0.980 0.980 92
10 layers 0.046 0.983 0.983 93
20 layers 0.069 0.977 0.977 97
Figure 3: These graphs represent the pre-trained ResNet3D
model with 6 optimal layers and 50 epochs. On the test set
this model achieved a F1-score of 0.982 and a loss of 0.053.
Table 2: ResNet3D model testing performance difference
between 30 and 50 epochs.
ResNet3D loss F1-score accuracy
30 epochs 0.052 0.981 0.981
50 epochs 0.053 0.982 0.982
We can observe from Figure 3 that an increase in
epochs only marginally improves the accuracy with
0.01 for 20 extra epochs. This can also be seen in table
2. The small increase in accuracy makes the trade-off
with 20 extra epochs not necessary.
4.3 Comparison of Deep Learning
Models
During the comparison, we have given attention to the
performance as well as the efficiency of the models.
We need a model that is efficient and precise to clas-
sify pollen from large amount of microscopy images.
For each model, we start from the hyperparamters that
are the optimal set for ResNet3D as shown in Table 3.
We adjust the hyperparamters accordingly in order to
find the optimal hyperparamters for each model in our
comparison.
The ResNet3D was evaluated on pre-trained and
non pre-trained situation. Compared to the non pre-
trained model, the pre-trained model performs signif-
icantly better with a F1-score of 98.1%. The time
Analysis of 3D Urticaceae Pollen Classification Using Deep Learning Models
291
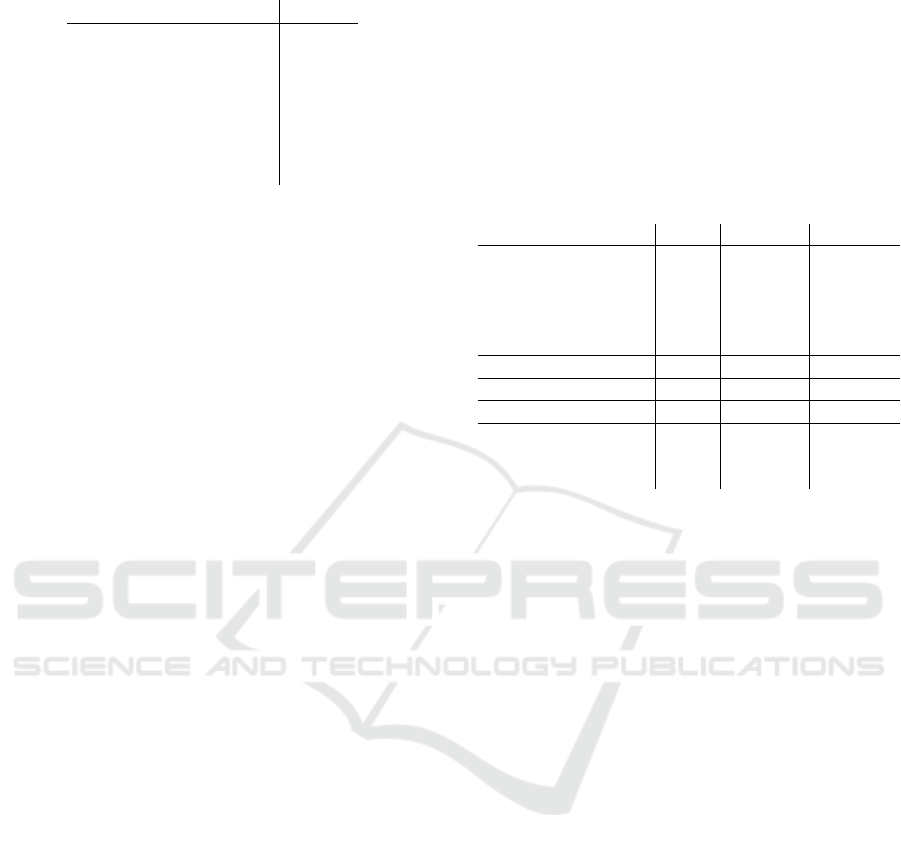
Table 3: hyperparameters setting.
hyper-parameter value
folds 10
epochs 30
learning rate 0.0001
augmentation threshold 0.5
number of layers 6
training batch size 16
validation batch size 16
for both models to train was almost the same, around
92 seconds per epoch. For MobileNetV2 3D, we ad-
justed the hyper-parameters for learning rate ([0.001,
0.0001, 0.00001]), augmentation threshold ([0.1, 0.2,
0.5, 0.7]) and batch size ([16, 20, 50, 70]). We
observed that the hyper-parameters listed in Table
3 are the optimal parameters for MobileNetV2 3D
training from scratch. However, the hyperparameters
slightly changed for pre-trained MobileNetV2 3D,
where learning rate is 0.001, augmentation threshold
is 0.2 and batch size for validatation is 20.
For the 3D Swintransformer model, the hyper-
parameters for the number of attention heads and win-
dow size were used default. There were no pre-trained
weights available. Therefore, the Swintransformer
3D was trained from scratch. We adjusted learning
rate, augmentation threshold, batch size in the same
ranges to obtain the best performance. At the end, we
used the same learning rate and augmentation thresh-
old but different batch size of 50 for training and 20
for validation.
Faster R-CNN was trained on the ResNet50 back-
bone first. However, it took 10 minutes to train
one epoch. Compared to 100 seconds to train for
ResNet3D model in Table 1, it took much longer time
and resulted in training five hours for one fold out
of 10-Fold cross validation. Furthermore, this model
was only able to achieve an F1-score of 94.3% on the
test set after 30 epochs. It needs much more epochs
before the results achieve the same performance as
ResNet3D. Therefore, Faster R-CNN with ResNet50
is not included in the following comparison. Faster
R-CNN model with ResNet3D backbone is a lot bet-
ter compared to the ResNet50 backbone version. The
model achieved a F1-score of 0.979, an accuracy of
0.979 with a loss of 0.072. The model took 115 sec-
onds per epoch to train. We used the same hyperpa-
rameters as ResNet3D.
The last model to be tested was RetinaNet. First a
pre-trained ResNet50 backbone model was compared
to a non pre-trained model. Both of the models stag-
nate after 20 epochs, however the pre-trained model
has a significantly higher F1-score. Subsequently, it
was tested if an increase in the total epochs would
make a difference for the ResNet50 backbone. The
only difference that we observed is the decrease of
loss. Therefore, it is not necessary for the model to be
trained with 50 epochs. We also compared between
different backbones for RetinaNet. Unlike the Faster
R-CNN model, RetinaNet with ResNet50 backbone
was a lot faster. Therefore a comparison can be made
as shown in Table 4.
Table 4: Classification performance comparison between
models. * means Pre-trained model.
Model loss F1-score accuracy
ResNet3D 0.112 0.959 0.959
ResNet3D* 0.052 0.981 0.981
MobileNetV2 0.131 0.959 0.959
MobileNetV2* 0.073 0.974 0.974
Swintransformer 3D 0.286 0.924 0.924
Faster R-CNN with
RestNet3D* 0.072 0.979 0.979
RetinaNet with
ResNet50 0.151 0.954 0.954
ResNet50* 0.134 0.965 0.965
ResNet3D* 0.060 0.978 0.978
5 DISCUSSION AND
CONCLUSION
The primary objective of this study was to enhance the
classification accuracy of pollen in Urticaceae family
using deep learning techniques, specifically leverag-
ing 3D convolutional neural networks (3D CNNs).
This was motivated by the need for precise identi-
fication of pollen grains due to their varying aller-
genic potential, which is crucial for environmental
and health monitoring.
The implementation of edge detection to identify the
best focal point significantly contributed to the im-
proved classification accuracy. By focusing on the
image layer with the highest intensity change, the
model could utilize the most informative features of
the pollen grains. This preprocessing step mitigated
the issue of blurry layers and ensured that the input to
the neural network was of the good quality, thereby
enhancing the model’s ability to learn and distinguish
between different pollen types.
Incremental improvements in model performance
were observed with the optimization of layer selec-
tion and an increase in the number of epochs. How-
ever, the enhancements were marginal, suggesting
that the models had already achieved near-optimal
performance using the given list of hyperparameter
settings as shown in Table 3. Through empirical eval-
uation, six layers were chosen as the optimal sub-
BIOIMAGING 2025 - 12th International Conference on Bioimaging
292

set for further analysis. This decision was based on
the trade-off between performance gain and compu-
tational efficiency. The results showed that increas-
ing the number of layers from six to ten yielded only
a marginal improvement in F1-score and accuracy
(from 98.1% to 98.3%), while 22% extra time was
needed for these 4 extra layers.
The research further focused on comparing differ-
ent 3D deep learning models, including ResNet3D,
MobileNetV2 3D, Swin Transformer, Faster R-CNN,
and RetinaNet, with particular attention to the perfor-
mance of the ResNet50 and ResNet3D backbones for
the object detection models. The models were trained
and tested on a dataset consisting of 6472 pollen stack
images, each captured with 20 slices along the Z-axis.
We conclude that pre-trained ResNet3D alone per-
forms the best with F1-score of 0.981 and a loss of
0.052. Faster R-CNN and RetinaNet with pre-trained
RestNet3D are the second and third positions with F1-
score of 0.979 and 0.978 respectively. However, the
study utilized pre-trained weights for several models,
which were derived from datasets like Kinetics (Car-
reira and Zisserman, 2017)and Sports-1M (Karpathy
et al., 2014). While these weights helped accelerate
training and improve accuracy, they are optimized for
video or action recognition tasks rather than pollen
images. This mismatch might limit the models’ abil-
ity to fully capture domain-specific features, leaving
room for further improvement with domain-specific
pre-training.
The MobileNetV2 model performs reasonably
well, considering its light weight and few parameters.
Using MobileNetV2 for pollen classification could be
desirable if reducing computational cost is a special
requirement. The pre-trained MobileNetV2 outper-
forms the model trained from scratch by 1.5 percent.
Interestingly, the hyper-parameter settings working
the best for the model trained from scratch are not
those resulting the best for the pre-trained model. The
pre-trained model benefits more from a higher learn-
ing rate. It is probably because the model already
captured general features from a large dataset. Ad-
ditionally, the model does not suffer from a destabi-
lized learning process, which is often a result of a high
learning rate. The pre-trained model is already close
to a optimal performance. Therefore, faster adjust-
ments are beneficial (Smith and Topin, 2017). The
MobileNetV2 does not seem to benefit from longer
training, suggesting the model over-fits on the train-
ing data when trained for 50 epochs.
Swin Transformer 3D did not reach to an optimal
performance in the evaluation partially because of the
lack of pre-trained weights available for this model.
However, when the models were trained from scratch,
Swin Transformer performs worse than ResNet3D
and MobileNetV2. Swintranformer benefits from
larger data size which cannot be met in our case. Its
architecture, with complex attention mechanisms and
hierarchical processing units, makes it more sensitive
to limited dataset. In addition, Swin Trainsformer
did not benefit from longer training, suggesting over-
fitting when trained on 50 epochs.
The ResNet3D backbone demonstrated superior
performance compared to the ResNet50 backbone,
achieving an F1-score and accuracy of 97.8% on the
test set with RetinaNet. However ResNet3D classifi-
cation model performed better compared to the ob-
ject detection and classification models. Resnet3D
achieved an F1-score and accuracy of 98.3% when
trained with 10 optimal layers. This indicates the effi-
cacy of 3D convolutional neural networks (CNNs) in
capturing spatial features from stack images, which
is critical for distinguishing between morphologically
similar pollen grains.
The close F1 score and accuracy in our compari-
son of models indicate a balanced performance across
both precision and recall, suggesting that the model is
equally effective at correctly identifying true positives
and minimizing false positives. Such balance is cru-
cial in applications like pollen classification, where
both the presence of pollen and the correct identifi-
cation of its type are important for accurate environ-
mental monitoring and allergen forecasting.
Despite the promising results achieved in this
study, the previous research by Chen Li et al. (Li
et al., 2023) demonstrated slightly better perfor-
mance. Their approach, which utilized projection
technique combined with various deep learning archi-
tectures, achieved an accuracy of 99.4% in classifying
Urticaceae pollen. This underscores the potential for
further optimization in our methods, possibly by inte-
grating additional preprocessing techniques or refin-
ing the neural network architectures to match or sur-
pass the results.
6 FUTURE WORK
This research has ample possibilities to work on in the
future. Currently the optimal focal layer selection is
not always entirely correct. If an optimal focal layer is
close to the top or bottom layers and the total amount
of subset layers is set too high, it will deviate the fo-
cal layer from the central position. This could have
an impact on the performance of 3D CNNs. In addi-
tion, if we have sufficient computation power in the
future, the necessity of finding the optimal focal lay-
ers should be evaluated. Therefore, further research
Analysis of 3D Urticaceae Pollen Classification Using Deep Learning Models
293

should look into the improvement of heuristics and
possibility of making better 3D data.
In addition, the scope of pollen classification
could be expanded to include a wider variety of pollen
families beyond Urticaceae. Investigating the appli-
cation of 3D CNNs to other pollen types could val-
idate the generalizability and robustness of the pro-
posed methodology. This expansion would involve
collecting and annotating new datasets from differ-
ent plant families, which may present unique chal-
lenges in terms of morphological diversity and data
complexity. Additionally, understanding the specific
allergenic properties of various pollen families would
further enhance the practical applications of these
models in environmental health and allergen forecast-
ing. Instead of widefield microscopy, confocal laser
scanning micrsocpy (CLSM) is a good option provid-
ing baseline on pollen morphology and nuclei stained
with DAPI.
REFERENCES
Astolfi, G., Gonc¸alves, A. B., Menezes, G. V., Borges, F.
S. B., Astolfi, A. C. M. N., Matsubara, E. T., Alvarez,
M., and Pistori, H. (2020). POLLEN73S: An image
dataset for pollen grains classification. Ecological in-
formatics, 60:101165.
Barnes, C. M., Power, A. L., Barber, D. G., Tennant,
R. K., Jones, R. T., Lee, G. R., Hatton, J., Elliott,
A., Zaragoza-Castells, J., Haley, S. M., Summers,
H. D., Doan, M., Carpenter, A. E., Rees, P., and Love,
J. (2023). Deductive automated pollen classification
in environmental samples via exploratory deep learn-
ing and imaging flow cytometry. New Phytologist,
240(3):1305–1326.
Carreira, J. and Zisserman, A. (2017). Quo Vadis, Action
Recognition? A New Model and the Kinetics Dataset.
arXiv (Cornell University).
Chollet, F. (2016). Xception: Deep learning with depthwise
separable convolutions.
Daood, A., Ribeiro, E., and Bush, M. (2016). Pollen grain
recognition using deep learning. In Bebis, G., Boyle,
R., Parvin, B., Koracin, D., Porikli, F., Skaff, S., En-
tezari, A., Min, J., Iwai, D., Sadagic, A., Scheidegger,
C., and Isenberg, T., editors, Advances in Visual Com-
puting, pages 321–330, Cham. Springer International
Publishing.
Duan, K., Bao, S., Liu, Z., and Cui, S. (2022). Exploring
vision transformer: classifying electron-microscopy
pollen images with transformer. Neural Computing
and Applications, 35(1):735–748.
D’Amato, G., Chong-Neto, H., Monge Ortega, O., Vitale,
C., Ansotegui, I., Rosario, N., Haahtela, T., Galan,
C., Pawankar, R., Murrieta-Aguttes, M., Cecchi, L.,
Bergmann, C., Ridolo, E., Ramon, G., Gonzalez Diaz,
S., D’Amato, M., and Annesi-Maesano, I. (2020). The
effects of climate change on respiratory allergy and
asthma induced by pollen and mold allergens. Allergy,
75:2219–2228.
Feichtenhofer, C., Fan, H., Malik, J., and He, K. (2018).
Slowfast networks for video recognition.
Gallardo, R., Garc
´
ıa-Orellana, C. J., Gonz
´
alez-Velasco,
H. M., Garc
´
ıa-Manso, A., Tormo-Molina, R., Mac
´
ıas-
Mac
´
ıas, M., and Abeng
´
ozar, E. (2024). Automated
multifocus pollen detection using deep learning. Mul-
timedia tools and applications.
He, K., Zhang, X., Ren, S., and Sun, J. (2015). Deep resid-
ual learning for image recognition.
Hu, J., Shen, L., Albanie, S., Sun, G., and Wu, E. (2019).
Squeeze-and-excitation networks.
Huang, G., Liu, Z., van der Maaten, L., and Weinberger,
K. Q. (2016). Densely connected convolutional net-
works.
Karpathy, A., Toderici, G., Shetty, S., Leung, T., Suk-
thankar, R., and Fei-Fei, L. (2014). Large-scale video
classification with convolutional neural networks. In
Proceedings of the IEEE Conference on Computer Vi-
sion and Pattern Recognition (CVPR).
K
¨
op
¨
ukl
¨
u, O., Kose, N., Gunduz, A., and Rigoll, G. (2019).
Resource efficient 3d convolutional neural networks.
Krizhevsky, A., Sutskever, I., and Hinton, G. E. (2017). Im-
agenet classification with deep convolutional neural
networks. Commun. ACM, 60(6):84–90.
Li, C., Polling, M., Cao, L., Gravendeel, B., and Verbeek,
F. (2023). Analysis of automatic image classification
methods for urticaceae pollen classification. Neuro-
computing, 522:181–193.
Lin, T.-Y., Goyal, P., Girshick, R., He, K., and Doll
´
ar, P.
(2017). Focal loss for dense object detection.
Liu, Z., Lin, Y., Cao, Y., Hu, H., Wei, Y., Zhang, Z., Lin, S.,
and Guo, B. (2021). Swin transformer: Hierarchical
vision transformer using shifted windows.
Liu, Z., Mao, H., Wu, C.-Y., Feichtenhofer, C., Darrell, T.,
and Xie, S. (2022). A convnet for the 2020s.
Polling, M., Li, C., Cao, L., Verbeek, F., de Weger, L., Bel-
monte, J., De Linares, C., Willemse, J., de Boer, H.,
and Gravendeel, B. (2021). Neural networks for in-
creased accuracy of allergenic pollen monitoring. Sci-
entific Reports, 11:11357.
Ren, S., He, K., Girshick, R., and Sun, J. (2015). Faster
r-cnn: Towards real-time object detection with region
proposal networks.
Rostami, M. A., Balmaki, B., Dyer, L. A., Allen, J. M.,
Sallam, M. F., and Frontalini, F. (2023). Efficient
pollen grain classification using pre-trained Convolu-
tional Neural Networks: a comprehensive study. Jour-
nal of big data, 10(1).
Sandler, M., Howard, A., Zhu, M., Zhmoginov, A., and
Chen, L.-C. (2018). Mobilenetv2: Inverted residuals
and linear bottlenecks.
Simonyan, K. and Zisserman, A. (2014). Very deep convo-
lutional networks for large-scale image recognition.
Smith, L. N. and Topin, N. (2017). Super-convergence:
Very fast training of neural networks using large learn-
ing rates. arXiv preprint arXiv:1708.07120. Preprint.
Work in progress.
BIOIMAGING 2025 - 12th International Conference on Bioimaging
294

Szegedy, C., Ioffe, S., Vanhoucke, V., and Alemi, A. (2016).
Inception-v4, inception-resnet and the impact of resid-
ual connections on learning.
Szegedy, C., Vanhoucke, V., Ioffe, S., Shlens, J., and Wojna,
Z. (2015). Rethinking the inception architecture for
computer vision.
Tan, M. and Le, Q. V. (2021). Efficientnetv2: Smaller mod-
els and faster training.
Wu, Y., Kirillov, A., Massa, F., Lo, W.-Y., and Girshick, R.
(2019). Detectron2.
Xuan, L. and Hong, Z. (2017). An improved canny edge
detection algorithm. In 2017 8th IEEE International
Conference on Software Engineering and Service Sci-
ence (ICSESS). IEEE.
Yang, Y.-Q., Guo, Y.-X., Xiong, J.-Y., Liu, Y., Pan, H.,
Wang, P.-S., Tong, X., and Guo, B. (2023). Swin3d: A
pretrained transformer backbone for 3d indoor scene
understanding.
Zhang, H., Wu, C., Zhang, Z., Zhu, Y., Lin, H., Zhang, Z.,
Sun, Y., He, T., Mueller, J., Manmatha, R., Li, M., and
Smola, A. (2020a). Resnest: Split-attention networks.
Zhang, H., Wu, C., Zhang, Z., Zhu, Y., Lin, H., Zhang, Z.,
Sun, Y., He, T., Mueller, J., Manmatha, R., Li, M., and
Smola, A. (2020b). Resnest: Split-attention networks.
Zoph, B., Vasudevan, V., Shlens, J., and Le, Q. V. (2017).
Learning transferable architectures for scalable image
recognition.
Zu, B., Cao, T., Li, Y., Li, J., Ju, F., and Wang, H.
(2024). Swint-srnet: Swin transformer with image
super-resolution reconstruction network for pollen im-
ages classification. Engineering Applications of Arti-
ficial Intelligence, 133:108041.
Analysis of 3D Urticaceae Pollen Classification Using Deep Learning Models
295
