
Assessing the Influence of a CADx Scheme on Radiologists' Analysis
of Breast Nodules in Digital Mammography Using Specialized
Feedback Software
Homero Schiabel
a
, Fernanda J. F. Cardoso
b
and Joyce M. Palotti
c
São Carlos School of Engineering, University of São Paulo, Dept. of Electrical and Computer Engineering,
Av. Trabalhador Sao-Carlense 400, 13566-590, Sao Carlos (SP), Brazil
Keywords: CADx Scheme, Digital Mammography, Image Perception and Analysis.
Abstract: The study main purpose is to address the effectiveness of a computer-aided diagnosis (CADx) scheme
developed to assist radiologists in evaluating nodules in digital mammography images. Unlike traditional
CADe systems, which focus primarily on detection, this scheme offers interpretative support, providing
additional diagnostic insights for more accurate decisions. This work presents a custom evaluation software
designed to facilitate the testing of the CADx scheme influence on radiologists´opinion by allowing them to
assess mammograms independently, register their initial opinions, review the CADx output, and log their final
decisions. Through this software the study involved radiologists analysing mammograms before and after
reviewing the CADx-generated data. The results showed a scheme positive influence on diagnostic accuracy.
Radiologists who used the CADx data exhibited in average improved sensitivity and specificity rates, with an
overall reduction in error rates, for the images set under investigation. Although the scheme is still a research
prototype, it demonstrates strong potential for broader application in clinical practice, offering efficiency and
cost-effectiveness, especially for screening operations. The procedure described in this work indicates that,
despite the need for some fine-tuning, particularly in minimizing false positives, our CADx system shows
promise as a supplemental diagnostic tool that could enhance radiologists´performance.
1 INTRODUCTION
It is well known that hundreds of computer-aided
detection (CAD) schemes have been used all over the
world. The CAD scheme performance should not be
equal or better than the radiologists’ one; but the
result provided by such a scheme should be useful to
the radiologist in determining the diagnosis as well as
aiding in improving the performance in detecting
suspect signals in mammography (Doi, 2004).
Despite this, as stressed by (Karssemeijer, 2011), a
decrease in works searching for improvements in
CAD algorithms has been observed. In fact, most of
radiologists using this technique consider that there is
a need of many improvements and, although
generally satisfied with CAD performance in
detecting clustered microcalcifications, they are less
a
https://orcid.org/0000-0002-7014-948X
b
https://orcid.org/0000-0002-1309-8313
c
https://orcid.org/0009-0003-7222-5591
confident in mass detection (Karssemeijer, 2011).
False positive detections are the main concern in most
of these cases, which are considered the main cause
for radiologists confusion or time-consuming visual
analysis (Gillies, Kinahan and Hricak, 2016; Katzen
and Dodelzon, 2018).
Screening programs are also “modeling” CAD
schemes technology, so that commercial CAD
systems users are instructed to apply them as a
checker to avoid missing signals, but not as an
interpretation aid tool. Many perception studies have
demonstrated that the most of errors in diagnosis are
due to an examiner insufficient capability in
interpreting suspected regions already detected
(Karssemeijer, 2011; Kooi, Mordang and
Karssemeijer, 2017). Therefore an important
consideration should be stressed: the issue related to
the findings classification in CADx schemes.
296
Schiabel, H., Cardoso, F. J. F. and Palotti, J. M.
Assessing the Influence of a CADx Scheme on Radiologists’ Analysis of Breast Nodules in Digital Mammography Using Specialized Feedback Software.
DOI: 10.5220/0013104700003911
Paper published under CC license (CC BY-NC-ND 4.0)
In Proceedings of the 18th International Joint Conference on Biomedical Engineering Systems and Technologies (BIOSTEC 2025) - Volume 1, pages 296-302
ISBN: 978-989-758-731-3; ISSN: 2184-4305
Proceedings Copyright © 2025 by SCITEPRESS – Science and Technology Publications, Lda.

In clinical practice there are some radiologists
using CAD schemes as an aid in interpretation when
familiar with the technique. However, many other
specialists hesitate to use this technology, due to
considerable false positive rates. Even so,
observations we have made of experienced
radiologists have shown that they tend to be more
receptive to CAD in assisting their analyses,
primarily because they consider useful the provided
quantitative data on density and other findings – as
well as the likelihood of corresponding to a given
category (Schiabel, Matheus and Verçosa, 2014).
The current model of our CADx scheme is based
in these features (Matheus and Schiabel, 2013;
Schiabel et al., 2012). The main characteristic is that
it represents not an automatic diagnosis computer
system in mammography, but a supplemental
information system for the medical report. In a
previous work (Matheus, Gonçalves and Schiabel,
2015) we have shown and discussed the evaluation of
one of the modules of our CADx scheme – the mass
segmentation evaluation – comparing the module
results with experienced radiologists interpretation.
The evaluation was essentially the comparison
between the classification of nodules contours given
by the scheme and that considered by the radiologists
in order to check not only the level of efficacy of the
automatic classification, but also to show how this
result can influence the radiologist evaluation.
Considering the separation between benign and
malignant signals at classifying the nodule contour,
the results have indicated 82 % of agreement between
CADx and radiologists (Matheus, Gonçalves and
Schiabel, 2015). As a consequence of this research,
we introduced another investigation into the analysis:
how much this CADx scheme can aid the diagnostic
accuracy? This led to the development of a single
application, that we called “Driven CADx”, in order
to determine whether or not a given detected nodule
was clinically suspicious (Schiabel et al., 2012;
Schiabel, Matheus and Cardoso, 2023). The use of
this app was proposed as a CADx tool to help the
radiologist more immediately during the analysis of a
mass detected in the exam, providing information on
the classification of the structure as suspicious or not,
working as a kind of second opinion.
Therefore, by using the “Driven CADx” app
(Schiabel et al., 2012; Schiabel, Matheus and
Cardoso, 2023), a test scheme to answer the previous
question about its influence on the radiologist
performance was designed. Procedures involve firstly
classifying detected masses in a selected digital
mammograms set by using the app, and registering
the result. Considering a number of collaborators
radiologists, the images set was then introduced set in
order to get their opinion about the suspiciousness
rate of each case. In conclusion, the radiologist final
opinion was registered, after knowing the CADx
evaluation result.
However, as one major issue is usually getting the
radiologist to carry out this visual analysis in the
laboratory, we have developed a simple software to
assist in performing such a test so that the procedures
can be made by the radiologist at his own workplace
(for example, in the reporting room at a hospital or
radiology clinic). The software design, the test
scheme methodology and results are described in the
next sections.
2 METHODOLOGY
The software design to gather the radiologists’
opinion on the detected masses in digital
mammograms was directed by a senior radiologist
collaborator of our group. The procedure is based on
a semi-automatic process, considering the following
model: from a selected region of interest in the image,
the evaluator performs his visual analysis and
produces information whether or not the detected
mass is a suspicious signal. Next, the result provided
by the Driven CADx analysis is shown to the observer
who is asked whether considers – based on such an
information – to maintain or change the previous
opinion. All these results – from the isolated CADx
analysis, from the isolated observer analysis, and
from the observer final opinion after knowing the
CADx evaluation – are registered to proceed with the
statistical investigation.
The current version of this scheme was developed
using a Java tool and the Macros programming
language of the free software ImageJ
(https://imagej.nih.gov) and made intuitive for
generic users. The main requirement for its use is to
have ImageJ installed on the computer where the
evaluation will be carried out. To enable the
evaluation, first, a folder is created containing the
entire set of images (in DICOM files) that will be part
of the process, in addition to a blank text file for
recording the information regarding the evaluation
data. Prior to the medical visual analysis, the
complete set of digital mammographic images is
submitted to the Driven CADx scheme application
developed (Schiabel et al., 2012; Schiabel, Matheus
and Cardoso, 2023) so that the evaluations of each
case are recorded in a single text file.
The evaluation procedure in the main program
requests firstly the folder where the images to be
Assessing the Influence of a CADx Scheme on Radiologists’ Analysis of Breast Nodules in Digital Mammography Using Specialized
Feedback Software
297

analyzed are stored. Then, it requests subsequently
the location of: (a) the text file with the recorded data
from Driven CADx evaluation; and (b) the name of
the text file to record all the evaluation results. After
that, the software immediately shows in the display
the first image of the set with a delimited mass. In a
checking box superimposed on the image, the
observer will be able to choose one of two options
according to his opinion about the selected region:
suspicious or non-suspicious mass. Depending on the
option chosen, the software checks whether the
information is identical or conflicts with that
produced by the Driven CADx application on that
case, alerting the observer.
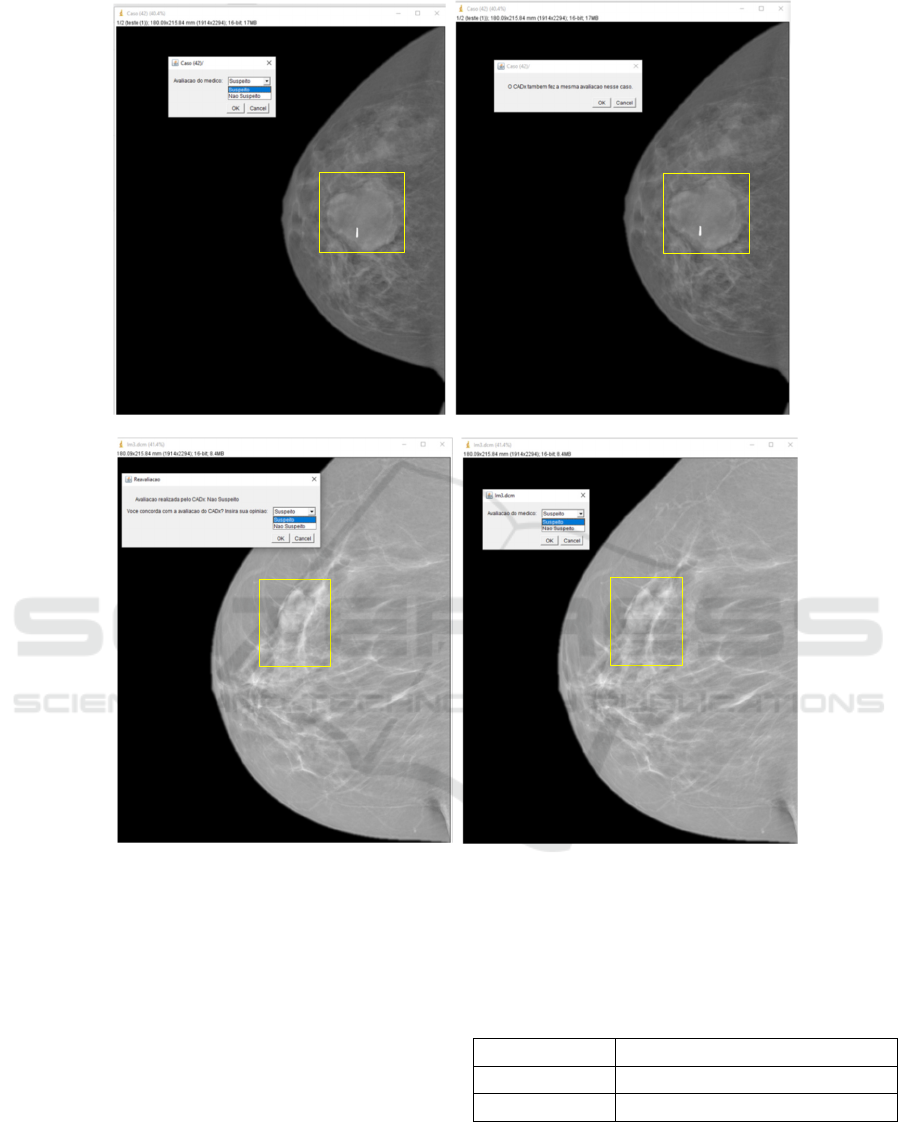
If the medical opinion is the same as that from the
CADx, the information “The CADx also made the
same assessment in this case” appears and then it will
display the next image in the set. Otherwise, the
software returns information that the CADx
evaluation was different, asking the observer the
agreement with such an evaluation. At this point, the
observer will be able to mark in the corresponding
checking box the final opinion (which may or may not
be different from the first one, once the image is re-
analyzed based on the discordant information from
the CADx). With the new record, the software thus
proceeds to the next image successively until the end
of the folder images set. Fig. 1 illustrates some
screens snapshots of this process, in which an image
is shown and, superimposed on it, the window with
the information or options described above.
When the process ends, i.e, all the images in the
folder are evaluated, the outcome text file has
registered all the opinions gathered during the
analysis for each image: (a) the Driven CADx
evaluation; (b) the observer original opinion and (c)
the observer final opinion – after knowing the CADx
evaluation. These data can be then organized and
confronted with the true classification (based on the
confirmed reports given by an experienced
radiologist/breast specialist) of each case as this
information is saved separately.
3 EXPERIMENTAL ANALYSIS
AND RESULTS
3.1 Images Set
Digital mammography images composing the
database to be evaluated were obtained from exams
performed in a GE Senographe Essential
mammography unit. All of the cases were previously
diagnosed according to the BIRADS standard by an
expert radiologist, who provided information on the
characteristics and location of detected nodules.
These data were our ground truth for the statistical
analysis on sensitivity, specificity and accuracy rates
regarding the Driven CADx application results as
well as the evaluators opinions given during the
experimental evaluation procedure.
A total of 70 images were selected to form the
folder to be managed during the tests. All of them
presented one delimited mass to be analyzed by the
CADx scheme and by the observer. All the images
files were saved in tiff format, keeping the original
image characteristics (12-bit contrast resolution,
0.1mm spatial resolution in the for presentation
image file, for example).
After applying the Driven CADx scheme to all the
selected ROIs in the set, a file with its classification
was saved. This file, together with the folder with the
images and the management program described in the
previous section were recorded in the computer at the
radiology reporting room at a local hospital. Such a
computer is coupled to a 5MP EIZO Radiforce
display used to the visual analysis of the digital
mammography images.
3.2 Images Evaluations
A group of 10 collaborators proceeded with the
analysis by using the evaluation program. Table 1
describes the main categorization of each one.
All of them used the program to register their
opinion on each image (or each delimited ROI on the
images) as a suspect or not suspect nodule. The
average time expended to the evaluation was about
15-20 min by observer. From observations during the
tests, we could conclude that no one showed
difficulties in using the program or performing the
evaluation as determined by the program steps.
Table 1: Categorization of evaluation collaborators.
(1)
Mammography specialist radiologist (> 20 y.)
(2)
Mammography specialist radiologist (> 20 y.)
(3)
Mammography specialist radiologist (> 20 y.)
(4)
General radiolo
g
ist
(
> 10
y
.
)
(5)
General radiolo
g
ist
(
> 10
y
.
)
(6)
General radiolo
g
ist
(
> 10
y
.
)
(7)
General radiologist (> 10 y.)
(8)
Mammograph
y
specialist (> 20 y.)
(9)
Mammograph
y
specialist (> 20 y.)
(10)
Mammo
g
ra
p
h
y
s
p
ecialist
(
> 20
y
.
)
BIOIMAGING 2025 - 12th International Conference on Bioimaging
298
(a) (b)
(c) (d)
Figure 1: Screens shown by the software developed to gather the radiologist opinion in a semi-automatic way: (a) and (b)
image with a checking box for marking the nodule evaluation as well as the report from the human analysis, indicating that it
is an identical result produced by the evaluation of the CADx scheme; (c) another image with the same opinion choice box,
but with an indication in (d) that the CADx assessment is discordant – and the option to keep or not the original choice.
3.3 Data Analysis
From the data recorded in the experiments, the
statistical analysis is shown in Tables 2-4, with the hit
rates regarding the Driven CADx scheme and the
group of evaluators.
It is interesting to note, in relation to Table 2, that
the Driven CADx scheme exhibits accuracy patterns
for the digital image set that align with its previous
performance (Matheus, Gonçalves, and Schiabel,
Table 2: Performance of the Driven CADx scheme with the
images set used in the test.
Nodules Number of correct classifications
Not suspect 28/35 (80,0%)
Suspect 28/35 (80,0%)
2015), using the image database employed during its
development – digitized film images, particularly
from the DDSM database (Heath, M. et al., 2001).
Assessing the Influence of a CADx Scheme on Radiologists’ Analysis of Breast Nodules in Digital Mammography Using Specialized
Feedback Software
299

Table 3: Number of correct classifications for collaborator.
The column original indicates the hit rate regarding the first
opinion compared to the true information. The column after
CADx otherwise indicates the hit rate relative to final
opinion.
Evaluato
r
Ori
g
inal After CADx
(
1
)
66% 70%
(
2
)
67% 69%
(3) 71% 71%
(4) 69% 70%
(5) 67% 69%
(
6
)
74% 78%
(
7
)
56% 61%
(8) 67% 67%
(9) 71% 77%
(10) 61% 63%
Average
67 (± 5.2)% 70 (± 5.3)%
In order to detail the individual rates with
correspondence to the number of true suspect and true
not suspect cases, Table 4 shows the sensitivity and
specificity rates – as well as the false positive and
false negative rates – determined for each evaluator.
The columns in Table 4 were divided into pre and
post corresponding rates, indicating the percentage of
correct classifications and errors, for both,
respectively, the first and the final opinion (after
knowing the CADx results). Data compared to the
ground truth information obtained for the entire set of
images when selected the cases and ROIs under
analysis.
Summarizing these cases, we noticed that, among
the 70 images (35 featuring suspicious nodules and
35 without), there were 27 instances where the
observer's perspective has changed as a result of
knowing the CADx evaluation: 22 “positive” changes
– corresponding to cases when the final opinion was
different from the first and matches with the true
classification – and only 5 “negative” ones,
attributable to false classification by the scheme. It
was also observed that there was not necessarily an
influence of the scheme on changing opinions for a
single particular image.
For only 3 images a change in the final opinion
occurred compared to the original assessment by two
different observers. This suggests a variability in the
images (and respective nodules) of the datasets used
in the evaluation process, indicating that the cases
selection helped avoid potential biases that could
impact the results and their analysis.
*
The percentile values given next to the columns
”Sensitivity (post)” and “Specificity (post)” represent
how much these respective rates have increased (in
average) in relation to those recorded for the observers
Table 4: Sensitivity (Sens.) and specificity (Spec.) rates for
each evaluator, along with their respective error rates (FP –
false positive; and FN – false negative).
O b s e r v e r (1) (2) (3) (4) (5)
Sens. (pre) (%)
71.4 60.0 51.4 62.8 74.3
Sens. (post) (%)
74.3 62.8 51.4 65.7 77.1
Spec. (pre) (%)
62.8 77.1 91.4 74.3 63.6
Spec. (post) (%)
65.7 77.1 91.4 74.3 63.6
FN (pre) (%)
28.6 40.0 48.6 37.1 25.7
FN (post) (%)
25.7 37.1 48.6 34.3 22.9
FP (pre) (%)
37.2 22.8 8.6 25.7 36.4
FP (post) (%)
34.3 22.8 8.6 25.7 36.4
O b s e r v e r (6) (7) (8) (9) (10)
Sens. (pre) (%)
91.4 71.4 48.6 60.0 74.3
Sens. (post) (%)
91.4 71.4 48.6 65.7 74.3
Spec. (pre) (%)
60.0 40.0 85.7 82.8 48.6
Spec. (post) (%)
65.7 48.6 85.7 88.6 51.4
FN (pre) (%)
8.6 28.6 51.4 40.0 25.7
FN (post) (%)
8.6 28.6 51.4 34.3 25.7
FP (pre) (%)
40.0 60.0 14.3 17.1 51.4
FP (post) (%)
34.3 51.4 14.3 11.4 48.6
Observer
Averages (±
SD) (%)
Increase
*
Sens. (pre)
66.6 (± 12.6) -
Sens. (post)
68.3 (± 12.5) (+1.7%)
Spec. (pre)
68.6 (± 16.5) -
Spec. (post)
71.2 (± 14.8) (+2.6%)
FN (pre) (%)
33.4 (± 12.6) -
FN (post) (%)
31.7 (± 12.5) (-1.7%)
FP (pre) (%)
31.4 (± 16.6) -
FP (post) (%)
28.8 (± 14.8) (-2.6%)
The automated analysis procedure yielded a
valuable dataset that allows for interpreting the
individualized behavior of the evaluators and how the
results of the Driven CADx system influenced their
opinions. Table 3 primarily focuses on the evaluators'
accuracy rate (regardless of whether it was a true
positive or negative), while Table 4 provides a more
detailed breakdown of individual behaviors.
Upon closer examination of the data in Tables 3
and 4, a few cases stand out:
- In Table 3, there is an increase in accuracy rates
for evaluators (1) and (2) (by 4% and 2%,
first opinion. The same values are shown next to the FN
(post) and FP (post) columns, but with opposite signal,
since they represent the respective reductions in these
rates as a consequence of those increases.
BIOIMAGING 2025 - 12th International Conference on Bioimaging
300

respectively); evaluator (3) did not show any
change in their accuracy rates, while evaluator
(6) recorded the highest accuracy rate, which
further increased by 4% after being informed of
the CADx results for each case. Evaluator (9)
exhibited the highest increase in accuracy rates
before and after being informed of the CADx
results (approximately 6%).
- In Table 4, there is an observed increase in both
sensitivity (positive cases) and specificity
(negative cases) by about 3% for evaluator (1)
when comparing the pre- and post-CADx data.
For evaluator (2), the same percentage increase
was recorded in sensitivity, though not in
specificity. For evaluator (6), who had the
highest overall accuracy rate among all
evaluators according to Table 3, this result could
be attributed to their sensitivity rate, which
remained unchanged after reviewing the CADx
data, in contrast to specificity, which increased
by approximately 6%. Finally, for evaluator (9),
who had been previously mentioned, their high
accuracy rate was associated with specificity
(83%). Nevertheless, both their sensitivity and
specificity rates increased after considering the
CADx data, by around 6%. And evaluator (3) is
confirmed not to have been influenced by the
CADx data, as none of their rates changed
before or after reviewing the corresponding
information.
The detailed results given in terms of sensitivity,
specificity and error rates, before and after the
observer being informed of the Driven CADx
application results, as shown in Table 4, indicates: (a)
that our software is able to aid in the mass
categorization, and (b) the overall positive influence
of this Driven CADx scheme on the observers
analysis, as there was an average increase of 2 to 3%
in both sensitivity and specificity rates (with a
proportional reduction in error rates) recorded for the
participant group in the evaluation process. As a next
step, more tests like these should be performed,
increasing the number of not only observers as well
as the images to be analysed.
4 CONCLUSIONS
We consider the primary contribution of this work to
be focused on two key aspects: the effectiveness of
the software developed to assess observer behavior in
the visual analysis of images for nodules
categorization, and the influence of our Driven CADx
scheme (Schiabel, Matheus and Cardoso, 2023)
on
the evaluators' classification regarding the suspicion
level of those same nodules. It is important to
highlight that the software enables the entire process
– image reading, initial classification, information on
CADx evaluation outcome, and final opinion
recording – to be carried out almost automatically by
the observer alone. Furthermore, the process
demonstrated that the Driven CADx application
performed as a diagnostic aid tool in mammography,
particularly in interpreting whether a finding is
suspicious – needing a further investigation – or not.
Unlike most schemes that focus on detection, the
interpretative approach of our system allows for a
more detailed evaluation of findings, providing a
more accurate suggestion for biopsy in cases with a
higher likelihood of malignancy.
Another important insight from the data,
particularly from Tables 3 and 4 (as discussed in the
previous section), is that the CADx results positively
influenced the radiologists' evaluations. In many
cases, the use of the system not only led to changes in
opinion but also resulted in an increase in accuracy
rates.
Although currently formatted as a research
prototype, the system has demonstrated efficiency,
with the potential not only to generate more extensive
results but also to support screening operations for
more routine cases. Standardizations developed
during the Driven CADx project have also
contributed to significant cost reductions – an
important concern for acquiring such commercial
systems in Brazil and many other countries. Despite
needing some adjustments, particularly to reduce
false positive rates, the tests have pointed to the
model’s feasibility.
ACKNOWLEDGEMENTS
The authors are grateful to FAPESP for the financial
support and to collaborators that kindly provided
evaluations of the images. We wish to thank also the
Management of Education & Research of University
Hospital of Federal University of Sao Carlos (SP,
Brazil) – Brazilian Company of Hospital Services
(EBSERH), as well as to Dr. Simone Elias, MD, for
her assistance and primary evaluations. Special
thanks to Dr. Luciana B. Verçosa, MD, and Oswaldo
Jorge Neto for their technical support.
Assessing the Influence of a CADx Scheme on Radiologists’ Analysis of Breast Nodules in Digital Mammography Using Specialized
Feedback Software
301

REFERENCES
Doi, K. (2004). Overview on research and development of
computer-aided diagnostic schemes. Seminars in
Ultrasound, CT and MRI, v. 25, p. 404-410.
Karssemeijer, N. (2011) Medical Physics Web review (ed.
Winter2011), p. 5.
Gillies RJ, Kinahan PE, Hricak H. (2016). Radiomics:
images are more than pictures, they are data. Radiology
278(2), p. 563-577.
Katzen J, Dodelzon K. (2018). A review of computer aided
detection in mammography. Clinical Imaging 52, p.
305-309. (doi:10.1016/j.clinimag.2018.08.014).
Kooi T, Mordang J-J, Karssemeijer N. (2017). Conditional
random field modelling of interactions between
findings in mammography. In Proc. of SPIE Medical
Imaging: Computer-aided Diagnosis, Orlando, FL,
USA. 10134, p. 101341E-1 - 101341E-8.
Schiabel, H.; Matheus, B. R. N.; Verçosa, L. B. (2014)
Evaluating a CADx scheme performance and its
influence on the radiologist report – in: Journal of the
Senologic International Society, v. 2, n. 2, SIS Journal
Special Issue (Proceedings 554-205-1-PB on line of
18
th
SIS World Congress on Breast Heathcare), SIS-
0786, p. 20.
Matheus, B. R. N.; Schiabel, H. (2013) A CADx scheme in
mammography: considerations of a novel approach –
7
th
International Conference on Advanced Engineering
Computing and Applications in Sciences, p. 15-18
(ISBN: 978-1-61208-290-5) – Porto, Portugal – Sep 29
– Oct 03, 2013.
Schiabel, H.; Matheus, B. R. N.; Verçosa, L. B.; Elias, S.;
Ribeiro, P. B. (2012) Investigations on a CADx scheme
in mammography: evaluating the influence of the
nodules contour classifier on radiologists analysis –
International Journal of Computer Assisted Radiology
and Surgery, Springer, v. 7, sup. 1, p. S258-S259. (doi:
10.1007/s11548-012-0734-1).
Matheus, B. R. N.; Gonçalves, S.; SchiabeL, H. (2015)
Automated mass classification in CADx
mammography scheme using density parameters. 17
th
International Workshop on Computer-Aided Diagnosis
(in 29th International Congress on Computer Assisted
Radiology and Surgery – CARS2015), IJCARS, v. 10,
suppl. 1, p. S286 – Barcelona, Spain, 24-27/06/2015.
Schiabel H., Matheus B.R.N., Cardoso F.J.F. (2023) Real
time mass classification for mammographic images: a
Driven CADx scheme. Brazilian Journal of Health
Review 6 (3): 13909-13927, (doi: 10.34119/bjhrv6n3-
429).
Heath, M. et al. The Digital Database for Screening
Mammography. (2001). Proc. Of the 5
th
International
Workshop on Digital Mammography, p. 212-218.
(ISBN 1-930524-00-5)
BIOIMAGING 2025 - 12th International Conference on Bioimaging
302
