
Data Clustering Using Mother Tree Optimization
Wael Korani
1
and Malek Mouhoub
2 a
1
University of North Texas, TX, Denton, U.S.A.
2
University of Regina, Regina, SK, Canada
Keywords:
Data Clustering, Metaheuristics, Swarm Intelligence.
Abstract:
Clustering is the process of dividing data objects into different groups called clusters, without prior knowl-
edge. Traditional clustering techniques might suffer from stagnation, where the solution is stuck in a local
optimum. In the last decade, many metaheuristics, including swarm intelligence, have been applied to address
the problem of clustering stagnation in a reasonable time. We propose a new clustering framework that is
based on metaheuristics and, more precisely, swarm intelligence optimization algorithms that include particle
swarm optimization (PSO) (Kennedy and Eberhart, 1995), whale optimization algorithm (WOA) (Mirjalili and
Lewis, 2016), bacterial foraging optimization algorithm (BFOA) (Das et al., 2009) and mother tree optimiza-
tion (MTO). To evaluate the performance of our framework and the new metaheuristic based on MTO called
CMTO, we conducted a set of experiments on eight different datasets and using four different metrics: rand
coefficient, Jaccard coefficient, distance matrix and running time. The results show that MTOC outperforms
BF and WOA in terms of random coefficient (accuracy) in five of the eight instances.
1 INTRODUCTION
Data clustering (Jain et al., 1999; Jain, 2010) is one
of the most successful unsupervised learning mod-
els used in data analysis. In the data clustering pro-
cess, similar objects are grouped in different groups
called clusters without any prior information about
the dataset. Clustering is used in many applications
such as bioinformatics, signal processing, text min-
ing, and medical images. In bioinformatics (Zou
et al., 2020), sequence clustering is used to develop
metagenomics and microbiomics. In signal process-
ing (Stolz et al., 2018), clustering is used to group
measurement data, particularly radar signals. In text
mining (Mehta et al., 2021), document clustering is
crucial as it helps to organize unstructured text data
into meaningful groups, making it easier to manage
and analyze. Information retrieval, topic discovery,
and text summarization can then be conducted effi-
ciently and accurately. In medical (Vasireddi and Sug-
anya Devi, 2021), medical images are clustered for
future prediction.
There are several different traditional cluster-
ing techniques including partitional, fuzzy, density-
based, and hierarchical methods. Partitional cluster-
ing (Celebi, 2014) techniques partition a given dataset
a
https://orcid.org/0000-0001-7381-1064
into clusters based on similarity measures between
objects. K-mean is one of the most successful parti-
tional clustering techniques (MacQueen et al., 1967),
where the number of clusters should be pre-defined.
In fuzzy clustering, data objects can be assigned to
multiple clusters (Bezdek, 1973). The fuzzy C-mean
algorithm is one of the most successful fuzzy cluster-
ing algorithms (Ji et al., 2014). Density-based cluster-
ing produces clusters as dense regions that are sepa-
rated by sparse areas (Li et al., 2020). This clustering
technique is very efficient in discovering the number
of clusters and identity noise. Hierarchical clustering
can be agglomerative or divisive and does not require
defining the number of clusters, such as single link-
age, average linkage, and complete linkage (Murtagh
and Contreras, 2012).
The clustering problem, especially k-means clus-
tering (Na et al., 2010), can be seen as an optimization
problem, where the goal is to partition a set of obser-
vations into K clusters such that the sum of squares
within the cluster (WCSS) is minimized. Clustering
is NP-hard in general, and in order to overcome the
exponential time cost in practice, we can rely on ap-
proximate methods such as the k-means clustering al-
gorithm.
Traditional clustering techniques are effective and
successful, but suffer from some limitations. These
Korani, W. and Mouhoub, M.
Data Clustering Using Mother Tree Optimization.
DOI: 10.5220/0013105300003893
In Proceedings of the 14th International Conference on Operations Research and Enterprise Systems (ICORES 2025), pages 215-220
ISBN: 978-989-758-732-0; ISSN: 2184-4372
Copyright © 2025 by Paper published under CC license (CC BY-NC-ND 4.0)
215
techniques depend on initialization parameters that
have a significant effect on their performance. In ad-
dition, these techniques suffer from stagnation that
causes them to be trapped in local minimum. More-
over, the performance of traditional clustering deteri-
orates with larger datasets due to the related computa-
tional costs. Finally, clustering methods do not work
well when the data set has overlapping areas.
To overcome the above limitations, we propose
a new clustering framework that relies on nature-
inspired techniques (Korani and Mouhoub, 2021;
Talbi, 2009). More precisely, we investigate sev-
eral population-based methods, including swarm in-
telligence optimization algorithms such as particle
swarm optimization (PSO), whale optimization algo-
rithms (WOA), bacterial foraging optimization algo-
rithm (BFOA) and a new method based on Mother
Tree optimization (MTO) (Korani et al., 2019). MTO
has proven to be effective when solving well-known
combinatorial problems such as the Traveling Sales-
man Problem (TSP) (Korani and Mouhoub, 2020b),
Constraint Satisfaction Problems (CSPs) (Korani and
Mouhoub, 2022a), configuration problems through
conditional constraints and qualitative preferences
(Korani and Mouhoub, 2022b), and weight tuning of
Deep Feedforward Neural Networks (DFNNs) (Ko-
rani and Mouhoub, 2020a).
Note that the application of population-based
metaheuristics has been reported in the literature.
In (Van der Merwe and Engelbrecht, 2003), the au-
thors introduced a hybrid clustering technique using
K-means and PSO. In (Wan et al., 2012), BFOA was
introduced to solve the clustering problem. In (Sh-
elokar et al., 2004), the ant colony optimization al-
gorithm was introduced for clustering. In (Nasiri
and Khiyabani, 2018), WOA has been adopted as the
metaheuristic clustering method.
To assess the practical performance of our frame-
work, we conducted a set of experiments on eight
different datasets, using four different metrics: rand
coefficient, Jaccard coefficient, distance matrix, and
running time. The results are reported and discussed.
2 PROPOSED DATA
CLUSTERING FRAMEWORK
2.1 Framework Description
There are many clustering techniques have been pro-
posed that are based on different optimization al-
gorithms such as (Van der Merwe and Engelbrecht,
2003; Wan et al., 2012; Shelokar et al., 2004; Nasiri
and Khiyabani, 2018). These clustering techniques
TMT
- - - - -
- - - - -
FPCTs
FCTs
LPCTs
No parents
Agents are arranged in descending order
based on their fitness value
Feeders
Non-feeders
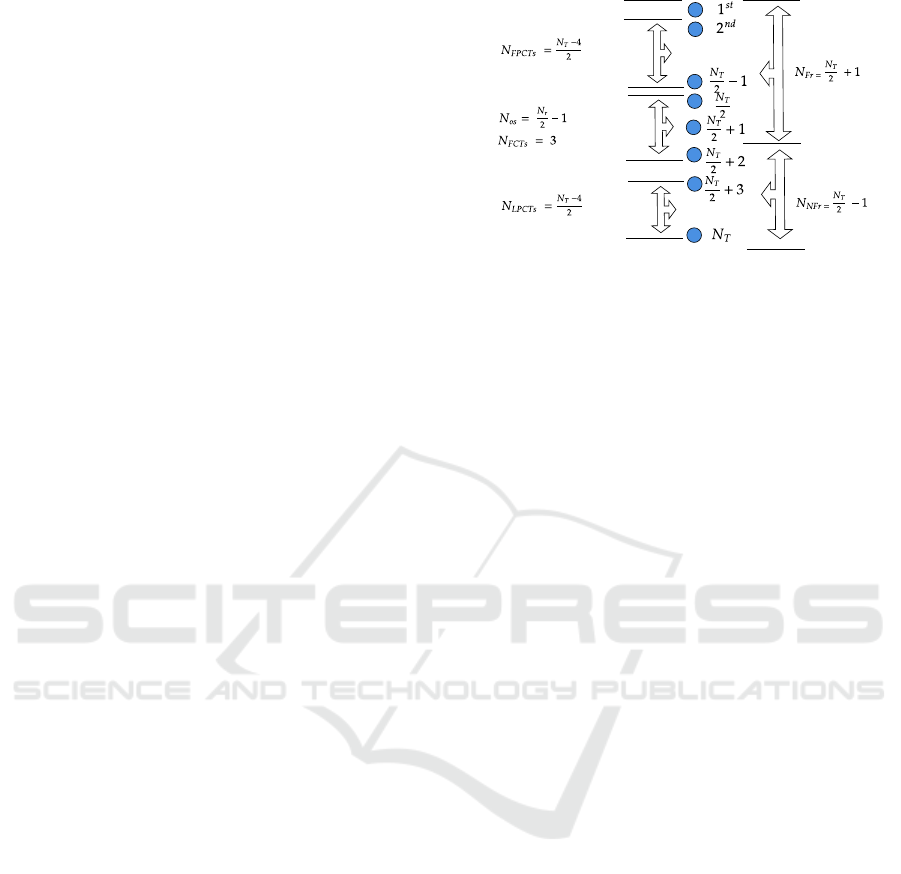
Figure 1: Fixed-Offspring Topology (Korani et al., 2019).
were proposed to avoid several limitations, among
them, stagnation and ruining time. We introduce
a new clustering framework that uses a population-
based metaheuristic to efficiently cluster a set of data.
The proposed clustering framework consists of
two modules: the optimizer and distance mod-
ules. The optimizer module includes population-
based metaheuristics, such as MTO or PSO, to gen-
erate a population of candidate solutions (agents or
particles). Each candidate solution (agent A
i
) is an in-
dependent clustering configuration with a given set of
centroids. Using the WCSS metric, the elbow method
is applied to find the optimal number of clusters (and
centroids).
The distance module will then compute the WCSS
(the sum of squares error or SSE) for each agent and
uses it as the fitness value. The population-based
method will then use the fitness values obtained for
the selection of the next population. The new pop-
ulation will then be modified using the operators of
the chosen nature-inspired technique and the fitness
values are again calculated using the WCSS metric.
2.2 Proposed Mother Tree Optimization
for Clustering (MTOC)
The details of the proposed MTOC is explained in
Algorithm 1. The proposed MTOC is built on the
MTO algorithm (Korani et al., 2019). The candi-
date solutions in MTO communicate according Fixed-
offspring (FO) topology as shown in Figure 1 (Korani
et al., 2019). The topology separates the agents into
the following three different groups, as stated in (Ko-
rani et al., 2019).
ICORES 2025 - 14th International Conference on Operations Research and Enterprise Systems
216

2.2.1 Top Mother Tree (TMT)
The TMT has two levels of search. First, it takes a
random move with a step size of δ, and the TMT’s
position is updated as follows (Korani et al., 2019):
P
1
(x
k+1
) = P
1
(x
k
) +δR(d), where R(d) =
R
√
R·R
⊺
, (1)
where R is a random vector, d is the dimension, and δ
is step size. In the second level, the TMT’s position is
updated as follows:
P
1
(x
k+1
) = P
1
(x
k
) + ∆R(d). (2)
where ∆ is a smaller step size.
2.2.2 Partially Connected Trees (PCTs)
PCTs group is divided into two subgroups First-PCTs
and Last-PCTs. In the first PCT, the agents are lo-
cated between the agent ranked 2 and
N
T
2
−1. Agents
in this subgroup update the their position as follows
(Korani et al., 2019):
P
n
(x
k+1
) = P
n
(x
k
) +
∑
n−1
i=1
1
n−i+1
(P
i
(x
k
) −P
n
(x
k
)), (3)
where N
T
is the population size, P
n
is position of an
agent n, and k is the iteration rank. In the Last-PCTs,
agents are located between agent ranked
N
T
2
+ 3 and
N
T
. Agents in this subgroups will update their posi-
tions as follows (Korani et al., 2019):
P
n
(x
k+1
) = P
n
(x
k
) +
∑
N
T
−N
os
i=n−N
os
1
n−i+1
(P
i
(x
k
) −P
n
(x
k
)). (4)
2.2.3 Fully Connected Trees (FCTs)
The agents in FCTs are located between the agents
ranked
N
T
2
and
N
T
2
+ 2. A member of this group up-
dates its position as follows (Korani et al., 2019):
P
n
(x
k+1
) = P
n
(x
k
) +
∑
n−1
i=n−N
os
1
n−i+1
(P
i
(x
k
) −P
n
(x
k
)). (5)
3 EXPERIMENTATION
3.1 Settings
To evaluate the performance of our proposed frame-
work, we conducted a set of experiments and report
the results in this section. In the experiments, MTOC
is compared to two other swarm intelligence-based
techniques: BFOA and WOA. The Euclidean distance
is used as a distance metric, and the experiments are
repeated 30 times with different seeds to avoid bias in
the results.
The three clustering techniques are evaluated us-
ing eight public benchmark data sets obtained from
the UCI repository (Dua and Graff, 2017). The data
1: Inputs:
t: Population size
d: Dataset
N: number of iterations
2: Initialize:
Distribute t agents over (P
1
, . . . , P
t
)
3: Evaluate:
Compute SSE (fitness) for P
1
. . . P
t
4: Sort P
1
. . . P
t
according to their respective
5: fitness value
6: For i = 1 to N
7: Use equations (1)–(5) to update the
8: position of each agent P
i
9: Evaluate SSE of the updated positions
10: Sort P
1
. . . P
t
in ascending order
11: Output:
Return the agent P
i
with the minimum
SSE
Algorithm 1: The MTOC algorithm.
sets are divided according to the number of samples
into small, medium, and large. In small datasets,
the number of examples is between 100 and 200. In
medium data sets, the number of samples is between
200 and 400, and in large data sets, the number of
samples is between 600 and 1500, as shown in Ta-
ble 1. A portion of these data sets was previously
used in (Wan et al., 2012; Wan et al., 2012) to evalu-
ate different other clustering techniques, including ant
colony and BFOA.
All three techniques are coded in MATLAB
R2024a and are executed on Windows 11 pro intel(R)
Core(TM) i9-14900F 2.00 GHz with 64 GB RAM.
The parameters of all three algorithms are tuned
to their best and listed in Table 2.
3.2 Evaluation Criteria
Several criteria have been designed to evaluate the
quality of clustering. These criteria include the Rand
Index (RI), the Jaccard coefficient (J), the distance in-
dex, the Davies-Bouldin Index (DBI) and Silhouette.
RI shows the degree of similarity between two
data clustering: the predicted clustering (percentage
of correct prediction) and the ground truth. More for-
mally, RI is defined as follows.
RI =
T P + T N
T P + FP + FN + T N
, (6)
T P (True Positives) is the number of pairs of data
points that are in the same cluster in both the predicted
and the ground truth cluster. T N (True Negatives)
is the number of pairs of data points that are in dif-
ferent clusters in both the predicted and the ground
Data Clustering Using Mother Tree Optimization
217

Table 1: Datasets describtions.
Dataset No. of Samples No. of Features clusters
zoo 101 16 7
Iris 150 4 3
Wine 178 13 3
Glass 214 9 6
Ionosphere 351 34 2
Balance 625 4 3
WBC 683 9 2
CMC 1473 9 3
Table 2: Parameter setting of BF, MTO, and WOA.
BF parameters
N
c
N
s
N
re
N
ed
Population size P
ed
No. of FEs
2 2 2 2 20 0.25 800
MTO parameters
φ δ ∆ Population size No. of FE
0.8 2.5 2.5 20 600
WOA parameters
A Population size No. of FEs
[2,0] 20 600
truth cluster. FP is the number of pairs of data points
that are in the same cluster in the predicted clustering,
but in different clusters in the ground-truth clustering.
FN is the number of pairs of data points that are in
different clusters in the predicted clustering, but in the
same cluster in the ground-truth clustering.
Compared to RI, the Jaccard coefficient (J) mea-
sures the similarity between the predicted and the
ground truth cluster by comparing the pairs of points
that are clustered together in both clusterings and the
pairs of points that are clustered differently. More for-
mally, the Jaccard coefficient is defined as follows.
J =
T P
T P + FP + FN
, (7)
Distance index (DI) is an internal property to com-
pute the ratio between intra-cluster and iter-cluster
distances as folllows:
DI =
average −intra
average −inter
. (8)
The intra-cluster distance is the distance between all
data points in a cluster and the centroid of this cluster.
The average intra-cluster is computed as follows:
average −intra =
1
n
K
∑
i=1
∑
x
j
∈C
i
x
j
−z
i
2
, (9)
where n is the total number of data points in the
dataset, K is the number of classes, z
i
is the centroid
of cluster C
i
.
The inter-cluster distance is the distances between
every two clusters. The average inter-cluster distance
is defined as follows:
average −inter =
1
K
∑
z
i
−z
j
2
, (10)
where, i ∈ [1
:
k −1] and j ∈ [i + 1
:
k]. The best clus-
tering technique is the one that maximizes DI.
3.3 Results and Discussion
The average and best values for the metrics RI, J,
and DI are listed in Table 3. The results show that
MTOC outperforms the other two algorithms in five
out of eight datasets in terms of average RI, followed
by BFOA in two datasets and WOA in one dataset.
MTOC has the best balance between exploration and
exploitation among other swarm intelligence tech-
niques due to the TMT which enhances the explo-
ration capability.
In terms of the average Jaccard index, MTOC out-
performs in four out of eight datasets, followed by
BFOA in two datasets, WOA in two datasets. Jaccard
index metric shows that MTO achieves good results
again in the similarity measure.
Finally, in terms of DI, MTO outperforms the
other two techniques in four out of eight datasets, fol-
lowed by BFOA in three datasets and WOA in one
dataset.
ICORES 2025 - 14th International Conference on Operations Research and Enterprise Systems
218

Table 3: The rand index, Jaccard index, and distance index for all datasets.
Dataset Size Method
For all runs
Best R Avg. R Best J Avg. J Best Dis Avg.
Dis
time
(sec)
Zoo
Low
MTOC 0.9543 0.8402 0.8351 0.5480 0.1399 0.3461 1.4242
BFC 0.9057 0.7988 0.6931 0.4465 0.2836 0.3844 1.6427
WOAC 0.9212 0.8235 0.7426 0.5051 0.0017 0.3881 1.6884
Iris
Low
MTOC 0.9417 0.8202 0.8375 0.6167 0.0234 0.1619 0.5580
BFC 0.8478 0.7660 0.6244 0.5454 0.0311 0.2466 0.7005
WOAC 0.9173 0.7695 0.7771 0.5505 0.0773 0.2313 0.4693
Wine
Low
MTOC 0.8396 0.6983 0.6207 0.4507 0.0570 0.8392 1.2185
BFC 0.7498 0.5184 0.5439 0.3741 0.0053 0.4400 1.3828
WOAC 0.7293 0.5271 0.5346 0.3778 0.0109 0.4132 1.1431
Glass
Medium
MTOC 0.6147 0.4862 0.3509 0.3064 0.0131 0.0641 2.0849
BFC 0.6223 0.4052 0.3400 0.2795 0.0029 0.0844 2.4677
WOAC 0.6091 0.4374 0.3382 0.2822 0.0671 0.1121 1.8735
Ionosphere
Medium
MTOC 0.6597 0.5765 0.5481 0.4372 1.4960 2.6493 0.9028
BFC 0.6663 0.5538 0.5625 0.5014 0.1044 1.2870 1.1327
WOAC 0.6565 0.5560 0.5653 0.4646 0.0000 4.9607 0.7540
Balance
High
MTOC 0.6403 0.5716 0.3608 0.2853 0.4427 0.8273 2.7511
BFC 0.6815 0.5795 0.4145 0.3056 0.4449 0.6915 3.3281
WOAC 0.6782 0.5779 0.4071 0.2967 0.5622 0.7815 2.3460
WBC
High
MTOC 0.9376 0.9182 0.8915 0.8621 0.3276 0.4267 1.6410
BFC 0.9514 0.8449 0.9142 0.7783 0.1476 0.5301 2.0989
WOAC 0.9514 0.9191 0.9145 0.8634 0.3660 0.5889 1.3694
CMC
High
MTOC 0.5174 0.4486 0.3348 0.2935 0.2612 0.9119 5.0657
BFC 0.5556 0.4569 0.3350 0.2913 0.0073 0.7536 6.6065
WOAC 0.5536 0.4512 0.3333 0.2962 0.1888 0.7572 4.4506
DI shows that all data points in the same cluster
are close to each other and away from other clusters.
The results show that the MTOC can handle different
data sets with different sizes.
4 CONCLUSION AND FUTURE
WORK
We propose a new clustering framework that is based
on population-based metaheuristics. In particular, we
used a variant of MTO (called MTOC) to enhance
the similarity between the predicted and ground-truth
clusterings. The performance of MTOC is assessed
through experiments on eight well-known datasets of
different sizes. The comparative results show that
MTOC outperforms BFOA and WOA in five out of
eight datasets in terms of average RI.
In the near future, MTOC will be evaluated on
more datasets. In this context, we will combine
MTOC with a feature selection technique that we
have proposed for clustering to address the curse
of dimensionality in large data sets (Gholami et al.,
2023).
We also plan to apply MTOC for image segmen-
tation as the initial results in preliminary experiments
are promising.
REFERENCES
Bezdek, J. C. (1973). Cluster validity with fuzzy sets.
Celebi, M. E. (2014). Partitional clustering algorithms.
Springer.
Das, S., Biswas, A., Dasgupta, S., and Abraham, A. (2009).
Bacterial foraging optimization algorithm: theoretical
foundations, analysis, and applications. Foundations
of computational intelligence volume 3: Global opti-
mization, pages 23–55.
Dua, D. and Graff, C. (2017). Uci machine learning reposi-
tory.
Gholami, M., Mouhoub, M., and Sadaoui, S. (2023). Fea-
ture selection using evolutionary techniques. In 2023
IEEE International Conference on Systems, Man, and
Cybernetics (SMC), pages 1162–1167.
Jain, A. K. (2010). Data clustering: 50 years beyond k-
means. Pattern recognition letters, 31(8):651–666.
Data Clustering Using Mother Tree Optimization
219

Jain, A. K., Murty, M. N., and Flynn, P. J. (1999). Data
clustering: a review. ACM computing surveys (CSUR),
31(3):264–323.
Ji, Z., Liu, J., Cao, G., Sun, Q., and Chen, Q. (2014). Ro-
bust spatially constrained fuzzy c-means algorithm for
brain mr image segmentation. Pattern recognition,
47(7):2454–2466.
Kennedy, J. and Eberhart, R. (1995). Particle swarm opti-
mization. In Proceedings of ICNN’95-international
conference on neural networks, volume 4, pages
1942–1948. ieee.
Korani, W. and Mouhoub, M. (2020a). Breast cancer di-
agnostic tool using deep feedforward neural network
and mother tree optimization. In International Confer-
ence on Optimization and Learning, pages 229–240.
Springer.
Korani, W. and Mouhoub, M. (2020b). Discrete mother
tree optimization for the traveling salesman prob-
lem. In Neural Information Processing: 27th Inter-
national Conference, ICONIP 2020, Bangkok, Thai-
land, November 23–27, 2020, Proceedings, Part II 27,
pages 25–37. Springer.
Korani, W. and Mouhoub, M. (2021). Review on nature-
inspired algorithms. In Operations research forum,
volume 2, page 36. Springer.
Korani, W. and Mouhoub, M. (2022a). Discrete mother tree
optimization and swarm intelligence for constraint
satisfaction problems. In International Conference
on Agents and Artificial Intelligence (ICAART 2022),
pages 234–241. INSTICC.
Korani, W. and Mouhoub, M. (2022b). Mother tree op-
timization for conditional constraints and qualitative
preferences. In 2022 IEEE Symposium Series on Com-
putational Intelligence (SSCI), pages 1610–1617.
Korani, W., Mouhoub, M., and Spiteri, R. J. (2019). Mother
tree optimization. In 2019 IEEE International Confer-
ence on Systems, Man and Cybernetics (SMC), pages
2206–2213. IEEE.
Li, H., Liu, X., Li, T., and Gan, R. (2020). A novel density-
based clustering algorithm using nearest neighbor
graph. Pattern Recognition, 102:107206.
MacQueen, J. et al. (1967). Some methods for classification
and analysis of multivariate observations. In Proceed-
ings of the fifth Berkeley symposium on mathematical
statistics and probability, volume 1, pages 281–297.
Oakland, CA, USA.
Mehta, V., Bawa, S., and Singh, J. (2021). Stamantic clus-
tering: combining statistical and semantic features for
clustering of large text datasets. Expert Systems with
Applications, 174:114710.
Mirjalili, S. and Lewis, A. (2016). The whale optimization
algorithm. Advances in engineering software, 95:51–
67.
Murtagh, F. and Contreras, P. (2012). Algorithms for hi-
erarchical clustering: an overview. Wiley Interdisci-
plinary Reviews: Data Mining and Knowledge Dis-
covery, 2(1):86–97.
Na, S., Xumin, L., and Yong, G. (2010). Research on k-
means clustering algorithm: An improved k-means
clustering algorithm. In 2010 Third International
Symposium on intelligent information technology and
security informatics, pages 63–67. Ieee.
Nasiri, J. and Khiyabani, F. M. (2018). A whale optimiza-
tion algorithm (woa) approach for clustering. Cogent
Mathematics & Statistics, 5(1):1483565.
Shelokar, P., Jayaraman, V. K., and Kulkarni, B. D. (2004).
An ant colony approach for clustering. Analytica
chimica acta, 509(2):187–195.
Stolz, M., Li, M., Feng, Z., Kunert, M., and Menzel, W.
(2018). High resolution automotive radar data cluster-
ing with novel cluster method. In 2018 IEEE Radar
Conference (RadarConf18), pages 0164–0168. IEEE.
Talbi, E. (2009). Metaheuristics: From design to implemen-
tation. John Wiley & Sons google schola, 2:268–308.
Van der Merwe, D. and Engelbrecht, A. P. (2003). Data
clustering using particle swarm optimization. In The
2003 Congress on Evolutionary Computation, 2003.
CEC’03., volume 1, pages 215–220. IEEE.
Vasireddi, H. K. and Suganya Devi, K. (2021). An
ideal big data architectural analysis for medical im-
age data classification or clustering using the map-
reduce frame work. In ICCCE 2020: Proceedings of
the 3rd International Conference on Communications
and Cyber Physical Engineering, pages 1481–1494.
Springer.
Wan, M., Li, L., Xiao, J., Wang, C., and Yang, Y. (2012).
Data clustering using bacterial foraging optimization.
Journal of Intelligent Information Systems, 38:321–
341.
Zou, Q., Lin, G., Jiang, X., Liu, X., and Zeng, X. (2020).
Sequence clustering in bioinformatics: an empirical
study. Briefings in bioinformatics, 21(1):1–10.
ICORES 2025 - 14th International Conference on Operations Research and Enterprise Systems
220
