
Enhanced Body Composition Estimation from 3D Body Scans
Boyuan Feng
1 a
, Yijiang Zheng
1 b
, Ruting Cheng
1 c
, Shuya Feng
2
, Khashayar Vaziri
3 d
and James Hahn
1 e
1
Department of Computer Science, George Washington University, Washington, DC, U.S.A.
2
Department of Computer Science and Engineering, University of Connecticut, Storrs, CT, U.S.A.
3
Department of Surgery, The George Washington University Medical Faculty Associates, Washington, DC, U.S.A.
{fby, yijiangzheng, rcheng77}@gwu.edu, Shuya.feng@uconn.edu, kvaziri@mfa.gwu.edu, jhahn@gwu.edu
Keywords:
3D Body Scanning, Body Composition, Lean Body Mass, Regression.
Abstract:
Accurate body composition assessment is essential for evaluating health and diagnosing conditions like sar-
copenia and cardiovascular disease. Approaches for accurately measuring body composition, such as Dual-
Energy X-ray Absorptiometry (DXA) and Magnetic Resonance Imaging (MRI), are precise but costly and
limited in accessibility. Some studies have explored predicting body composition by using shapes since 3D
scanning techniques allow for precise and efficient digital measurements of body shape. This study introduces
an enhanced method using 3D body scanning integrated with a part-to-global Multilayer Perceptron (MLP)
network that incorporates predefined high-level features for body composition prediction. For lean mass es-
timation, our method achieved a root mean square error (RMSE) of 2.85 kg. For fat mass estimation, the
RMSE was 2.50 kg, and for bone mineral content (BMC), the RMSE was 193.50 g. These results represent
substantial improvements over existing methods, highlighting the effectiveness and reliability of our approach
in accurately predicting body composition metrics.
1 INTRODUCTION
Accurate assessment of body composition is crucial
for evaluating nutrition status, diagnosing medical
conditions, and tailoring personalized healthcare in-
terventions (Thibault et al., 2012). Malnutrition, for
example, loss of lean body mass (LBM), is associ-
ated with age-related diseases such as Alzheimer’s
disease, brain atrophy, and sarcopenia (Pisciottano
et al., 2014; Werkstetter et al., 2012). Addition-
ally, central obesity has been shown to have a sig-
nificant association with all-cause mortality and in-
creased surgical risk, highlighting the importance of
accurate body composition analysis in both clinical
and surgical settings (Shi et al., 2024). Methods for
measuring these components, such as computerized
tomography (CT), Dual-Energy X-ray Absorptiome-
try (DXA), and Magnetic Resonance Imaging (MRI),
provide precise measurements but are often limited
a
https://orcid.org/0009-0008-7609-3801
b
https://orcid.org/0000-0002-1838-4423
c
https://orcid.org/0000-0002-1442-7166
d
https://orcid.org/0000-0003-3977-8891
e
https://orcid.org/0000-0001-6535-8175
by high costs, limited accessibility, and the poten-
tial risks associated with ionizing radiation (Albanese
et al., 2003; Cai et al., 2015; Borga et al., 2018;
Messina et al., 2020).
Bioelectrical impedance analysis (BIA) is favored
for its simplicity, cost-effectiveness, and convenience.
While being non-invasive and practical, BIA’s accu-
racy can be influenced by factors such as hydration
status, making it generally less precise than imaging
techniques (Andreoli et al., 2016). Numerous previ-
ous studies estimate body composition using conven-
tional anthropometric measurements, such as waist
circumference, waist-to-hip ratio, and skin-fold mea-
surements (Kuriyan, 2018; Wang et al., 2000). How-
ever, these manual measurements often lack the pre-
cision and consistency required for detailed body
composition analysis due to variations in measure-
ment techniques and measurement performing skills
(Mocini et al., 2023). Consequently, they do not meet
the necessary standards for daily monitoring (Cappel-
lari et al., 2023; Guarnieri Lopez et al., 2023).
3D optical scanning provides a more precise and
consistent method for capturing body shape, which
can be utilized to estimate various body compositions,
including lean mass (LM) and fat mass (FM) (Ng
Feng, B., Zheng, Y., Cheng, R., Feng, S., Vaziri, K. and Hahn, J.
Enhanced Body Composition Estimation from 3D Body Scans.
DOI: 10.5220/0013107000003911
Paper published under CC license (CC BY-NC-ND 4.0)
In Proceedings of the 18th International Joint Conference on Biomedical Engineering Systems and Technologies (BIOSTEC 2025) - Volume 1, pages 421-431
ISBN: 978-989-758-731-3; ISSN: 2184-4305
Proceedings Copyright © 2025 by SCITEPRESS – Science and Technology Publications, Lda.
421

et al., 2016). However, the complicated nature of hu-
man body shapes, along with the presence of noise
in 3D scans, make it difficult to employ 3D polygon
mesh directly for regression purposes (Zhang et al.,
2020; Bartol et al., 2021). A recent study explored
using 3D polygonal mesh to estimate body composi-
tion by leveraging a pre-trained network of 2D DXA
images but achieved suboptimal results (Leong et al.,
2024). With the advancement of transformer-based
models, a recent study has introduced an innovative
approach leveraging point cloud representation of 3D
body scans to achieve precise regional and global
body fat percentage predictions (Zheng et al., 2024).
Most research studies utilize 3D body shapes by em-
ploying feature extraction techniques to reduce the di-
mensions of the data.
High-level features such as height and body land-
marks can mitigate these challenges by extracting es-
sential information from 3D scans manually, making
data more manageable and reducing computational
demands (Zebari et al., 2020). These features are
more shape-aware and can improve the accuracy of
body composition estimates by focusing on the most
relevant aspects of body shape, filtering out noise and
irrelevant details (Chen et al., 2022). Models that use
high-level features are less likely to overfit given lim-
ited data, a common issue with medical datasets, mak-
ing the training process simpler and producing more
stable and reliable outcomes (Althnian et al., 2021).
Previous studies explored many high-level fea-
tures like level circumference, regional area, and vol-
ume (Ng et al., 2016). Some of these features, like
circumferences and BMI, are also widely used in clin-
ical settings (Thibault and Pichard, 2012). While con-
ventional features have been commonly used, they
may not fully capture the intricacies of body shape
variations. Therefore, it is important to explore more
meaningful descriptors in addition to level circumfer-
ences. Recent approaches also used automatic fea-
ture extraction techniques such as principal compo-
nent analysis (PCA) and 3D Autoencoders (3DAE),
demonstrating improved performance in body com-
position prediction (Tian et al., 2024).
In this study, we present a set of predefined high-
level features. We compare the performance contri-
bution of various combinations of these features and
concatenate them as a descriptor input to the model.
We also propose a Multilayer Perceptron (MLP) net-
work with a part-to-global constraint to ensure that lo-
cal features contribute effectively to the overall body
shape analysis. This method offers a more compre-
hensive representation of the 3D body shape for body
composition estimation, distinguishing it from tradi-
tional approaches that may rely on a small set of
anthropometric measurements. The experimental re-
sults show that our descriptors and network architec-
ture outperform other methods for estimating body
composition.
2 RELATED WORK
2.1 Traditional Methods for Body
Composition Estimation
Body composition describes the proportions of fat,
muscle, bone, and other tissues in the body (Toombs
et al., 2012). Traditional approaches for calculating
body composition often use compartmental models,
such as two-compartment (2-C), three-compartment
(3-C), and four-compartment (4-C) model (Kuriyan,
2018). DXA is an example of a 3-C model, which
evaluates FM, LM, and bone mineral content (BMC)
(Smith-Ryan et al., 2017). Many previous body com-
position prediction studies have used DXA as the gold
standard for its high accuracy and providing data on
total and regional fat percentages (Tian et al., 2020;
Lu and Hahn, 2019; Cichosz et al., 2021). In our
study, we also used the regional and total body com-
position values supplied by the DXA report as the
ground truth.
Tomographic imaging techniques, such as CT and
MRI, are available for assessing fat distribution but
should only be used for clinical indication to avoid
exposing the patient to repeated imaging and radia-
tion doses (van Beek and Hoffman, 2008). Ultra-
sound typically provides 2D slices and has emerged as
a prevalent method due to its cost efficiency (Cenic-
cola et al., 2019). Other methods for measuring
body composition, such as Hydrostatic Weighing
(also known as Underwater Weighing) and Air Dis-
placement Plethysmography (ADP), require special-
ized equipment or may cause discomfort for some
individuals (Schoenfeld et al., 2017). Manual an-
thropometry is the simplest way of assessing body
composition; however, 3D scanners have been proven
to provide more reliable and accurate results than
manual measurements in most studies while also be-
ing more cost-efficient than imaging techniques like
CT and DXA (Rumbo-Rodr
´
ıguez et al., 2021). This
makes 3D scanning technology an increasingly attrac-
tive option for routine body composition assessment.
BIOINFORMATICS 2025 - 16th International Conference on Bioinformatics Models, Methods and Algorithms
422

2.2 3D Scanning Technologies for Body
Composition Prediction
3D scanners are increasingly utilized for body mea-
surements due to their lower cost compared to tradi-
tional imaging methods and the absence of radiation
exposure, making them a safer and more affordable
option. Laser-based scanners are well known for their
precision and reliability and are the preferred choice
for 3D scanning projects such as the epicardial fat
thickness study on the CAESAR project (Lee et al.,
2015). Less costly systems like structured light offer
less precision and are employed in body fat prediction
study (Xu et al., 2009). Many current studies rely on
3D body scanners like FIT3D® and Styku® to pro-
vide body shape data for body composition analysis
(Tinsley et al., 2020). These scanners are also used in
medical research for applications such as obesity re-
search, posture analysis, and evaluation of growth and
development in pediatric populations (Kennedy et al.,
2022; Chi and Kennon, 2006).
The development in photogrammetry allows for
the generation of body shapes from a series of pho-
tographs, allowing low-cost and efficient tracking of
body shapes using a mobile phone application (Stark
et al., 2022). However, larger errors exist because
this technique can be affected by changes in pose
and lighting conditions (Tinsley et al., 2024). In
this study, we used a dataset captured by commodity
RGB-D cameras, deformable registration techniques
are utilized to align the scans accurately with a canon-
ical body model, as described in Yao et al.’s work on
non-rigid 3D human body surface reconstruction (Lu
et al., 2018b). The 3D reconstruction from these cam-
eras achieves an RMSE of 2.048 mm, ensuring a reli-
able level of precision for our body composition esti-
mates.
2.3 Machine Learning Models for Body
Composition Estimation Based on
3D Body Shapes
Various machine learning models have been em-
ployed to estimate body composition, leveraging dif-
ferent types of features and data representations.
Early approaches often utilized linear models, which
are simple and interpretable but may lack the capac-
ity to capture complex relationships in the data (Ng
et al., 2019; Wong et al., 2021; Tian et al., 2023;
Wong et al., 2023). Bayesian networks introduced
probabilistic frameworks, allowing for the integration
of prior knowledge and handling uncertainty more ef-
fectively (Lu et al., 2018a).
Neural networks, particularly deep learning mod-
els, have significantly advanced the field by capturing
non-linear relationships and complex patterns in large
datasets. These models, including MLP and Convolu-
tional Neural Networks (CNNs), have shown superior
performance in estimating body composition metrics
(Lu et al., 2019; Zheng et al., 2023). Recent studies
have also explored networks that leverage 2D features
extracted from 3D scans projected onto 2D planes to
predict body composition for monitoring bone health
(Wang and Torriani, 2020). These approaches can
utilize traditional image processing techniques from
computer vision, offering a trade-off between com-
plexity and computational efficiency.
3 METHOD
The primary objective of this study is to develop a pre-
dictive model for whole-body composition, includ-
ing total LM, FM, BMC. Utilizing 3D body scanning
technology, we implement an automated segmenta-
tion algorithm that divides the body into distinct re-
gions and extracts meaningful shape descriptors from
each part. These extracted features are subsequently
input into a part-to-global MLP network, which is de-
signed to predict precise body composition. The fol-
lowing subsections provide a detailed explanation of
the feature extraction process, the structure of the pre-
diction network, and the loss functions applied during
model training.
For each participant P
i
, we create a sample S
i
=
{M
i
;D
i
}, which includes their body mesh M
i
cap-
tured via consumer-grade depth sensors, and de-
mographic features D
i
(age, height, weight, gen-
der, ethnicity). For prediction purposes, the tar-
get variable is y
i
, and the local body composi-
tion of the different body regions is l
p
i
, where p ∈
{trunk, le f tarm, rightarm, le f tleg, rightleg}.
The process of estimating whole-body composi-
tion ˆy involves two main steps: (i) extracting mean-
ingful features from the 3D scans and (ii) predict-
ing each body composition component based on these
features.
3.1 Feature Extraction
This study’s 3D human body dataset serves mul-
tiple purposes, including reconstructing 3D shapes
and predicting body composition (Stark et al., 2022;
Zheng et al., 2023). It consists of meshes and de-
mographic information from 161 participants (101 fe-
male and 60 male). As shown in Figure. 1, partic-
ipants maintained the same posture during scanning.
Enhanced Body Composition Estimation from 3D Body Scans
423
(a)
(b)
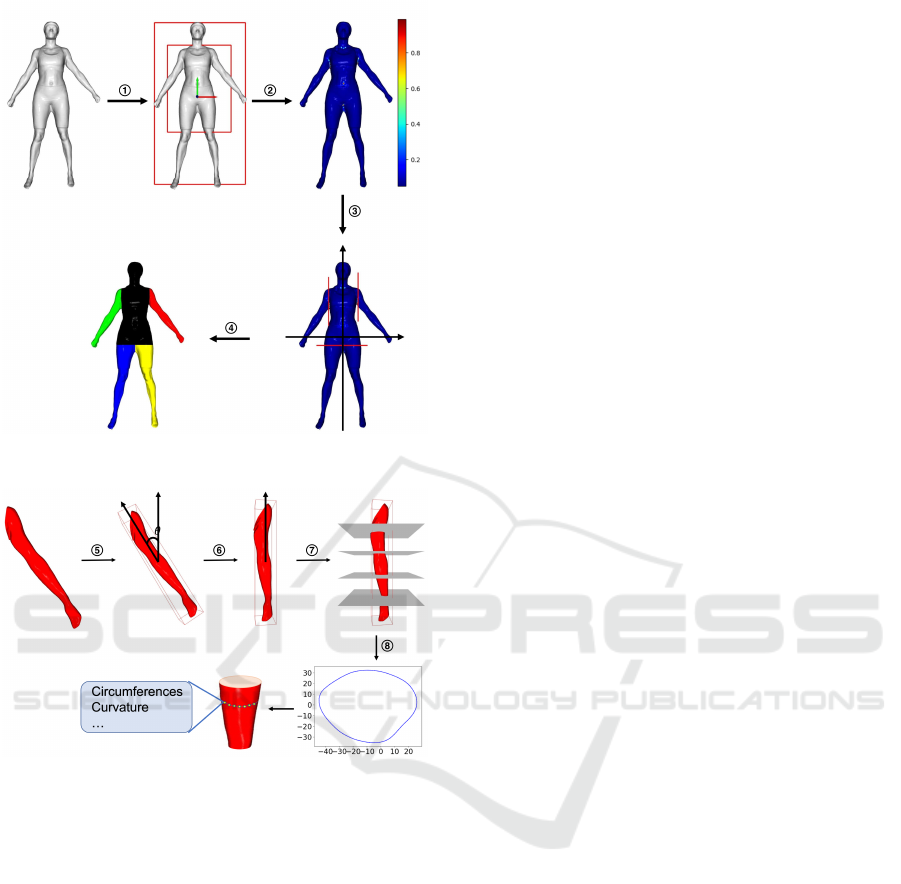
Figure 1: Extracting features from the mesh: (a) We first
segment the mesh into five body parts
1
⃝
Align and get
bounding box
2
⃝
Calculate curvature
3
⃝
Locate local max-
imum
4
⃝
Segment to 5 parts. (b) Then, we calculate the
values of level circumference, curvature’s mean, and vari-
ance from these five parts
5
⃝
Get minimal bounding box
6
⃝
Rotate and align
7
⃝
Put parallel planes
8
⃝
Get intersection.
The demographics of the participants are detailed in
Table 1. Before being scanned, participants were in-
structed to wear tight-fitting clothing. For body com-
position analysis, we use regional and total LM, FM,
and BMC derived from DXA scans as the ground
truth in this study.
Given the limited sample size of 161 3D hu-
man body scans, we focus on extracting represen-
tative features from the original mesh to prevent
overfitting. Networks applied to polygonal meshes,
such as DualConvMesh-Net (Schult et al., 2020) and
MeshCNN (Hanocka et al., 2019), suffer from high
distortion of fine details when dealing with human
body meshes. It is particularly challenging for hu-
man body regression, as more information is needed
for accurate predictions. Therefore, we utilize prepro-
cessing and segmentation methods to improve feature
extraction and simplify the learning model by reduc-
ing the input size.
The process, illustrated in Figure. 1, begins by
segmenting the body into five parts: trunk, left upper
limb, right upper limb, left lower limb, and right lower
limb. Initially, we align the mesh’s center of mass
with the origin and compute its axis-aligned bounding
box, scaling it along the x and y axes to form an inner
box. This alignment is performed through simulation,
minimizes minor pose variations, ensures consistent
orientation across all body shapes, and contributes to
reliable segmentation. Following this setup, we cal-
culate the absolute curvature of the vertices within
the inner box. Curvature pattern analysis, primarily
through heat mapping, reveals that curvature at body
joints is significantly higher than in other regions, in-
dicating its utility as a segmentation marker. We iden-
tify vertices with maximal curvature in the first, sec-
ond, and combined third-fourth quadrants (Zana and
Klein, 2001). These vertices serve as reference points
for automated segmentation, a process designed to be
manual-interaction-free, enhancing its applicability in
practical settings.
Our method includes an independent feature ex-
traction process for each body part after automated
segmentation. We determine each segmented part’s
smallest enclosing bounding box, which is then ori-
ented such that its longest dimension aligns with the
y-axis. Afterward, we create 16 equally distributed
planes perpendicular to the y-axis and intersect the
mesh piece. The intersections of these planes with
the mesh create line segments, the length of which
defines each level’s circumference, denoted as C
l
.
Moreover, at the edges of these intersection poly-
gons, we compute the discrete Gaussian curvature of
the vertices based on spheres centered at these points
(Peng et al., 2003). This computation creates two ad-
ditional sets of features for each segment: the mean
C
m
and variance C
v
of the curvature values. These
measurements and the level circumferences C
l
con-
stitute a comprehensive set of shape descriptors. Each
body part has 16 descriptors obtained uniformly from
16 levels, resulting in 48 feature values. Figure.
1(b) visually illustrates the feature extraction process,
specifically using the left arm segment as an example.
In addition to level descriptors, we also incorpo-
rate regional area and volume as features. The re-
gional area A
p
is calculated by summing the surface
areas of the triangles forming the mesh within each
segmented part. The volume V
p
is estimated using a
BIOINFORMATICS 2025 - 16th International Conference on Bioinformatics Models, Methods and Algorithms
424

voxel-based method, where the number of voxels oc-
cupied by the mesh is counted and multiplied by the
voxel size. These two features will be concatenated at
the end of shape descriptors.
3.2 Prediction Network
To take advantage of the features extracted above, we
design a part-to-global MLP to fit the underlying re-
lationship between the features and the prediction tar-
get. The structure of the model is shown in Figure. 2
and can be divided into two parts. The first part con-
sists of five separate MLPs φ
p
f
for regions p ∈ {trunk,
left arm, right arm, left leg, right leg}. This model
incorporates these significant features from the corre-
sponding anatomical region: the level circumference
vector C
l
, the mean curvature C
m
, the variance in cur-
vature C
v
, the regional area A
p
, and the regional vol-
ume V
p
. The vector C
i
consists of 48 feature values
that characterize the geometric attributes at all levels
along the body part. Specifically, C
i
is represented as:
C
i
= [C
l
i
,C
m
i
,C
v
i
]. (1)
The prediction model for each region is represented
as follows:
ˆ
l
p
i
= φ
p
(C
i
, A
p
,V
p
). (2)
Here,
ˆ
l
p
i
denotes the predicted value for the specific
region p for participant i, while l
p
i
represents the ac-
tual ground truth value for that region. The regional
predictions are constrained using the L
2
loss:
L
r
=
1
N
n
∑
i=1
∑
p
(
ˆ
l
p
i
− l
p
i
)
2
. (3)
The hidden features
ˆ
y
p
i
from each individual MLP
φ
p
are obtained as:
ˆ
y
p
i
= ψ
p
(
ˆ
l
p
i
), (4)
where ψ
p
is a function that transforms the regional
prediction
ˆ
l
p
i
into the hidden feature representation
ˆ
y
p
i
.
In the second part, the hidden features
ˆ
y
p
i
calcu-
lated from each individual MLP φ
p
in the first part
are concatenated with the demographic features D
i
to
predict the body composition of the entire body ˆy
i
as:
ˆy
i
= Φ([
ˆ
y
p
i
;D
i
]), (5)
where [; ] denotes the concatenation operation and Φ
denotes the MLPs in the second part of the model.
The hidden features
ˆ
y
p
i
serve as an intermediate rep-
resentation that captures the important aspects of the
body shape and composition for each region, which
Table 1: Participants Demographics.
Demographic Female(N=101) Male(N=60)
Age(y) 28.02±8.78 27.52 ± 7.08
Ethnicity, n(%)
White 71.3 61.7
Asian 11.9 15.0
Black 9.9 18.3
Hispanic 3.0 1.7
Other 4.0 3.3
Height(cm) 165.87 ± 6.64 179.07 ± 7.29
Weight(kg) 65.60 ± 13.10 84.36 ± 16.24
BMI(kg/m
2
) 23.80 ± 4.32 26.23 ± 4.27
DXA LM(kg)
Total(kg) 42.90 ± 6.29 63.14 ± 9.19
Arms(kg) 4.27 ± 1.56 7.84 ± 4.19
Legs LM(kg) 14.98 ± 5.13 22.15 ± 9.49
DXA BMC(g)
Total 2472.22 ± 34.00 3351.37 ± 51.19
Arms 296.33 ± 46.07 453.89 ± 82.68
Legs 902.32 ± 146.34 1283.76 ± 198.44
Trunk 754.47 ± 26.68 1039.47 ± 101.66
are then aggregated to form a comprehensive descrip-
tor for the global prediction.
The L
2
loss is used as the loss function for the final
part:
L
g
=
1
N
n
∑
i=1
( ˆy
i
− y
i
)
2
. (6)
where y
i
is the ground truth of the entire body com-
position. The overall loss function combines the re-
gional and global losses:
L = L
g
+ λ
r
L
r
, (7)
where λ
r
is the weight coefficient, which is set to 1
by default. Through the regional-to-global constraint,
we enhance the representation ability of the hidden
layers and boost the final performance.
To measure the accuracy of our model’s predic-
tions, we use RMSE as the standard metric. It is cal-
culated as the square root of the average squared dif-
ferences between the predicted values and the actual
values. Mathematically, RMSE is defined as:
RMSE =
s
1
n
n
∑
i=1
(y
i
′
− y
i
)
2
, (8)
where n is the number of samples, y
i
′
is the predicted
value for each mesh, and y
i
is the observed body com-
position.
4 EXPERIMENTS
The proposed architecture is based on PyTorch 3.0
and an NVIDIA RTX 4090 GPU with 24 GB mem-
Enhanced Body Composition Estimation from 3D Body Scans
425
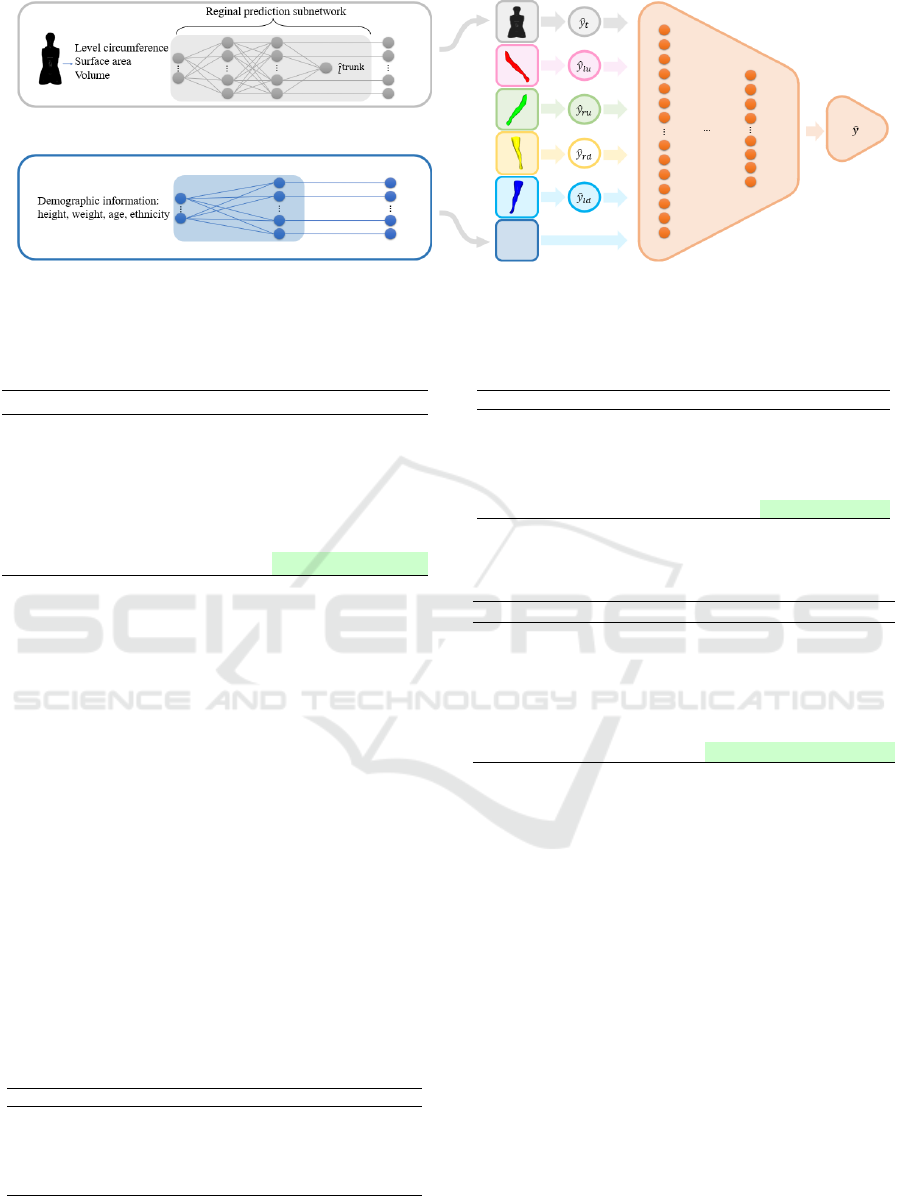
Figure 2: Overview of our regression model. The multilayer perceptron (MLP) architecture is used for multiple regional
regression, followed by a global prediction network that integrates regional prediction and demographic features.
Table 2: Results of various regression models for lean mass
estimation.
Methods RMSE(kg)
Linear Regression 7.2653 ± 1.4869
Lasso Regression 7.1064 ± 0.8257
Ridge Regression 3.5401 ± 0.3815
Random Forest Regression 4.1560 ± 0.2456
Support Vector Regression 4.1416 ± 0.3936
Baseline 3.2221 ± 0.3067
Ours 2.8538 ± 0.2945
ory. We set 100 epochs for training with a batch size
of 8, using the Adam optimizer with β
1
= 0.9 and
β
2
= 0.999 for optimization (Zhang, 2018). To evalu-
ate the performance of our method, we implemented
5-fold cross-validation, ensuring that the model’s ac-
curacy was tested across different subsets of the data.
We made sure that scans from the same participants
were put in the same fold to prevent overfitting and
data leakage. To evaluate the performance of our
method, we compared it against several previous re-
gression models, including Linear Regression, Lasso
Regression, Ridge Regression, Random Forest Re-
gression, and Support Vector Regression. We also
tested it against a baseline algorithm designed for pre-
dicting regional lean mass using level circumferences
only (Zheng et al., 2023). We conducted ablation
studies to assess the impact of different feature com-
binations and descriptors on prediction accuracy.
Table 3: Comparison of body composition components’
prediction.
Metric Total LM(kg) Total FM(kg) Total BMC(g)
RMSE 2.85 ± 0.29 2.50 ± 0.18 193.50 ± 18.27
R-square 0.8337 0.8888 0.8438
Pearson 0.9134 0.9450 0.9279
Spearman 0.9198 0.8383 0.8947
P-value < 0.01 < 0.01 < 0.01
Table 4: Ablation study on different features for lean mass
prediction.
Trunk Arms Legs Demographic RMSE(kg)
✓ 5.7251 ± 0.9479
✓ 5.2784 ± 0.3647
✓ 7.2304 ± 0.4463
✓ 3.6577 ± 0.3744
✓ ✓ ✓ 3.1956 ± 0.2287
✓ ✓ ✓ ✓ 2.8538 ± 0.2945
Table 5: Ablation study on different descriptors for body
parts.
LC CSA SA Volume RMSE(kg)
✓ 4.1144 ± 0.2682
✓ 4.4047 ± 0.4053
✓ 4.8536 ± 0.1895
✓ 5.2772 ± 0.6843
✓ ✓ 4.4802 ± 0.3526
✓ ✓ ✓ 3.1956 ± 0.2287
✓ ✓ ✓ ✓ 3.1294 ± 0.1717
LC, Level Circumferences; CSA, Cross-Sectional Area;
SA, Surface Area.
4.1 Results and Discussion
Figure 3 compares predictive performance for LM,
FM, and BMC between the proposed method and the
baseline algorithm (Zheng et al., 2023). The baseline
algorithm was designed for predicting regional lean
mass with level circumferences only. Here, we fine-
tuned the model to predict total LM, FM, and BMC.
Figure. 3 demonstrates that our method consistently
outperforms the baseline method across all three body
composition components (LM, FM, and BMC). Our
method shows stronger correlations (higher R² values)
and better agreement (narrower limits of agreement)
between the predicted values and ground truth, indi-
cating more accurate and reliable predictions.
To compare multiple regression methods for pre-
dicting, we use the results of LM prediction as an ex-
ample, summarized in Table 2 and illustrated in Fig-
BIOINFORMATICS 2025 - 16th International Conference on Bioinformatics Models, Methods and Algorithms
426
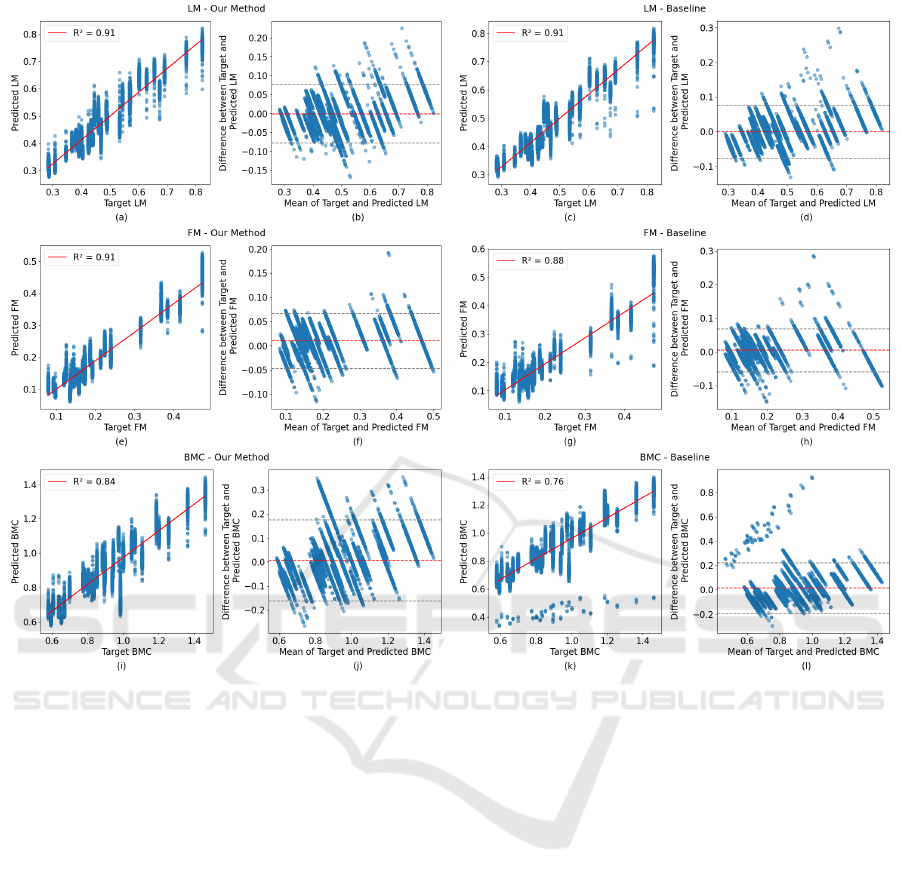
Figure 3: Comparison of predictive performance for LM, FM, and BMC between the proposed method and the baseline
method. In each pair of plots, the left columns show scatter plots of ground truth vs. predicted values with the line of best
fit and R-square value for each body composition component. The right columns display Bland-Altman plots for the same
predictions, showing the differences between actual and predicted values against their mean.
ure. 4. Figure. 4 visually represents how well each re-
gression method predicts the body composition using
total LM as a prediction target. Our method’s scat-
ter plot displays a denser cluster of points along the
ground truth line, reflecting its superior performance
with the lowest RMSE. Our method also has the high-
est R-squared value among all regression models, in-
dicating a strong linear relationship and the closest
alignment of predictions to the actual values.
Table 2 compares the RMSE of different re-
gression models and the baseline algorithm, which
leverages only level circumferences (Zheng et al.,
2023) for estimating lean mass. Linear Regression
achieved 7.2653 ± 1.4869 kg, while Lasso Regres-
sion had 7.1064 ± 0.8257 kg. Ridge Regression
showed improved performance with 3.5401 ± 0.3815
kg. Random Forest Regression and Support Vector
Regression had RMSEs of 4.1560 ± 0.2456 kg and
4.1416 ± 0.3936 kg, respectively. The baseline al-
gorithm recorded an RMSE of 3.2221 ± 0.3067 kg.
Our model demonstrated superior performance with
the lowest RMSE of 2.8538 ± 0.2945 kg, indicating
higher accuracy than traditional regression models.
Table 3 presents the results for predicting total
LM, FM, and BMC. The p-values reported in Ta-
ble 3 were obtained using Pearson correlation signif-
icance tests. Our model achieves RMSE values of
2.8538 ± 0.2945 kg for LM, 2.4994 ± 0.1817 kg for
FM, and 193.50 ± 18.27 g for BMC. The R-square
values are all over 0.8, indicating a high proportion
of variance explained by the model. The Pearson cor-
relation coefficients are all over 0.9, reflecting strong
linear relationships between the predicted and actual
values. The Spearman correlation coefficients are all
over 0.8, indicating strong monotonic relationships.
All P-values are less than 0.01, confirming the statis-
tical significance of the model’s predictions.
Enhanced Body Composition Estimation from 3D Body Scans
427
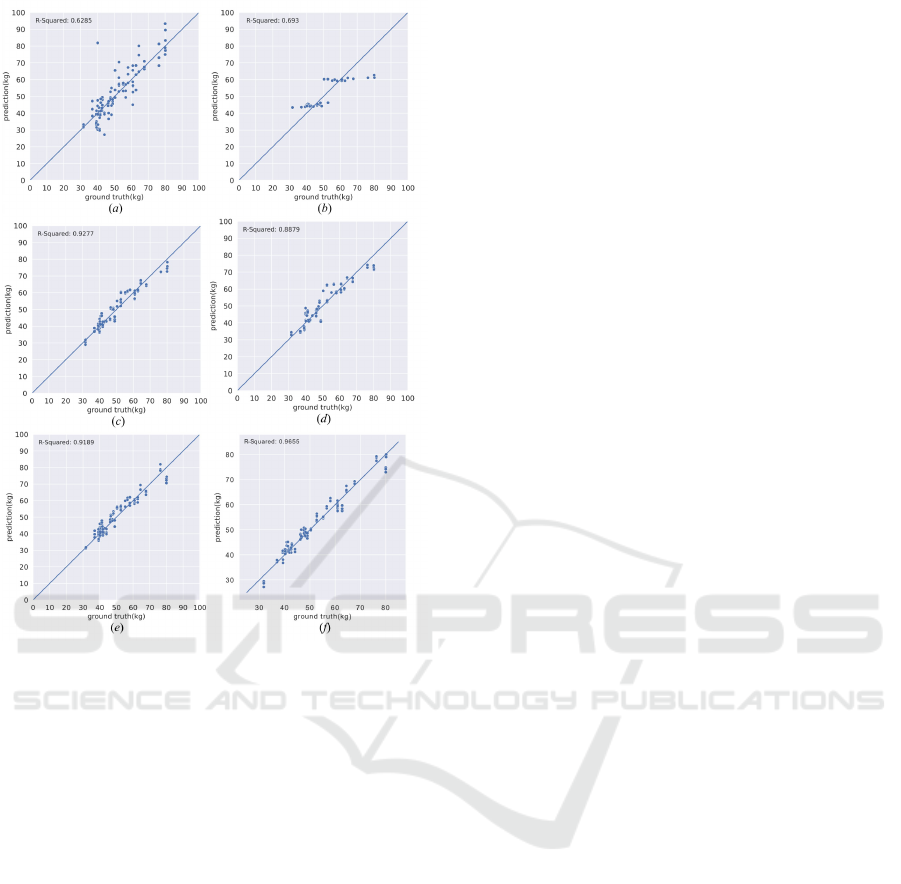
Figure 4: Scatter plot comparisons between the predictions
of different methods and the ground truth. (a) Linear re-
gression. (b) Lasso regression. (c) Ridge regression. (d)
Random forest regression. (e) Support vector regression.
(f) Ours.
4.2 Ablation Study
4.2.1 Ablation Study on the Necessity of
Different Components
We conducted an ablation study to provide more in-
sight into different combinations of the features. The
results are presented in Table 4. This study sys-
tematically examines the impact of including vari-
ous combinations of body part features (trunk, arms,
legs) and demographic data on the model’s predic-
tion accuracy, as measured by RMSE. The study re-
vealed the effects of different body regions and demo-
graphic data. Reliance on leg features alone proved
least effective, with the model recording an RMSE of
7.2304 ± 0.4463kg. A notable improvement was ob-
served when integrating features from all body parts
(trunk, arms, and legs), where the RMSE dropped
to 3.8148 ± 0.4508kg, underscoring the benefit of a
comprehensive body analysis. The most significant
enhancement in prediction accuracy was achieved by
including demographic data alongside body measure-
ments, which reduced the RMSE to 2.8538 ± 0.2945
kg. This substantial decrease highlights demographic
factors’ critical role in increasing accuracy.
4.2.2 Ablation Study on Different Descriptors
for Body Parts
The ablation study presented in Table 5 evaluates the
effectiveness of different descriptors for body parts
by examining their impact on RMSE. The factors
considered include level circumferences (LC), cross-
sectional area, surface area, and volume. Table 5
shows that relying solely on one type of descriptor
all leads to a higher RMSE of over 4 kg. However,
combining level circumference, surface area, and vol-
ume for overall information significantly enhances the
model’s performance, reaching the lowest RMSE at
3.1294 ± 0.1717 kg. This ablation study highlights
the importance of using a comprehensive set of fea-
tures as descriptors for precise body composition es-
timation. Although our method utilizes a large num-
ber of high-level features, the design considerations in
both feature extraction and network architecture en-
sure that the computational complexity remains man-
ageable, facilitating practical implementation in re-
search settings.
5 CONCLUSIONS
We propose a novel method for estimating body com-
position using a predefined descriptor that includes
high-level features extracted from 3D body scans and
a part-to-global MLP network. Our method performs
better than traditional regression techniques and the
baseline algorithm, demonstrating that our approach
accurately captures body shape details, resulting in
more precise and reliable estimations. Addition-
ally, this novel method has the clinical advantages of
avoiding exposure to unnecessary radiation and costly
testing. However, two main limitations need to be ad-
dressed in future research.
Firstly, although our model incorporates multiple
descriptors for body parts, these descriptors may still
not capture enough detailed body shape information.
Future work should focus on improving the accuracy
of prediction by developing methods to use polygo-
nal mesh or point cloud data as input directly. This
approach could better represent the complexities of
body shape and potentially enhance the accuracy and
robustness of the model. By leveraging the detailed
geometric information available in polygonal meshes,
future models could more effectively capture nuanced
BIOINFORMATICS 2025 - 16th International Conference on Bioinformatics Models, Methods and Algorithms
428

variations in body shape.
Secondly, while our model incorporates multiple
descriptors for body parts, the accuracy of these de-
scriptors is contingent on the quality and precision of
the 3D scans. Variations in scan quality, resolution,
and noise levels can affect the reliability of the de-
scriptors and, consequently, the model’s predictions.
Developing robust preprocessing techniques to stan-
dardize scan quality and mitigate noise can help im-
prove the consistency and accuracy of body composi-
tion estimates. Additionally, incorporating advanced
scanning technologies or combining multiple scan-
ning modalities could enhance the precision of the de-
scriptors used in the model.
ACKNOWLEDGEMENTS
This work was supported in part by National Insti-
tutes of Diabetes and Digestive and Kidney Diseases
(NIDDK) of the National Institutes of Health under
grants R01DK129809.
Research reported in this publication was sup-
ported by the National Institute On Aging of the
National Institutes of Health under Award Number
R56AG089080. The content is solely the responsibil-
ity of the authors and does not necessarily represent
the official views of the National Institutes of Health.
REFERENCES
Albanese, C. V., Diessel, E., and Genant, H. K. (2003).
Clinical applications of body composition measure-
ments using dxa. Journal of Clinical Densitometry,
6(2):75–85.
Althnian, A., AlSaeed, D., Al-Baity, H., Samha, A., Dris,
A. B., Alzakari, N., Abou Elwafa, A., and Kurdi, H.
(2021). Impact of dataset size on classification per-
formance: an empirical evaluation in the medical do-
main. Applied Sciences, 11(2):796.
Andreoli, A., Garaci, F., Cafarelli, F. P., and Guglielmi, G.
(2016). Body composition in clinical practice. Euro-
pean journal of radiology, 85(8):1461–1468.
Bartol, K., Bojani
´
c, D., Petkovi
´
c, T., and Pribani
´
c, T.
(2021). A review of body measurement using 3d scan-
ning. Ieee Access, 9:67281–67301.
Borga, M., West, J., Bell, J. D., Harvey, N. C., Romu, T.,
Heymsfield, S. B., and Dahlqvist Leinhard, O. (2018).
Advanced body composition assessment: from body
mass index to body composition profiling. Journal of
Investigative Medicine, 66(5):1–9.
Cai, Z., Cai, D., Yao, D., Chen, Y., Wang, J., and Li,
Y. (2015). Associations between body composition
and nutritional assessments and biochemical markers
in patients with chronic radiation enteritis: a case–
control study. Nutrition journal, 15:1–8.
Cappellari, G. G., Guillet, C., Poggiogalle, E., Pomar, M.
D. B., Batsis, J. A., Boirie, Y., Breton, I., Frara,
S., Genton, L., Gepner, Y., et al. (2023). Sar-
copenic obesity research perspectives outlined by the
sarcopenic obesity global leadership initiative (sogli)–
proceedings from the sogli consortium meeting in
rome november 2022. Clinical Nutrition, 42(5):687–
699.
Ceniccola, G. D., Castro, M. G., Piovacari, S. M. F., Horie,
L. M., Corr
ˆ
ea, F. G., Barrere, A. P. N., and Toledo,
D. O. (2019). Current technologies in body composi-
tion assessment: advantages and disadvantages. Nu-
trition, 62:25–31.
Chen, H., Wei, Z., Li, X., Xu, Y., Wei, M., and Wang,
J. (2022). Repcd-net: Feature-aware recurrent point
cloud denoising network. International Journal of
Computer Vision, 130(3):615–629.
Chi, L. and Kennon, R. (2006). Body scanning of dynamic
posture. International Journal of Clothing Science
and Technology, 18(3):166–178.
Cichosz, S. L., Rasmussen, N. H., Vestergaard, P., and
Hejlesen, O. (2021). Precise prediction of total body
lean and fat mass from anthropometric and demo-
graphic data: development and validation of neural
network models. Journal of Diabetes Science and
Technology, 15(6):1337–1343.
Guarnieri Lopez, M., Matthes, K. L., Sob, C., Bender,
N., and Staub, K. (2023). Associations between 3d
surface scanner derived anthropometric measurements
and body composition in a cross-sectional study. Eu-
ropean Journal of Clinical Nutrition, 77(10):972–981.
Hanocka, R., Hertz, A., Fish, N., Giryes, R., Fleishman,
S., and Cohen-Or, D. (2019). Meshcnn: a network
with an edge. ACM Transactions on Graphics (ToG),
38(4):1–12.
Kennedy, S., Smith, B., Sobhiyeh, S., Dechenaud, M. E.,
Wong, M., Kelly, N., Shepherd, J., and Heymsfield,
S. B. (2022). Digital anthropometric evaluation of
young children: comparison to results acquired with
conventional anthropometry. European journal of
clinical nutrition, 76(2):251–260.
Kuriyan, R. (2018). Body composition techniques. Indian
Journal of Medical Research, 148(5):648–658.
Lee, T. H., So, M. S., Kim, B. J., Kang, J. G., Sung, K. C.,
Kim, B. S., and Kang, J. H. (2015). The association
between epicardial fat thickness and coronary artery
calcification according to blood pressure status in non-
hypertensive individuals: from the caesar study. Jour-
nal of Clinical Lipidology, 9(3):305–312.
Leong, L. T., Wong, M. C., Liu, Y. E., Glaser, Y., Quon,
B. K., Kelly, N. N., Cataldi, D., Sadowski, P., Heyms-
field, S. B., and Shepherd, J. A. (2024). Generative
deep learning furthers the understanding of local dis-
tributions of fat and muscle on body shape and health
using 3d surface scans. Communications Medicine,
4(1):13.
Lu, Y. and Hahn, J. K. (2019). Shape-based three-
dimensional body composition extrapolation using
Enhanced Body Composition Estimation from 3D Body Scans
429

multimodality registration. In Proceedings of Spie–the
International Society for Optical Engineering, volume
10949. NIH Public Access.
Lu, Y., Hahn, J. K., and Zhang, X. (2019). 3d shape-based
body composition inference model using a bayesian
network. IEEE journal of biomedical and health in-
formatics, 24(1):205–213.
Lu, Y., McQuade, S., and Hahn, J. K. (2018a). 3d shape-
based body composition prediction model using ma-
chine learning. In 2018 40th Annual International
Conference of the IEEE Engineering in Medicine and
Biology Society (EMBC), pages 3999–4002. IEEE.
Lu, Y., Zhao, S., Younes, N., and Hahn, J. K. (2018b). Ac-
curate nonrigid 3d human body surface reconstruction
using commodity depth sensors. Computer animation
and virtual worlds, 29(5):e1807.
Messina, C., Albano, D., Gitto, S., Tofanelli, L., Bazzoc-
chi, A., Ulivieri, F. M., Guglielmi, G., and Sconfienza,
L. M. (2020). Body composition with dual energy x-
ray absorptiometry: from basics to new tools. Quan-
titative imaging in medicine and surgery, 10(8):1687.
Mocini, E., Cammarota, C., Frigerio, F., Muzzioli, L., Pi-
ciocchi, C., Lacalaprice, D., Buccolini, F., Donini,
L. M., and Pinto, A. (2023). Digital anthropometry:
A systematic review on precision, reliability and accu-
racy of most popular existing technologies. Nutrients,
15(2):302.
Ng, B. K., Hinton, B. J., Fan, B., Kanaya, A. M., and Shep-
herd, J. A. (2016). Clinical anthropometrics and body
composition from 3d whole-body surface scans. Euro-
pean journal of clinical nutrition, 70(11):1265–1270.
Ng, B. K., Sommer, M. J., Wong, M. C., Pagano, I., Nie,
Y., Fan, B., Kennedy, S., Bourgeois, B., Kelly, N.,
Liu, Y. E., et al. (2019). Detailed 3-dimensional
body shape features predict body composition, blood
metabolites, and functional strength: the shape up!
studies. The American journal of clinical nutrition,
110(6):1316–1326.
Peng, J., Li, Q., Kuo, C.-C. J., and Zhou, M. (2003). Es-
timating gaussian curvatures from 3d meshes. In
Human Vision and Electronic Imaging VIII, volume
5007, pages 270–280. SPIE.
Pisciottano, M. V. C., Pinto, S., Szejnfeld, V., and
de Moura Castro, C. H. (2014). The relationship be-
tween lean mass, muscle strength and physical ability
in independent healthy elderly women from the com-
munity. The Journal of nutrition, health and aging,
18(5):554–558.
Rumbo-Rodr
´
ıguez, L., S
´
anchez-SanSegundo, M., Ferrer-
Cascales, R., Garc
´
ıa-D’Urso, N., Hurtado-S
´
anchez,
J. A., and Zaragoza-Mart
´
ı, A. (2021). Comparison
of body scanner and manual anthropometric measure-
ments of body shape: a systematic review. Interna-
tional journal of environmental research and public
health, 18(12):6213.
Schoenfeld, B. J., Aragon, A. A., Moon, J., Krieger,
J. W., and Tiryaki-Sonmez, G. (2017). Compari-
son of amplitude-mode ultrasound versus air displace-
ment plethysmography for assessing body composi-
tion changes following participation in a structured
weight-loss programme in women. Clinical physiol-
ogy and functional imaging, 37(6):663–668.
Schult, J., Engelmann, F., Kontogianni, T., and Leibe, B.
(2020). Dualconvmesh-net: Joint geodesic and eu-
clidean convolutions on 3d meshes. In Proceedings
of the IEEE/CVF conference on computer vision and
pattern recognition, pages 8612–8622.
Shi, X., Chai, L., Zhang, D., and Fan, J. (2024). Asso-
ciation between complementary anthropometric mea-
sures and all-cause mortality risk in adults: Nhanes
2011–2016. European Journal of Clinical Nutrition,
pages 1–8.
Smith-Ryan, A. E., Mock, M. G., Ryan, E. D., Gerstner,
G. R., Trexler, E. T., and Hirsch, K. R. (2017). Va-
lidity and reliability of a 4-compartment body compo-
sition model using dual energy x-ray absorptiometry-
derived body volume. Clinical Nutrition, 36(3):825–
830.
Stark, E., Haffner, O., and Ku
ˇ
cera, E. (2022). Low-
cost method for 3d body measurement based on
photogrammetry using smartphone. Electronics,
11(7):1048.
Thibault, R., Genton, L., and Pichard, C. (2012). Body
composition: why, when and for who? Clinical nutri-
tion, 31(4):435–447.
Thibault, R. and Pichard, C. (2012). The evaluation of body
composition: a useful tool for clinical practice. Annals
of Nutrition and Metabolism, 60(1):6–16.
Tian, I., Liu, J., Wong, M., Kelly, N., Liu, Y., Garber, A.,
Heymsfield, S., Curless, B., and Shepherd, J. (2024).
3d convolutional deep learning for nonlinear estima-
tion of body composition from whole-body morphol-
ogy. Research Square.
Tian, I. Y., Ng, B. K., Wong, M. C., Kennedy, S., Hwaung,
P., Kelly, N., Liu, E., Garber, A. K., Curless, B.,
Heymsfield, S. B., et al. (2020). Predicting 3d body
shape and body composition from conventional 2d
photography. Medical Physics, 47(12):6232–6245.
Tian, I. Y., Wong, M. C., Nguyen, W. M., Kennedy, S., Mc-
Carthy, C., Kelly, N. N., Liu, Y. E., Garber, A. K.,
Heymsfield, S. B., Curless, B., et al. (2023). Au-
tomated body composition estimation from device-
agnostic 3d optical scans in pediatric populations.
Clinical Nutrition, 42(9):1619–1630.
Tinsley, G. M., Moore, M. L., Dellinger, J. R., Adamson,
B. T., and Benavides, M. L. (2020). Digital anthro-
pometry via three-dimensional optical scanning: eval-
uation of four commercially available systems. Euro-
pean Journal of Clinical Nutrition, 74(7):1054–1064.
Tinsley, G. M., Rodriguez, C., Siedler, M. R., Tinoco, E.,
White, S. J., LaValle, C., Brojanac, A., DeHaven, B.,
Rasco, J., Florez, C. M., et al. (2024). Mobile phone
applications for 3-dimensional scanning and digital
anthropometry: a precision comparison with tradi-
tional scanners. European Journal of Clinical Nutri-
tion, pages 1–6.
Toombs, R. J., Ducher, G., Shepherd, J. A., and De Souza,
M. J. (2012). The impact of recent technological ad-
vances on the trueness and precision of dxa to assess
body composition. Obesity, 20(1):30–39.
BIOINFORMATICS 2025 - 16th International Conference on Bioinformatics Models, Methods and Algorithms
430

van Beek, E. J. and Hoffman, E. A. (2008). Functional
imaging: Ct and mri. Clinics in chest medicine,
29(1):195–216.
Wang, B. and Torriani, M. (2020). Artificial intelligence
in the evaluation of body composition. In Seminars
in Musculoskeletal Radiology, volume 24, pages 030–
037. Thieme Medical Publishers.
Wang, J., Thornton, J., Kolesnik, S., and Pierson Jr, R.
(2000). Anthropometry in body composition: an
overview. Annals of the New York Academy of Sci-
ences, 904(1):317–326.
Werkstetter, K. J., Ullrich, J., Schatz, S. B., Prell, C., Ko-
letzko, B., and Koletzko, S. (2012). Lean body mass,
physical activity and quality of life in paediatric pa-
tients with inflammatory bowel disease and in healthy
controls. Journal of Crohn’s and Colitis, 6(6):665–
673.
Wong, M. C., Bennett, J. P., Quon, B., Leong, L. T., Tian,
I. Y., Liu, Y. E., Kelly, N. N., McCarthy, C., Chow, D.,
Pujades, S., et al. (2023). Accuracy and precision of
3-dimensional optical imaging for body composition
by age, bmi, and ethnicity. The American Journal of
Clinical Nutrition, 118(3):657–671.
Wong, M. C., Ng, B. K., Tian, I., Sobhiyeh, S., Pagano,
I., Dechenaud, M., Kennedy, S. F., Liu, Y. E., Kelly,
N. N., Chow, D., et al. (2021). A pose-independent
method for accurate and precise body composition
from 3d optical scans. Obesity, 29(11):1835–1847.
Xu, B., Yu, W., Yao, M., Yao, X., Li, Q., Pepper, M., and
Freeland-Graves, J. (2009). A 3d surface imaging sys-
tem for assessing human obesity. In Applications of
Digital Image Processing XXXII, volume 7443, pages
542–553. SPIE.
Zana, F. and Klein, J.-C. (2001). Segmentation of vessel-
like patterns using mathematical morphology and cur-
vature evaluation. IEEE transactions on image pro-
cessing, 10(7):1010–1019.
Zebari, R., Abdulazeez, A., Zeebaree, D., Zebari, D., and
Saeed, J. (2020). A comprehensive review of di-
mensionality reduction techniques for feature selec-
tion and feature extraction. Journal of Applied Science
and Technology Trends, 1(1):56–70.
Zhang, H., Cao, J., Lu, G., Ouyang, W., and Sun, Z. (2020).
Learning 3d human shape and pose from dense body
parts. IEEE Transactions on Pattern Analysis and Ma-
chine Intelligence, 44(5):2610–2627.
Zhang, Z. (2018). Improved adam optimizer for deep neu-
ral networks. In 2018 IEEE/ACM 26th international
symposium on quality of service (IWQoS), pages 1–2.
Ieee.
Zheng, Y., Long, Z., Feng, B., Cheng, R., Vaziri, K., and
Hahn, J. (2024). D3bt: Dynamic 3d body transformer
for body fat percentage assessment. IEEE Journal of
Biomedical and Health Informatics.
Zheng, Y., Long, Z., Zhang, X., and Hahn, J. K. (2023). 3d
body shape for regional and appendicular body com-
position estimation. In Medical Imaging 2023: Image
Processing, volume 12464, pages 544–552. SPIE.
Enhanced Body Composition Estimation from 3D Body Scans
431
