
An Unsupervised Machine Learning Approach for Clustering Hip
Arthroplasty Patients: Surgery Duration Differs Among
Different Patient Groups
Mohammad Chavosh Nejad
a
, Rikke Vestergaard Matthiesen
b
, Iskra Dukovska-Popovska
c
and John Johansen
Department of Materials and Production, Aalborg University, Aalborg Ø, Denmark
Keywords: Hip Arthroplasty, Patient Clustering, Unsupervised Learning.
Abstract: Operating Rooms (ORs), as the largest source of revenue and costs in hospitals, face the challenge of growing
demand while dealing with limited resources, emphasizing the need for operational efficiency. Duration of
surgery (DOS), a key element in planning surgical resources, fluctuates and depends on many factors
including patients’ characteristics. A better understanding of these factors and the way they affect DOS can
help OR planners in achieving efficient resource allocation. To distinguish between patients from the DOS
perspective, this paper proposes an unsupervised machine learning method that clusters patients into different
groups by considering different clinical and operational features. Seven relevant factors were extracted from
Aalborg University Hospital’s database for 1,847 patients undergoing hip arthroplasty. K-Prototype algorithm
was utilized for developing various clustering models and their performance was assessed by three popular
metrics. Among the different developed models, the one with 7 clusters achieved the highest performance.
One-way ANOVA analysis illustrated that DOS means are significantly different among different clusters (F-
statistic=11.77, P-Value=5.45e-13). Inter-cluster differences were analyzed by Turkey’s Honest Significant
Difference (HSD) test. Besides, evaluating features’ importance showed that Age, BMI, and surgery type are
the most contributing factors in clustering patients.
1 INTRODUCTION
In recent years, healthcare systems deal with several
challenges regarding delivering surgery services. On
one hand, the demand for surgery services is steadily
increasing due to various reasons such as population
aging. On the other hand, operating rooms (ORs),
which are central to hospitals’ costs and revenues,
face strict internal and downstream units’ resource
limitations (Eshghali et al., 2023). Given the high
costs and lack of availability of surgical resources,
increasing the surgical capacity and infrastructure in
hospitals necessitates substantial investment.
Nonetheless, improving resource utilization
efficiency through operational excellence presents a
more cost-effective alternative to meeting growing
demand with the existing resources.
a
https://orcid.org/0000-0003-3417-4394
b
https://orcid.org/0000-0003-4184-9476
c
https://orcid.org/0000-0002-3498-463X
Operating room scheduling at the operational
level refers to assigning surgical resources to patients
in specific time periods (Rahimi & Gandomi, 2021).
A common approach for OR scheduling is to hold
weekly meetings by the scheduling committee to
decide which surgical resources should be assigned to
the patients on the waiting list during the week. The
committee usually consists of a surgeon, an
anesthesiology doctor, a senior nurse, and the
scheduling secretary. Besides the medical
considerations, surgery duration is considered by the
committee because it can affect the operational
performance of the OR and recourse allocation
(Chavosh Nejad et al., 2024). Due to site-specific
operational concerns, different hospitals exhibit
distinct preferences for assigning longer or shorter
surgeries to different timeslots. However, all these
committees should consider distinguishing patients
398
Chavosh Nejad, M., Matthiesen, R. V., Dukovska-Popovska, I. and Johansen, J.
An Unsuper vised Machine Learning Approach for Clustering Hip Arthroplasty Patients: Surgery Duration Differs Among Different Patient Groups.
DOI: 10.5220/0013108700003911
Paper published under CC license (CC BY-NC-ND 4.0)
In Proceedings of the 18th International Joint Conference on Biomedical Engineer ing Systems and Technologies (BIOSTEC 2025) - Volume 2: HEALTHINF, pages 398-405
ISBN: 978-989-758-731-3; ISSN: 2184-4305
Proceedings Copyright © 2025 by SCITEPRESS – Science and Technology Publications, Lda.

based on their surgery duration. In most of the cases,
they rely on surgeons’ experience for predicting each
individual patient’s DOS which is extremely surgeon-
dependent and prone to personal bias and inaccuracy.
Therefore, a more reliable approach that considers
patients and surgery characteristics for distinguishing
surgery candidates is needed.
As a branch of artificial intelligence, Machine
learning (ML) utilizes computer algorithms to extract
patterns within a given dataset. Unsupervised learning
(UL) algorithms are types of ML methods that group
data based on similar characteristics; a process called
clustering (Melo Riveros et al., 2019). In contrast to
supervised learning, they do not need labeled data,
which is sometimes hardly available, as a target
variable. Unsupervised learning methods have been
frequently used for different purposes in the healthcare
domain. Wang et al. suggested two UL models to
identify latent disease clusters by using patients’
electronic health records (Wang et al., 2020). Similar
research designed by Grant et al. benefited from k-
means clustering for identifying complex patient
profiles (Grant et al., 2020). Furthermore, some studies
assess the relationship of specific factors with the
resulting clusters. Crowson et al. used unsupervised
ML to cluster the comorbidities of patients with
rheumatoid arthritis and analyzed the association of
different patient characteristics with clusters (Crowson
et al., 2023). Two similar research approaches utilized
unsupervised ML for grouping patients and
investigating mortality risk among resulted distinct
clusters (Nouraei et al., 2022; Thongprayoon et al.,
2022). In another research, Ranti et al. grouped total
joint arthroplasty patients by k-mean algorithm and
analyzed the statistical difference in the set of
outcomes (30-day readmission, severe adverse events,
discharge to no-home) among clusters (Ranti et al.,
2020).
As it can be understood from the literature review,
different unsupervised methods have performed well
for clustering patients into different sub-groups.
Nonetheless, to the best of our knowledge, there is no
study in the literature clustering the patients for the
purpose of analyzing the relationship between
different patient groups and their surgery duration. To
fill the research gap, the main aim of this paper is first
to develop an unsupervised clustering model to well-
separate patients into different groups, and second, to
analyze the potential relationship between resulted
groups and their DOS.
2 MATERIALS AND METHODS
The research design encompasses data extraction and
preprocessing, model development, and output
analysis (Figure 1). Hip arthroplasty surgery was
selected as it is a high-demand operation in surgical
settings. The anonymized data was extracted from
Aalborg University Hospital between 2017 and 2020
(n=1847). Various studies suggest different variables,
associated with surgery duration which include
patient demographics (Abbas et al., 2022; Yeung et
al., 2011) and clinical factors (Mannion et al., 2020;
Yuniartha et al., 2021). In this way, the final dataset
included the information related to patients’ age,
Body Mass Index (BMI), sex, number of
comorbidities, number of previous surgeries, and
their surgery type and surgery side. Regarding the
surgery type, KNFB20 refers to uncemented and
KNFB30 refers to hybrid total prosthesis in the hip
joint. The duration of surgery was calculated based on
the data stored in the Patient Administration System
(PAS), where surgeries’ temporal data are registered.
While DOS was not included in clustering model
development, it was used to assess the association of
clusters and surgery duration. The summary of the
extracted data is presented in Table 1.
Figure 1: Research design.
Healthcare data typically comprise mixed data
consisting of both numerical and categorical
variables. This might make it harder for ML
algorithms to extract patterns from the data,
potentially leading to biases toward either categorical
or numerical variables. Therefore, under the data
preprocessing step, categorical variables were
encoded and continuous variables were scaled into
zero to one range for better clustering. Cluster
analysis distinguishes the data based on the distance
function to find out the cluster centers. Different
methods are available for calculating the distance
based on different data types; for instance, Euclidean
distance is used for numerical data, while Hamming
distance is employed for categorical data. Specific
An Unsupervised Machine Learning Approach for Clustering Hip Arthroplasty Patients: Surgery Duration Differs Among Different Patient
Groups
399

algorithms are developed for clustering continuous
data (k-means) or categorical data (k-modes). K-
prototype is a combination of k-means and k-modes
which is suitable for mixed data clustering (Madhuri,
2014) by simultaneously measuring both types of
distances (Kuo & Wang, 2022). The distance d(x,y)
between two points x and y, where x = (x
n
,x
c
) and y =
(y
n
,y
c
), with x
n
and y
n
being numerical features, and
x
c
and y
c
being the categorical features, is given by
equation 1:
Table 1: Patients’ demographics and data summary.
Variable Mean (Std) Frequency (%)
DOS 77.18 (25.67)
Age 67.39 (12.27)
BMI 28.34 (4.74)
Sex Female:947(48%)
Male: 900 (52%)
Side Right: 984 (53%)
Left: 863 (47%)
Number of
Comorbidities
0: 1448 (78%)
1: 314 (17%)
2: 68 (4%)
3: 15 (1%)
4: 2 (0%)
Number of
Surgeries
1: 1708 (92%)
2: 136 (7%)
3: 3 (0%)
Procedure
Type
KNFB20:
942 (51%)
KNFB30:
905 (49%)
𝑑(𝑥,𝑦) = (𝑥
,
−𝑦
,
)
+𝛾𝛿𝑥
,
,𝑦
,
(1)
Where:
• x
n,i
and y
n,i
are the numerical values of the i-
th feature of x and y.
• 𝛿(𝑥
,
,𝑦
,
) is an indicator function for the
categorical features j, defined as equation 2:
𝛿𝑥
,
,𝑦
,
=
1, 𝑖𝑓 𝑥
,
≠𝑦
,
0, 𝑖𝑓 𝑥
,
=𝑦
,
(2)
• 𝛾 is a weighting factor that balances the
contributions of the numerical and
categorical features.
K-prototype has been frequently used in the
healthcare domain and specifically for patient
clustering (Nouraei et al., 2022; Pasin & Gonenc,
2023). Therefore, considering the mixed data in this
research, the K-prototype was utilized to cluster the
patients. To find the best-performing model, we
developed different models with a wide range of
values for a number of clusters (2-15) and gamma
(0.5,0.1,0.01) as two important hyperparameters in K-
prototype. The performance of different models was
compared by using three popular metrics for
clustering models presented in Table 2.
Table 2: Clustering performance metrics.
Metric Range Interpret
Silhouette Score Between -1
and 1
The higher, the
b
ette
r
Calinski-
Harabasz Score
Unbounded &
non-negative
The higher, the
b
ette
r
Davies-Bouldin
Score
Unbounded &
non-ne
g
ative
The lower, the
b
ette
r
In order to assess the contribution of different
variables in developing clusters, permutation analysis
based on the Silhouette Score was performed. In this
way, each time a specific variable’s values are
randomly shuffled while keeping the other variables’
values fixed. The model is developed again, and the
recent performance is compared with the
performance of the original model. Finally, the
difference and drop in the model’s performance is
considered as the importance of the variable. For
more reliability, the process was repeated 10 times,
and the average importance was reported.
In this study, One-Way Analysis of Variance
(ANOVA) was applied to evaluate the differences in
surgery duration among various patient clusters
(alpha=0.05). One-way ANOVA is a statistical
technique used to test whether there are statistically
significant differences between the means of three or
more independent groups. For further investigation,
we deepened the analysis to pinpoint the clusters with
significantly different DOS by using a pairwise post-
hoc comparison using Tukey’s Honest Significant
Difference (HSD) test. Tukey's HSD test is a
commonly used post-hoc test that compares the
means of each pair of groups to determine which
specific group means are significantly different from
each other, while controlling for Type I errors (false
positives) (Nanda et al., 2021).
3 RESULTS AND DISCUSSION
In total 42 clustering models were developed with
different hyperparameters (14 alternatives for the
number of clusters and 3 options for gamma). As
shown in Figure 2, the model with 7 clusters and
gamma equal to 0.1 reached the best performance
HEALTHINF 2025 - 18th International Conference on Health Informatics
400
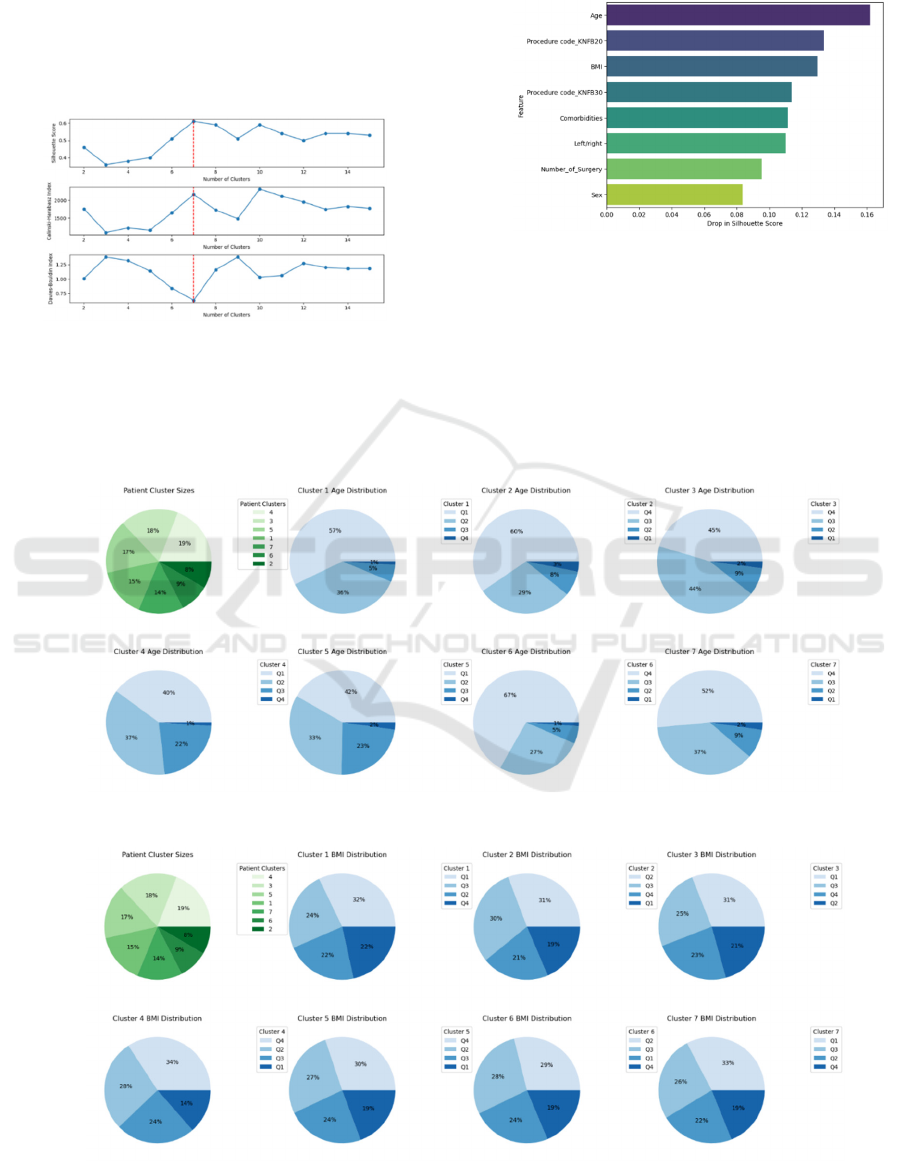
(silhouette score=0.61, Calinski Harabasz score=
2167.43, and Davies Bouldin Score= 0.63). It should
be noted that in one case (where number_clusters=10
and gamma=0.1) the performance of the cluster was
slightly better than the best model by one metric
(Calinski Harabasz), nonetheless, the best model was
chosen by considering all performance metrics.
Figure 2: Different clustering models’ performance.
The results of multiple permutations for feature
importance analysis (Figure 3) illustrated that the age,
surgery type, and BMI have the highest contribution
in clustering patients, while the sex, number of
surgeries, and surgery side show a lower importance
in distinguishing patients’ groups.
Figure 3: Feature Importance based on Silhouette drop.
The green pie chart in Figure 4 shows the size of
different clusters based on the number of patients
inside them. Cluster 4 was the biggest and Cluster 2
was the smallest group of patients. The rest of the
charts demonstrate the share of patients in different
age quartiles in each cluster. It can be seen that the
youngest patients (Q1) are mostly grouped in clusters
1, 4, and 5 while the oldest patients (Q4) have a bigger
Figure 4: Age quartiles’ share in different clusters.
Figure 5: BMI quartiles’ share in different clusters.
An Unsupervised Machine Learning Approach for Clustering Hip Arthroplasty Patients: Surgery Duration Differs Among Different Patient
Groups
401
share in the rest of clusters. In a similar way, Figure 5
illustrates the share of BMI quartiles in different
patient groups. It’s noticeable that the lightest patients
are grouped in clusters 1,3,7 while the heavier ones
are located in clusters 4 and 5, and clusters 2 and 6
contain the patients with mid-range BMI.
Table 3: ANOVA test results.
One-way ANOVA
F-statistic 11.77
P-value 5.4510
-13
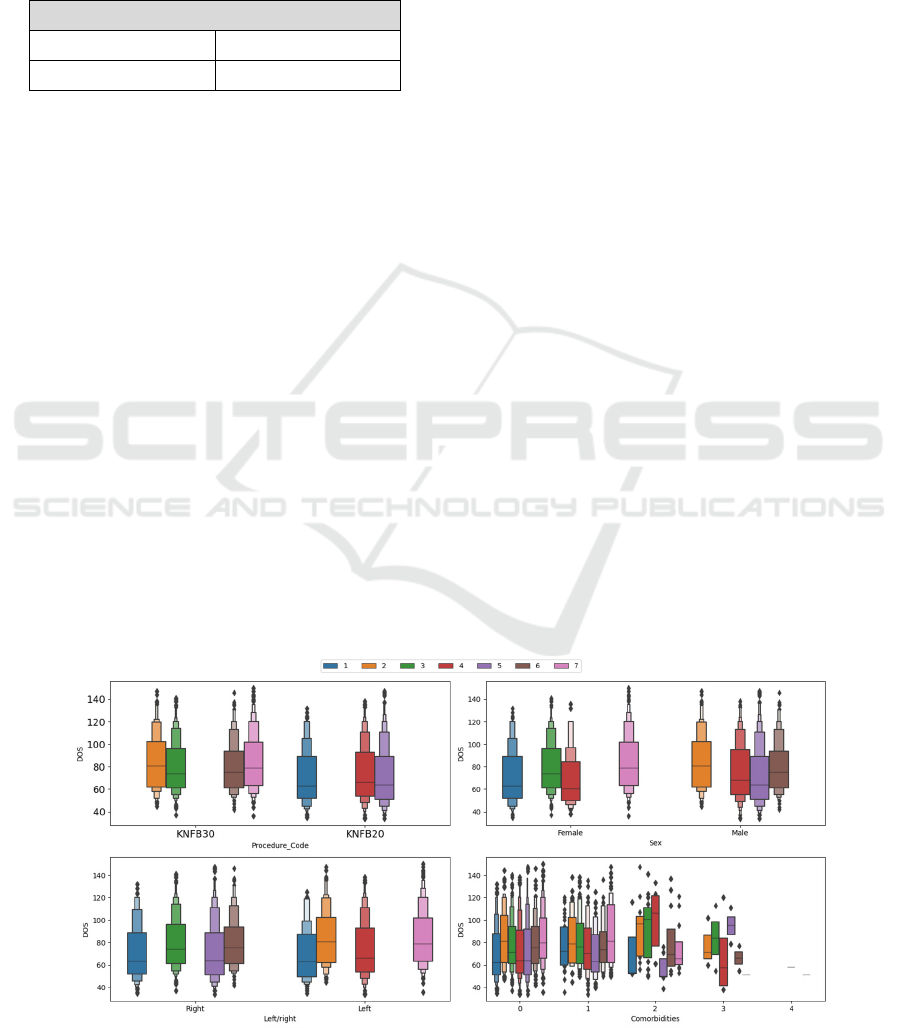
Figure 6 contains four boxplots showing the share
in different categorical variables (surgery type, sex,
surgery side, and the number of comorbidities) along
different clusters. Regarding surgery type and sex, it
is evident that the clusters are well separated in
different categories while regarding the surgery side,
cluster 1 has appeared in both categories. However,
all clusters have appeared in the first two categories
of the number of comorbidities which can be due to
the majority of patients have zero or one
comorbidities in their medical profile. Meanwhile,
the clusters in the rest categories of this variable are
more separated. Moreover, the boxplots illustrate the
differences in different clusters’ DOS in different
categories.
As reported in Table 3, the ANOVA test yielded
an F-statistic of 11.77, indicating a substantial
variance between groups’ means compared to within-
group variance. The associated p-value was
5.45 10
13
, demonstrating strong statistical
significance. This result leads to the rejection of the
null hypothesis, suggesting that at least one patient
group exhibits a mean surgery duration significantly
different from the others. Investigating the DOS
difference among clusters through post-hoc
comparison using Tukey’s HSD revealed that in
almost half of the pairwise comparisons, there is a
statistically significant difference between clusters
from the surgery duration perspective (Table 4). The
largest difference refers to the clusters 1-2, 1-7, and
5-7 and the smallest difference refers to the clusters
2-7, 3-6, and 4-5.
The analysis of results illustrated that
unsupervised machine learning can distinguish
between different patient groups. It was also shown
that the resulted clusters are statistically different
from the surgery duration perspective. This means
patients in a single group are expected to have similar
DOS, while patients in different groups are supposed
to have different DOS. This patient differentiation is
currently done based on surgeons’ or secretaries’
experience in the scheduling committee prior to the
surgery. Therefore, the derived insight from patient
clustering can be utilized as a supporting tool to
enhance decision-making quality and reliability in
surgical settings. For instance, it can help schedulers
with identifying the patient groups prone to longer
DOS. The results can also be utilized for other
medical to operational purposes. Reviewing the
literature shows that market research, gene sequence
analysis, and object recognition are the most popular
applications of unsupervised ML models in
healthcare (An et al., 2023). Unsupervised ML
clustering can also be used in other research projects
such as surgery scheduling (Thomas Schneider et al.,
2020), operational scenarios analysis (Chavosh
Nejad et al., 2022), or be utilized as an input variable
in developing prediction machine learning models
(Huang et al., 2019).
Figure 6: Categorical variables share in different clusters.
HEALTHINF 2025 - 18th International Conference on Health Informatics
402

Table 4: Turkey’s HSD test results.
Group 1 Group 2
Mean
Difference
Adjusted P-
values
Lower
b
oun
d
Upper
b
oun
d
H-0
Rejection
1 2 13.46 0.00 6.04 20.89 TRUE
1 3 8.98 0.00 2.94 15.02 TRUE
1 4 3.01 0.75 -2.94 8.95 FALSE
1 5 1.89 0.97 -4.26 8.04 FALSE
1 6 8.62 0.01 1.34 15.90 TRUE
1 7 13.38 0.00 6.94 19.82 TRUE
2 3 -4.48 0.53 -11.72 2.76 FALSE
2 4 -10.46 0.00 -17.62 -3.30 TRUE
2 5 -11.57 0.00 -18.90 -4.24 TRUE
2 6 -4.84 0.60 -13.15 3.46 FALSE
2 7 -0.08 1.00 -7.66 7.49 FALSE
3 4 -5.98 0.03 -11.68 -0.27 TRUE
3 5 -7.09 0.01 -13.01 -1.17 TRUE
3 6 -0.36 1.00 -7.46 6.73 FALSE
3 7 4.40 0.36 -1.83 10.62 FALSE
4 5 -1.11 1.00 -6.93 4.71 FALSE
4 6 5.61 0.21 -1.39 12.62 FALSE
4 7 10.37 0.00 4.25 16.50 TRUE
5 6 6.73 0.08 -0.46 13.91 FALSE
5 7 11.49 0.00 5.16 17.82 TRUE
6 7 4.76 0.49 -2.67 12.20 FALSE
4 CONCLUSION
The increasing demand for surgical services by
patients with wide ranges of personal and medical
characteristics makes operational decision-making a
difficult task that necessitates patients grouping. This
paper illustrated that unsupervised machine learning
models are able to cluster patients undergoing hip
arthroplasty surgery based on their personal and
medical characteristics. It was noticed that patients’
age, BMI, and their surgery type are important factors
in clustering them into different groups. Further,
statistical analysis revealed that there is a significant
difference between different patient clusters’ duration
of surgery (DOS) and introduces the inter-cluster
DOS differences. Future studies can include other
clinical, operational, or personal variables for
clustering patients and evaluate their contribution to
grouping patients. They can also expand the idea
through applying patient clustering results in other
research topics such as supervised machine learning
or healthcare operations optimization.
ACKNOWLEDGEMENTS
We would like to thank staff at Aalborg University
Hospital for offering us detailed insights into the
medical and operational conditions surrounding Hip
surgery.
REFERENCES
Abbas, Z., Hafeez, S., Naseem, A., Habib, Y., & Mumtaz,
H. (2022). Effect of body mass index on duration of
total knee replacement surgery: A prospective cross
sectional study. Annals of Medicine and Surgery, 82.
https://doi.org/10.1016/j.amsu.2022.104637
An, Q., Rahman, S., Zhou, J., & Kang, J. J. (2023). A
Comprehensive Review on Machine Learning in
An Unsupervised Machine Learning Approach for Clustering Hip Arthroplasty Patients: Surgery Duration Differs Among Different Patient
Groups
403

Healthcare Industry: Classification, Restrictions,
Opportunities and Challenges. In Sensors (Vol. 23,
Issue 9). MDPI. https://doi.org/10.3390/s23094178
Chavosh Nejad, M., Hadavandi, E., Nakhostin, M. M., &
Mehmanpazir, F. (2022). A data-driven model for
energy consumption analysis along with sustainable
production: A case study in the steel industry. Energy
Sources, Part A: Recovery, Utilization and
Environmental Effects, 44(2), 3360–3380.
https://doi.org/10.1080/15567036.2022.2064943
Chavosh Nejad, M., Vestergaard Matthiesen, R.,
Dukovska-Popovska, I., Jakobsen, T., & Johansen, J.
(2024). Machine learning for predicting duration of
surgery and length of stay: A literature review on joint
arthroplasty. International Journal of Medical
Informatics, 192, 105631. https://doi.org/10.1016/j.
ijmedinf.2024.105631
Crowson, C. S., Gunderson, T. M., Davis, J. M.,
Myasoedova, E., Kronzer, V. L., Coffey, C. M., &
Atkinson, E. J. (2023). Using Unsupervised Machine
Learning Methods to Cluster Comorbidities in a
Population-Based Cohort of Patients With Rheumatoid
Arthritis. Arthritis Care and Research, 75(2), 210–219.
https://doi.org/10.1002/acr.24973
Eshghali, M., Mohammad, A., & Sikaroudi, E. (2023).
Machine learning based integrated scheduling.
Grant, R. W., McCloskey, J., Hatfield, M., Uratsu, C.,
Ralston, J. D., Bayliss, E., & Kennedy, C. J. (2020). Use
of Latent Class Analysis and k-Means Clustering to
Identify Complex Patient Profiles. JAMA
Network Open, 3(12). https://doi.org/10.1001/
jamanetworkopen.2020.29068
Huang, L., Shea, A. L., Qian, H., Masurkar, A., Deng, H.,
& Liu, D. (2019). Patient clustering improves
efficiency of federated machine learning to predict
mortality and hospital stay time using distributed
electronic medical records. Journal of Biomedical
Informatics, 99. https://doi.org/10.1016/j.jbi.2019.
103291
Kuo, T., & Wang, K. J. (2022). A hybrid k-prototypes
clustering approach with improved sine-cosine
algorithm for mixed-data classification. Computers and
Industrial Engineering, 169. https://doi.org/10.
1016/j.cie.2022.108164
Madhuri, R. , et al. (2014). Cluster analysis on different data
sets using K-modes and K-prototype algorithms. ICT
and Critical Infrastructure: Proceedings of the 48th
Annual Convention of Computer Society of India-Vol
II: Hosted by CSI Vishakapatnam Chapter, 137–144.
Mannion, A. F., Nauer, S., Arsoy, D., Impellizzeri, F. M.,
& Leunig, M. (2020). The Association Between
Comorbidity and the Risks and Early Benefits of Total
Hip Arthroplasty for Hip Osteoarthritis. Journal of
Arthroplasty, 35(9), 2480–2487. https://doi.org/10.
1016/j.arth.2020.04.090
Melo Riveros, N. A., Cardenas Espitia, B. A., & Aparicio
Pico, L. E. (2019). Comparison between K-means and
Self-Organizing Maps algorithms used for diagnosis
spinal column patients. Informatics in Medicine
Unlocked, 16. https://doi.org/10.1016/j.imu.
2019.100206
Nanda, A., Mohapatra, Dr. B. B., Mahapatra, A. P. K.,
Mahapatra, A. P. K., & Mahapatra, A. P. K. (2021).
Multiple comparison test by Tukey’s honestly
significant difference (HSD): Do the confident level
control type I error. International Journal of Statistics
and Applied Mathematics, 6(1), 59–65.
https://doi.org/10.22271/maths.2021.v6.i1a.636
Nouraei, H., Nouraei, H., & Rabkin, S. W. (2022).
Comparison of Unsupervised Machine Learning
Approaches for Cluster Analysis to Define Subgroups
of Heart Failure with Preserved Ejection Fraction with
Different Outcomes. Bioengineering, 9(4).
https://doi.org/10.3390/bioengineering9040175
Pasin, O., & Gonenc, S. (2023). An investigation into
epidemiological situations of COVID-19 with fuzzy K-
means and K-prototype clustering methods. Scientific
Reports, 13(1). https://doi.org/10.1038/s41598-023-
33214-y
Rahimi, I., & Gandomi, A. H. (2021). A Comprehensive
Review and Analysis of Operating Room and Surgery
Scheduling. Archives of Computational Methods in
Engineering, 28(3), 1667–1688. https://doi.org/10.
1007/s11831-020-09432-2
Ranti, D., Warburton, A. J., Hanss, K., Katz, D., Poeran, J.,
& Moucha, C. (2020). K-Means Clustering to Elucidate
Vulnerable Subpopulations Among Medicare Patients
Undergoing Total Joint Arthroplasty. Journal of
Arthroplasty, 35(12), 3488–3497. https://doi.org/10.
1016/j.arth.2020.06.063
Thomas Schneider, A. J., Theresia van Essen, J., Carlier,
M., & Hans, E. W. (2020). Scheduling surgery groups
considering multiple downstream resources. European
Journal of Operational Research, 282(2), 741–752.
https://doi.org/10.1016/j.ejor.2019.09.029
Thongprayoon, C., Mao, M. A., Keddis, M. T., Kattah, A.
G., Chong, G. Y., Pattharanitima, P., Nissaisorakarn,
V., Garg, A. K., Erickson, S. B., Dillon, J. J., Garovic,
V. D., & Cheungpasitporn, W. (2022). Hypernatremia
subgroups among hospitalized patients by machine
learning consensus clustering with different patient
survival. Journal of Nephrology, 35(3), 921–929.
https://doi.org/10.1007/s40620-021-01163-2
Wang, Y., Zhao, Y., Therneau, T. M., Atkinson, E. J., Tafti,
A. P., Zhang, N., Amin, S., Limper, A. H., Khosla, S.,
& Liu, H. (2020). Unsupervised machine learning for
the discovery of latent disease clusters and patient
subgroups using electronic health records. Journal of
Biomedical Informatics, 102. https://doi.org/10.
1016/j.jbi.2019.103364
Yeung, E., Jackson, M., Sexton, S., Walter, W., & Zicat, B.
(2011). The effect of obesity on the outcome of hip and
knee arthroplasty. In International Orthopaedics (Vol.
35, Issue 6, pp. 929–934). https://doi.org/10.
1007/s00264-010-1051-3
Yuniartha, D. R., Masruroh, N. A., & Herliansyah, M. K.
(2021). An evaluation of a simple model for predicting
surgery duration using a set of surgical procedure
HEALTHINF 2025 - 18th International Conference on Health Informatics
404

parameters. Informatics in Medicine Unlocked, 25.
https://doi.org/10.1016/j.imu.2021.100633.
An Unsupervised Machine Learning Approach for Clustering Hip Arthroplasty Patients: Surgery Duration Differs Among Different Patient
Groups
405
