
StrikeNet: A Deep Neural Network to Predict Pixel-Sized Lightning
Location
M
´
elanie Bosc
1
, Adrien Chan-Hon-Tong
2
, Aur
´
elie Bouchard
1
and Dominique B
´
er
´
eziat
3
1
ONERA, DPHY-FPA, Palaiseau, France
2
ONERA, DTIS-SAPIA, Palaiseau, France
3
Sorbonne Universit
´
e, LIP6-CNRS, Paris, France
{melanie.bosc, adrien.chan hon tong, aurelie.bouchard}@onera.fr, dominique.bereziat@lip6.fr
Keywords:
Deep Learning, Small Objects Segmentation, Thunderstorm Risk, Very Short-Term Forecasting.
Abstract:
Forecasting the location of electrical activity at a very short time range remains one of the most challenging
predictions to make, primarily attributable to the chaotic nature of thunderstorms. Additionally, the punc-
tual nature of lightning further complicates the establishment of reliable forecasts. This article introduces
StrikeNet, a specialized Convolutional Neural Network (CNN) model designed for very short-term forecasts
of pixel-sized electrical activity locations, utilizing sequences of temporal images as input and only two data
types. Employing soft Non-Maximum Suppression (NMS) techniques, incorporating morphological features
within residual blocks, and implementing dropout regularization, StrikeNet is specifically designed for detect-
ing and predicting pixel-sized objects in images. This design seamlessly aligns with the task of forecasting
imminent electrical activity achieving F
1
score about 0.53 for the positive class (lightning) and outperforms
the state of the art. Moreover, it can be applied to similar datasets such as the Aerial Elephant Dataset (AED)
where it outperforms traditional CNN models.
1 INTRODUCTION
Atmospheric events such as turbulences, rain, hail,
and lightning can significantly impact aviation. These
dangerous phenomena are produced by cumulonim-
bus clouds, the Earth’s main lightning generators.
These clouds require specific atmospheric conditions
to form, including the presence of humidity, instabil-
ity, and a mechanism allowing the development of
convection such as convergence. Lightning strikes
produced by these systems pose a high risk to avia-
tion, striking aircraft more than once per year on av-
erage. Such incidents can lead to flight safety issues
such as electronic perturbations or structural dam-
ages and necessitate mandatory maintenance opera-
tions. These operations are expensive and could be
avoided with increasingly precise lightning strike lo-
cation forecasting.
Operational forecasting methods for mid and
long-term time range predictions (hours to days all
over the Earth) are Numerical Weather Prediction
(NWP) models, which involve resolving meteorolog-
ical equations to forecast the state of the atmosphere.
In addition, lightning strikes forecast at this horizon is
possible using belief functions or weighting functions
as in (Bouchard et al., 2022).
In recent years, studies have shown that the use of
Deep Learning (DL) could lead to promising forecast-
ing results for many atmospheric parameters such as
for thunderstorms as in (Ukkonen et al., 2017). More
recently, new foundation models, also referred to as
IA Global Weather Forecasting Models (IAGWFM),
such as GraphCast by Google (Lam et al., 2023) and
Aurora by Microsoft (Bodnar et al., 2024), have been
developed to predict multiple atmospheric parameters
over medium to long-term ranges. However, these
models are trained on NWP global forecasts, analysis,
and reanalysis data, with a spatial resolution of 0.25 °,
corresponding to an average of 28 km. Additionally,
the predictions are made for 5 to 10 days with a tem-
poral resolution of 6 hours, which is not applicable in
our context.
To forecast such precise phenomenon as lightning
strikes at a very short time horizon (<1 h and ev-
ery 5 minutes on a restricted area), a combination of
observation-based approaches and algorithmic meth-
ods can be employed like in (P
´
edeboy et al., 2016).
These methods can predict a severe weather warn-
ing within a delay of 10 minutes in 63% of all cases.
In addition, DL methods have also shown improve-
Bosc, M., Chan-Hon-Tong, A., Bouchard, A. and Béréziat, D.
StrikeNet: A Deep Neural Network to Predict Pixel-Sized Lightning Location.
DOI: 10.5220/0013110700003912
Paper published under CC license (CC BY-NC-ND 4.0)
In Proceedings of the 20th International Joint Conference on Computer Vision, Imaging and Computer Graphics Theory and Applications (VISIGRAPP 2025) - Volume 3: VISAPP, pages
299-306
ISBN: 978-989-758-728-3; ISSN: 2184-4321
Proceedings Copyright © 2025 by SCITEPRESS – Science and Technology Publications, Lda.
299

ment regarding precipitation rate prediction as shown
in (Bouget et al., 2021) but also for lightning location
forecasting as in (Zhou et al., 2020) and (Leinonen
et al., 2022).
In this study, we propose a new model to fore-
cast at a short time horizon the lightning flashes. The
model relies on a CNN architecture including mor-
phological blocks. It uses only two types of satel-
lite data as input, excluding radar data, which could
improve performance as demonstrated in (Leinonen
et al., 2023), but is unavailable over seas and oceans.
Indeed, our method aims to forecast lightning along
flight routes, even when aircraft are not over land
while improving the prediction of pixel-sized phe-
nomena, specifically lightning flashes within thunder-
storm systems.
From a machine learning point of view, this arti-
cle focuses on the precise prediction of small objects
in images through the application of CNN. To our
current knowledge, accurately forecasting such spe-
cific phenomena on such an imbalanced proportion
of small objects over the background remains poorly
understood and challenging, prompting our investiga-
tion to address this gap in understanding within the
confines of this article.
In Section 2, we will outline the data we used, fol-
lowed by an explanation of the developed model in
Section 3, then we will present the obtained results
for the forecast of lightning at a very short time range
in Section 4. In Section 5, auxiliary experiments such
as an ablation study and tests on the Aerial Elephant
Dataset (AED) have been conducted, before conclud-
ing and giving some perspectives in Section 6.
2 DATA
2.1 Data Overview
The data employed in this study are collected from
two sensors embedded in the Geostationary Opera-
tional Environmental Satellite (GOES-R/GOES-16),
operated by the National Oceanic and Atmospheric
Administration (NOAA) covering the Pacific Ocean,
the Americas, and the Atlantic Ocean. The focus
is on data captured by the Advanced Baseline Im-
ager (ABI) and the Geostationary Lightning Mapper
(GLM) sensors. These two sensors provide comple-
mentary information: the first one identifies cloudy
areas, while the second provides information about
electrical activity.
2.2 Sensor’s Data
The ABI sensor is a radiometer that offers a resolu-
tion of 0.5 km in the visible spectrum and 2 km in the
infrared (Schmit et al., 2017). It captures data across
16 wavelength bands. For this study, we specifically
utilize the 13
th
band at 10.3 µm due to its heightened
sensitivity for cloud classification. The ABI sensor
produces images every 5 minutes, offering brightness
temperature data that is particularly effective for de-
tecting low temperatures on top of clouds. This capa-
bility enables to determine if the top of a cloud is high,
indicating the likelihood of it being a cumulonimbus
and therefore the presence of lightning strikes.
In contrast, the GLM sensor (Goodman et al.,
2013) functions as a camera with a nadir spatial res-
olution of 8 km. Primarily designed for lightning de-
tection, it shows a detection rate between 70-90 %.
Operational day and night, the sensor exhibits supe-
rior performance during nighttime owing to improved
contrast. It captures images every 20 seconds. We
have selected flash information from the GLM L2
products, which are the closest to conventional light-
ning flashes. These flash positions are derived from
optical pulse locations within a 330 ms timeframe and
a 16.5 km area and are provided at a 1.1 km resolution.
Among the various observable areas, data from these
two sensors are retrieved over the CONUS (Continen-
tal United States) area, which covers North America
to the Caribbean.
2.3 Dataset Creation
We collect a dataset consisting of two distinct types
of images, to represent near-future lightning strikes
at a very short time range. Firstly, radiance im-
ages originating from band 13 of the ABI sensor are
transformed into brightness temperature images as
shown in Figure 1. Secondly, the flashes captured
by the GLM sensor are represented by white pixels
set against a black background, as it can be seen in
Figure 2. In contrast to the CONUS images, which
measure 1168 × 835, all the images are cropped to
512 × 512 pixels centered area when used as inputs
by the DL algorithms.
Spatial transformations such as down-sampling
were employed for consistency in both data types.
The lowest temporal resolution is selected, retain-
ing brightness temperature every 5 minutes, and ag-
gregating flashes for GLM sensor data in 5 minutes
time steps. Furthermore, the final spatial resolution
of the images is 3.3 km on average, which is a fine
balance between a great resolution and an acceptable
image size. The dataset encompasses data retrieved
VISAPP 2025 - 20th International Conference on Computer Vision Theory and Applications
300

from 00:00 to 05:00 UTC, selected for specific days in
January, February, and December, spanning the years
2020 to 2023. The overall database comprises 153
retrieved days, resulting in 9, 180 pairs of ABI/GLM
images and a total of 18, 360 images. Training rep-
resents 70 % of the dataset, testing is 15 % and val-
idation is 15 %, separated by days. Each dataset is
evenly balanced, with 50% of the selected dates fea-
turing thunderstorms and the remaining half without,
providing the algorithm with a diverse range of possi-
ble scenarios.
Figure 1: One sample of brightness temperature map ac-
quired on 2023/13/1 at 02:01 UTC by the ABI sensor.
Darker pixels have lower brightness temperatures and be-
long to higher top clouds. The color bar is the brightness
temperature in Kelvin.
Figure 2: Flashes location map acquired by the GLM sensor
at the same date as in Figure 1. White pixels identify the
presence of flashes, and the background is represented with
black pixels.
3 METHOD
3.1 Model’s Sequence Input
To train the model, a series of temporal sequences is
used. Each brightness temperature image is paired
with a corresponding flashes position image, consti-
tuting one input-label pair. To maintain temporal de-
pendencies between images while ensuring efficient
Figure 3: Sequential mechanism of StrikeNet.
use of computational resources, StrikeNet processes
a sequence of 4 image pairs as input. This corre-
sponds to a 20 minutes span, predicting flashes oc-
curring 5 minutes later (see Figure 3). The algorithm
considers multiple past moments to capture temporal
dynamics, with 4 timesteps chosen since adding more
did not significantly improve the performances.
3.2 Model Description
StrikeNet is a CNN designed for predicting the loca-
tion of future electrical activity. It draws inspiration
from the encoder-decoder structure of U-Net (Ron-
neberger et al., 2015) with skip connections, a neural
network predominantly utilized for semantic segmen-
tation, where each pixel in an output mask is associ-
ated with a specific label or class. The architecture of
the StrikeNet model is illustrated in Figure 4.
On the one hand, the input sequence first passes
through an encoder which consists of a repetition of
7 double convolution blocks (DC), each block be-
ing followed by a 2D maxpool layer. A DC block
is formed by 2 sequences of 2D 3 × 3 convolutional
layer with a 1-padding, batch normalization, ReLU
activation function, and 0.2 dropout, see Figure 4.
Through it, images in the input sequence are reduced
from a size of 512×512 pixels to a size of 8×8 pixels
thanks to the maxpool layers, and the number of dif-
ferent channels grows up to 1024 features in order to
catch spatial and temporal dependencies over the in-
put sequence within the more representative features.
Before going through the decoder, five residual
blocks of Super Resolution Network using Multi-
scale Spatial and Morphological features (SRN-
MSM) (Esmaeilzehi et al., 2022) are incorporated into
the architecture. The five blocks, placed between the
encoder and decoder, enhance the network’s capacity
to capture even finer image resolutions as explained
in Subsection 3.3.
On the other hand, the decoder is composed of DC
blocks each followed by a 2D upconvolution layer
and soft-NMS layer which is discussed in Subsec-
tion 3.4. This is repeated six times, and at the end,
a 1 × 1 convolution layer is applied to produce the fi-
StrikeNet: A Deep Neural Network to Predict Pixel-Sized Lightning Location
301
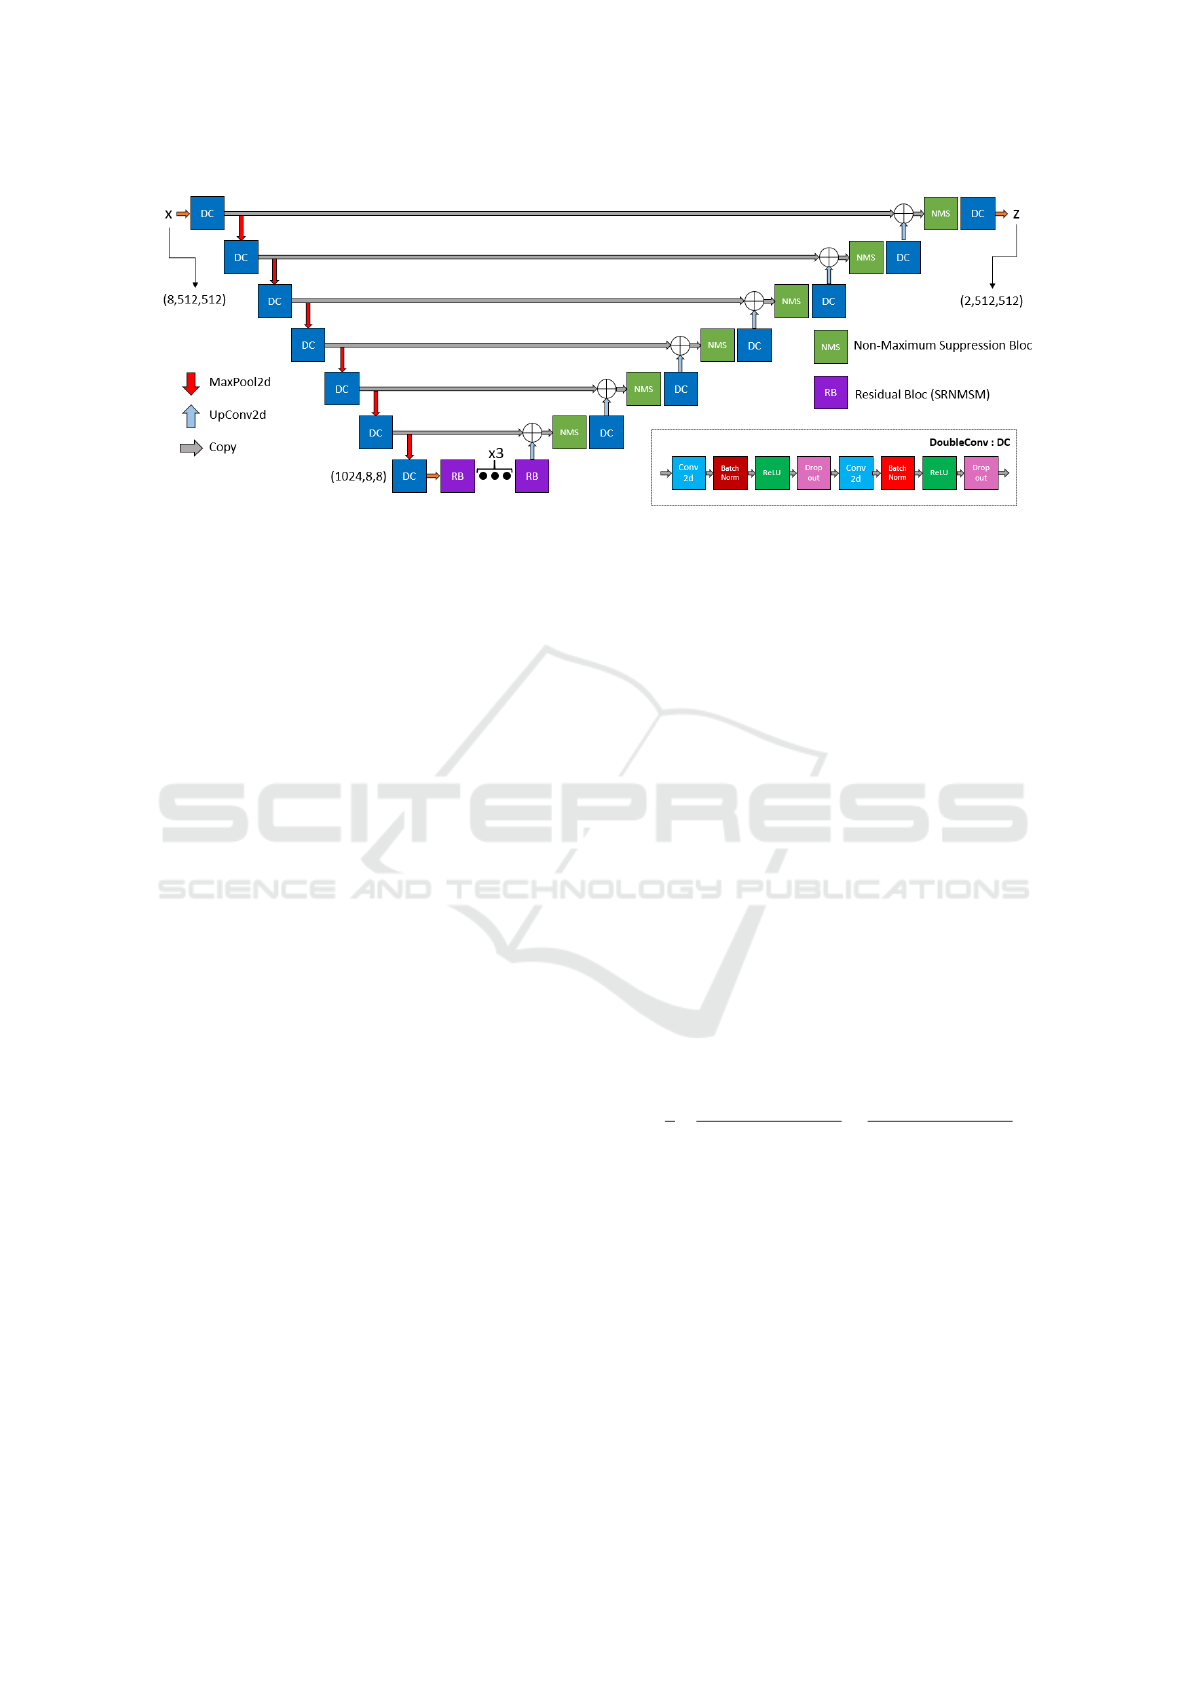
Figure 4: Architecture of StrikeNet.
nal mask representing the flashes’ location 5 minutes
later. This mask consists entirely of black pixels, rep-
resenting the background (the negative class), while
the white pixels delineate areas where lightning is pre-
dicted (the positive class).
3.3 SRNMSM Blocks
SRNMSM blocks were introduced in (Esmaeilzehi
et al., 2022) for the task of super-resolution. These
blocks add morphological operations such as ero-
sion, dilation, opening, and closing to standard CNNs.
These operations enable the network to focus more on
image textures and structures. By considering both
morphological and spatial dependencies in the im-
ages, these blocks enhance the network’s ability to
analyze the complex structures of thunderstorms and
the associated lightning strikes, which are often rep-
resented by only a few pixels in the image.
The block architecture is divided into three mod-
ules. The first is a classic block utilizing dilated con-
volutions and ReLU activations to capture spatial fea-
tures at different scales. Next, the morphological
block applies a series of morphological operations,
concatenating their results. Finally, the third module
merges the outputs of the previous blocks and adds
the result to the initial input via a skip connection.
This architecture is designed to capture both morpho-
logical and spatial features, making it well-suited for
image segmentation of small objects, which is why
we integrated it into our model.
3.4 Soft Non-Maximum Suppression
Layers
These layers, placed in the decoder part, are inspired
by the NMS technique explained in (Neubeck and
Van Gool, 2006) and are devoted to isolate pixels rep-
resenting a lightning flash. The NMS layers retain
local maxima by applying Eq. 1 in StrikeNet archi-
tecture:
x
i, j
= 10x
i, j
− 9 max
di,d j∈{−1,0,1}
x
i+di, j+d j
(1)
with x
i, j
the pixel value we focus on, and x
i+di, j+d j
its 8 nearest neighbors. This ensures that the pixel
retains its value if it is the maximum among its neigh-
bors, but significantly reduces it if it is not. Using
this type of layer ensures the network to predict only
a unique lightning strike in its neighborhood when the
probability is the highest in a 3 × 3 pixel area, thereby
reducing the false alarms.
3.5 Model Training
The training phase uses the Adam optimizer with a
10
−4
learning rate and over 80 epochs. The stan-
dard Cross-Entropy loss function is chosen, but we
also added a weighted Dice loss function to it in order
to give greater importance to finding lightnings than
background. The Dice loss function writes:
1 −
1
2
2
∑
(y
0
· z
0
) + ε
∑
y
0
+
∑
z
0
· y
0
+ ε
+
2
∑
(y
1
· z
1
) + ε
∑
y
1
+
∑
z
1
· y
1
+ ε
with ε = 10
−5
to prevent division by zero, where y
0
and y
1
are the ground truths for the lightning and
background classes, and z
0
and z
1
are the correspond-
ing predictions. This function calculates the Intersec-
tion over Union (IoU) for both classes, then takes the
mean and returns the opposite. Finally, the total loss
function can be written as in Eq 2:
loss = CrossEntropy(y, z) + αDice(y, z) (2)
with y as the ground truth matrix and z as the predic-
tion one containing confidence scores between 0 and
1 of belonging to both positive and negative classes.
VISAPP 2025 - 20th International Conference on Computer Vision Theory and Applications
302
A study of the impact of α is given in Subsec-
tion 4.2. Then, the algorithm adjusts the weights of
the model to minimize the loss function by backprop-
agation of the loss gradient in order to find the most
accurate class for each pixel on the output image and
create an accurate prediction map of the flash posi-
tions. Training is done on a NVIDIA RTX A5000 in
144 minutes and one inference is only 12 seconds.
4 RESULTS
4.1 Evaluation Metrics
StrikeNet has been tested on the dataset described in
Subsection 2.3 using various evaluation metrics. In
the testing phase, we establish an area of 9 × 9 pixels
around each real lightning flash. For each predicted
pixel, if the forecast is included in these areas, it is
not counted as a false alarm. This means that the
metrics are calculated within about 20 km tolerance
around real flashes for all models which is something
acceptable seeing the FAA standard recommendation
to avoid severe thunderstorm areas by 32 km (U.S.
Department of Transportation, 1913).
From the confusion matrix, derived from true pos-
itives (TP), true negatives (TN), false positives (FP),
and false negatives (FN), we calculate the following
metrics: Precision, Recall, IoU, F
β
. Here, TP cor-
responds to well-identified lightnings, TN to well-
identified background, FP to lightnings predicted in-
stead of background (false alarms), and FN to back-
ground predicted instead of lightnings (missed light-
nings). These metrics write:
Precision =
T P
T P+FP
Recall =
T P
T P+FN
IoU =
T P
T P+FP+F N
F
β
=
(1+β
2
)T P
(1+β
2
)T P+β
2
FN+FP
where IoU is the ratio of the intersection to the union
of the prediction and the ground truth for the positive
class.
Regarding the F
β
, we can state that if:
• β < 1 : Priority to precision
• β > 1 : Priority to recall
• β = 1 : The F
1
-Score : equivalent priority for both
precision and recall
This score is used in the next sections to demonstrate
the network’s ability to prioritize either recall or pre-
cision.
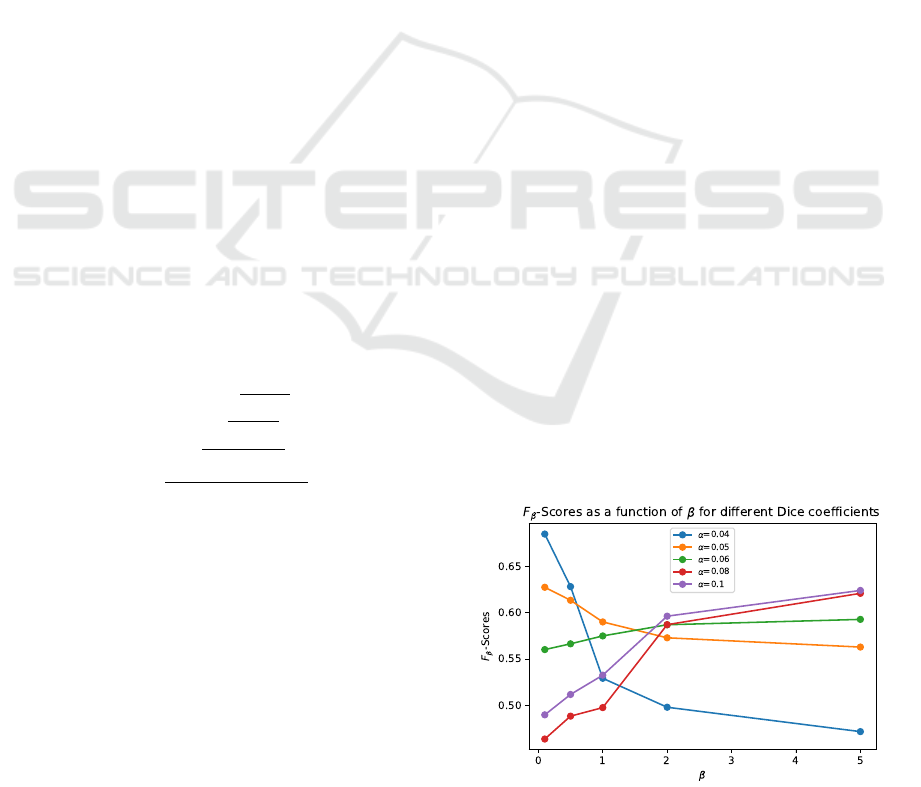
4.2 Dice Loss Function Coefficient
Study
Depending on the study, one may prioritize either
higher recall or higher precision. On the one hand, in
the case of forecasting thunderstorms and lightning,
the focus should be on detecting lightning strikes with
the lowest possible miss rate, thus maximizing re-
call, as it is a hazardous event. On the other hand,
in bank fraud detection, for example, precision needs
to be prioritized, since falsely flagging a legitimate
transaction as fraudulent can have negative impacts on
clients. In a third scenario, the goal might be to strike
a balance between recall and precision to achieve the
highest possible F
1
.
Modifying the α coefficient from Eq. 2 allows
the model to either focus more on detecting lightning
or on avoiding false alarms. Specifically, increas-
ing α makes the model prioritize detecting lightning
(thereby improving recall), while decreasing α shifts
the focus toward minimizing false alarms (thus im-
proving precision). We tested several values of α for
different values of β to compute the F
β
and found the
model’s sensitivity to α, as shown in Figure 5.
The figure illustrates that to maximize recall, one
should select a high β and, consequently, a high α to
optimize the F
β
. Conversely, to prioritize precision, a
lower β (less than 1) and a smaller α should be cho-
sen. In our case, we aim to maximize recall while
maintaining good precision, which is why we chose
α = 0.1 to optimize the F
2
score.
4.3 Comparison with Other Methods
In Table 1, we compared StrikeNet with various mod-
els, highlighting its significant outperformance over
other models. All metrics were computed across all
the test dataset. Each model underwent five training
sessions, and assessments were conducted on these
Figure 5: Model’s F
β
sensitivity to α coefficient which
varies from 0.04 to 0.1 with curves of different colors.
StrikeNet: A Deep Neural Network to Predict Pixel-Sized Lightning Location
303
distinct trained models. The results were then aver-
aged for tabulation.
First, we tested the persistence model, where the
prediction at t + 1 is based on the truth at t. This ini-
tial model demonstrates the second-best results, with
an IoU of 0.25, a F
1
of 0.40, and a F
2
about 0.31.
This shows that persistence does not give higher im-
portance to the recall, as the F
2
score is lower than
the F
1
. This can be explained by the relatively sta-
ble positions of clouds and lightning within 5-minute
intervals. We also tested the DeepLab model (Chen
et al., 2018) on our data and found very low scores,
indicating that this method is unsuitable for our study.
Furthermore, we also tested a simple U-Net (Ron-
neberger et al., 2015) model and ED-DRAP (Che
et al., 2022), an encoder-decoder model that takes
a sequence as input and employs spatial and tempo-
ral attention mechanisms. Both models demonstrated
IoU lower than 0.2, F
1
’s of 0.3 and 0.2 respectively,
and F
2
’s lower than 0.5. The F
2
’s of these two mod-
els being far higher than the F
1
’s shows that these two
models favor the recall compared to precision, while
still giving lower scores than StrikeNet. Additionally,
we can compare our results to those of (Ferreira et al.,
2024), who only use GLM data to forecast lightning
strikes over the Belem International Airport in Ama-
zonia. Their model operates on a 15 × 15 pixel grid,
with a spatial resolution of around 28 km and a fore-
cast lead time of 30 minutes. They succeed in achiev-
ing a F
1
for the positive class about 34 % as shown
in Table 1. Here, we observe that we succeeded in
achieving a better F
1
. This shows that adding bright-
ness temperature in input and using StrikeNet could
lead to better forecasting results when it comes to very
small targets such as lightnings.
Finally, StrikeNet achieved the best scores of IoU,
F
1
, and F
2
scores for the positive class with values of
0.48, 0.53, and 0.55 respectively. These results stem
from the challenge of segmenting pointwise objects,
where CNNs tend to produce blobs around strikes cor-
related with the corresponding cloud, deviating from
the goal of segmenting the strike itself. Efficient pre-
diction requires both improved recall and good preci-
sion, a feat challenging for deep networks, but effec-
tively achieved by StrikeNet.
Additionally, we evaluated StrikeNet’s perfor-
mance against other networks in a new region over
Brazil, spanning latitudes [-15°, 5°] and longitudes
[-55°, -40°], on January 1st, 2024, at 12:00 AM.
StrikeNet achieved an F1-Score of 0.53, outperform-
ing U-Net (0.38) and ED-DRAP (0.20). These results
highlight StrikeNet’s ability to effectively balance de-
tection rate and precision.
Table 1: Performances comparison with state of the art.
Models
Evaluation metrics
IoU F
1
F
2
Amazonie (Ferreira et al., 2024) // 0.34 //
Persistence 0.25 0.40 0.31
DeepLab (Chen et al., 2018) 0.04 0.07 0.16
U-Net (Ronneberger et al., 2015) 0.18 0.30 0.48
ED-DRAP (Che et al., 2022) 0.12 0.2 0.40
StrikeNet 0.48 0.53 0.55
4.4 Examples of Forecast Maps
To better visualize the results, we overlaid coasts,
brightness temperature images, truth yellow dots, red
prediction areas, and green tolerance zones on a map.
If a red pixel is in the tolerance zone defined by the
green area, this does not count as a false alarm when it
comes to the computation of the metrics as explained
in Subsection 4.1. In Figures 6 and 7, we compared
the output of U-Net and StrikeNet models for the
same acquisition date.
Figure 6 illustrates that forecasted areas are sig-
nificantly larger than the actual locations of lightning
flashes when using classical U-Net. While this leads
to a high recall, it also results in an excessively large
number of false alarms.
Figure 7 shows graphical outcomes using
StrikeNet. Lightning forecast areas are smaller and
align more closely with actual flash locations. This
results in a 30% better IoU and a 23% increase of F
1
.
While this aligns with expectations, it is important
to note that the recall has decreased as forecasted ar-
eas became less extensive.
5 AUXILIARY EXPERIMENTS
5.1 Ablation Study
In order to evaluate the impact of each component of
StrikeNet on performance, we performed an ablation
study. We tested various combinations, ranging from
a basic U-Net to the full implementation of StrikeNet.
Specifically, we trained the following models: simple
U-Net, U-Net with dropout, U-Net with softNMS, U-
Net with SRNMSM, U-Net with 5 × SRNMSM, and
StrikeNet. Our objective was to isolate and analyze
the contributions of each element in StrikeNet. The
results revealed that the model’s great performance
is due to the integration of all its layers rather than
the effect of individual components. Indeed, all mod-
els except StrikeNet achieved F
1
’s between 0.10 and
0.25, significantly lower than StrikeNet’s F
1
.
VISAPP 2025 - 20th International Conference on Computer Vision Theory and Applications
304
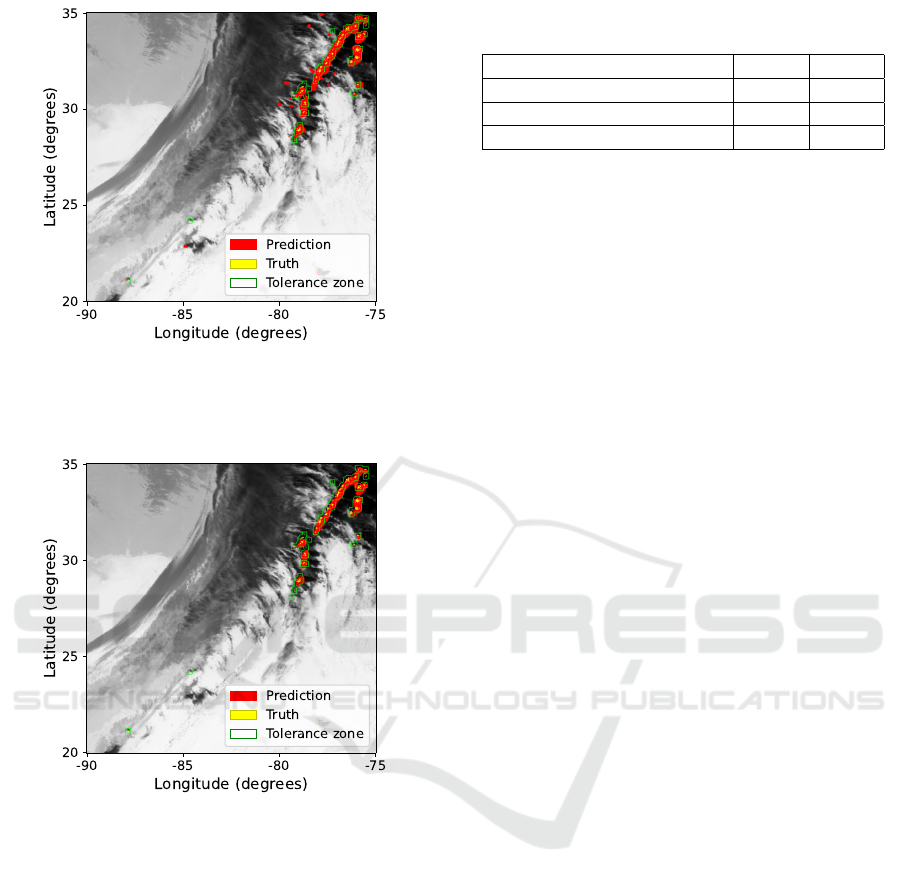
Figure 6: Forecasted map of lightning impacts (red ar-
eas) compared to the truth (yellow pixels) with tolerance
zones (green) and brightness temperature in grey with U-
Net model for the 2020/25/12 at 02:06 UTC.
Figure 7: Forecasted map of lightning impacts (red) com-
pared to the truth (yellow) with tolerance zones (green) and
brightness temperature in grey with StrikeNet model at the
same date as Figure 6.
5.2 Experiments on Aerial Elephant
Dataset
Despite the paper focusing on the relevance of
StrikeNet for strike forecasting, we want to highlight
that the issue of pixel-wise segmentation is more gen-
eral. For example, detecting or segmenting small
objects may benefit from SRNMSM blocks or soft-
NMS blocks presented in Subsection 3.4. Standard
object detection heavily relies on hard NMS, which
is effective because two large physical objects can-
not be too close. However, in the case of pixel-wise
objects, two objects may belong to neighboring pix-
els. Thus, the model must be able to segment two
real objects in adjacent pixels while also segmenting
Table 2: F
1
and IoU for the Elephant class of baseline en-
coder and StrikeNet-like versions on AED.
Models F
1
IoU
EfficientNetV2 56.4% 39.3%
EfficientNetV2 + SRNMSM 56.8% 39.6%
EfficientNetV2 + soft-NMS 58.2% 41.1%
single, isolated pixel-wise objects without triggering
false alarms nearby.
Specifically, we propose applying our approach to
the Aerial Elephant Dataset, (AED) (Naude and Jou-
bert, 2019), which contains over 2,000 large RGB
remote-sensing images with approximately 15,000
elephants annotated with single points. We cast the
dataset into the task of predicting whether there is at
least one elephant within a grid, allowing both iso-
lated and adjacent cells to be tagged as containing an
elephant. We predict a grid mask using an encoder-
only approach, with or without morphologically ori-
ented blocks or soft-NMS mechanisms.
Due to the large image size, we first downscale
the images by a factor of 2 and process them in
tiles of 256 × 256, with a grid size of 16 × 16. The
model takes a 256 × 256 image as input and predicts
a 16 × 16 binary mask, classifying each grid cell as
either background or elephant. This justifies the use
of an encoder-only model, as its feature map naturally
aligns with the required output shape.
Models are trained using Cross-Entropy, Dice
loss, and scheduler-free Adam (Defazio et al., 2024)
for 10,000 iterations. The training batch sampling
is biased to favor tiles containing elephants. For the
encoder, we use the state-of-the-art EfficientNet-V2-
S (Tan and Le, 2021).
Table 2 reports F
1
and IoU of baseline encoder
versus morphological-informed encoder on AED
(each experiment is performed twice and scores are
averaged). We observe that the StrikNet-like encoders
perform better than the baseline on AED. Currently,
adding an SRNMSM block only increases marginally
the performances but, the addition of soft-NMS ac-
tivation into the baseline improves the F
1
and IoU of
class elephant on the AED by 2 %. These auxiliary re-
sults strengthen the main contribution to the relevancy
of StrikeNet for strike forecasting.
6 CONCLUSION
This paper presents the StrikeNet neural network
model, specifically designed for generating maps pre-
dicting the short-term location of electrical activity.
The model incorporates two types of data, namely
brightness temperature maps and flash position maps
StrikeNet: A Deep Neural Network to Predict Pixel-Sized Lightning Location
305

captured simultaneously, and takes these data in a
temporal sequence as input.
The study showcases the adaptability of NNs
for predicting punctual objects in images, leverag-
ing NMS techniques, residual blocks using morpho-
logical features of images, and their integration with
dropout layers. StrikeNet yielded compelling results,
achieving an IoU of 48 %, a F
1
of 53 % and a F
2
of
55 %, outperforming other deep neural networks. The
StrikeNet encoder also showed some improvements
on other datasets such as AED compared to other
state-of-the-art networks. Compared to traditional se-
mantic segmentation models, these findings represent
a significant advancement for this type of task.
Future objectives include extending the forecast
range to an hour, with predictions every 5 minutes.
Additionally, we plan to use different data sources
such as GLM groups data or NWP outputs, and see
if it is improving the predictions.
ACKNOWLEDGEMENTS
This research is co-funded by the ALBATROS
project, from the European Union Horizon Europe
under Grant Agreement N°101077071. We thank the
NOAA National Geophysical Data Center for provid-
ing the GOES-R data.
REFERENCES
Bodnar, C., Bruinsma, W. P., Lucic, A., Stanley, M., Brand-
stetter, J., Garvan, P., Riechert, M., Weyn, J., Dong,
H., Vaughan, A., Gupta, J. K., Tambiratnam, K.,
Archibald, A., Heider, E., Welling, M., Turner, R. E.,
and Perdikaris, P. (2024). Aurora: A foundation
model of the atmosphere. arXiv 2405.1306.
Bouchard, A., Buguet, M., Chan-Hon-Tong, A., Dezert, J.,
and Lalande, P. (2022). Comparison of different fore-
casting tools for short-range lightning strike risk as-
sessment. Natural Hazards.
Bouget, V., B
´
er
´
eziat, D., Brajard, J., Charantonis, A., and
Filoche, A. (2021). Fusion of rain radar images and
wind forecasts in a deep learning model applied to rain
nowcasting. Remote Sensing.
Che, H., Niu, D., Zang, Z., Cao, Y., and Chen, X. (2022).
ED-DRAP: Encoder–Decoder deep residual attention
prediction network for radar echoes. IEEE Geoscience
and Remote Sensing Letters.
Chen, L.-C., Papandreou, G., Kokkinos, I., Murphy, K., and
Yuille, A. L. (2018). Deeplab: Semantic image seg-
mentation with deep convolutional nets, atrous convo-
lution, and fully connected crfs. IEEE Transactions
on Pattern Analysis and Machine Intelligence.
Defazio, A., Yang, X., Mehta, H., Mishchenko, K., Khaled,
A., and Cutkosky, A. (2024). The road less scheduled.
Esmaeilzehi, A., Ahmad, M. O., and Swamy, M. N. S.
(2022). SRNMSM: A deep light-weight image super
resolution network using multi-scale spatial and mor-
phological feature generating residual blocks. IEEE
Transactions on Broadcasting.
Ferreira, G. A. V. S., Leal, A. F. R., Lopes, M. N. G., and
da Rocha, L. C. (2024). Lightning nowcast on airports
in the amazon region using machine learning.
Goodman, S. J., Blakeslee, R. J., Koshak, W. J., Mach,
D., Bailey, J., Buechler, D., Carey, L., Schultz, C.,
Bateman, M., McCaul, E., and Stano, G. (2013). The
goes-r geostationary lightning mapper (GLM). Atmo-
spheric Research.
Lam, R., Sanchez-Gonzalez, A., Willson, M., Wirnsberger,
P., Fortunato, M., Alet, F., Ravuri, S., Ewalds, T.,
Eaton-Rosen, Z., Hu, W., Merose, A., Hoyer, S., Hol-
land, G., Vinyals, O., Stott, J., Pritzel, A., Mohamed,
S., and Battaglia, P. (2023). Learning skillful medium-
range global weather forecasting. Science.
Leinonen, J., Hamann, U., and Germann, U. (2022).
Seamless lightning nowcasting with recurrent-
convolutional deep learning. Artificial Intelligence
for the Earth Systems.
Leinonen, J., Hamann, U., Sideris, I. V., and Germann, U.
(2023). Thunderstorm nowcasting with deep learn-
ing: A multi-hazard data fusion model. Geophysical
Research Letters.
Naude, J. and Joubert, D. (2019). The aerial elephant
dataset: A new public benchmark for aerial object de-
tection. In Conference on Computer Vision and Pat-
tern Recognition.
Neubeck, A. and Van Gool, L. (2006). Efficient non-
maximum suppression. In 18th International Confer-
ence on Pattern Recognition (ICPR’06).
P
´
edeboy, S., Barneoud, P., and Berthet, C. (2016). First
results on severe storms prediction based on the french
national lightning locating system. In International
Lightning Detection Conference.
Ronneberger, O., Fischer, P., and Brox, T. (2015). U-
Net: Convolutional networks for biomedical image
segmentation. In Medical Image Computing and
Computer-Assisted Intervention.
Schmit, T. J., Griffith, P., Gunshor, M. M., Daniels, J. M.,
Goodman, S. J., and Lebair, W. J. (2017). A closer
look at the ABI on the GOES-R Series. Bulletin of the
American Meteorological Society.
Tan, M. and Le, Q. (2021). EfficientNetV2: Smaller mod-
els and faster training. In International conference on
machine learning. PMLR.
Ukkonen, P., Manzato, A., and M
¨
akel
¨
a, A. (2017). Evalu-
ation of thunderstorm predictors for finland using re-
analyses and neural networks. Journal of Applied Me-
teorology and Climatology.
U.S. Department of Transportation, F. A. A. F.
(2/19/13). Advisory circular (ac) no 00-24c.
https://www.faa.gov/documentlibrary/media/
advisory circular/ac%2000-24c.pdf.
Zhou, K., Zheng, Y., Dong, W., and Wang, T. (2020). A
deep learning network for cloud-to-ground lightning
nowcasting with multisource data. Journal of Atmo-
spheric and Oceanic Technology.
VISAPP 2025 - 20th International Conference on Computer Vision Theory and Applications
306
