
Why Does It Look like this? Introducing a Preliminary Framework for
Explainable Graph Drawing (XGD)
Keisi C¸ ela
1 a
, Stef van den Elzen
2 b
, Jarke van Wijk
2 c
and Alessio Arleo
2,1 d
1
Vienna University of Technology, Vienna, Austria
2
Eindhoven University of Technology, Eindhoven, The Netherlands
keisicela@icloud.com, {a.arleo, s.j.v.d.elzen, j.j.v.wijk}@tue.nl
Keywords:
Explainable Artificial Intelligence, Graph Drawing, Network Visualization.
Abstract:
The discipline of Explainable Artificial Intelligence (XAI) enhances the transparency and trustworthiness of
AI models by providing human-readable interpretable explanations for AI-driven decisions. The recent intro-
duction of AI-accelerated techniques to the graph drawing community brings the challenge of comprehending
the black-box ML and AI outputs when suggesting a layout for a specific graph - a problem we dub Explain-
able Graph Drawing (XGD). As a first step in addressing this challenge, this paper introduces a preliminary
framework to match existing XAI methods to present and future AI approaches in graph drawing. This sup-
ports researchers in framing the used AI algorithm in XAI literature and helps in selecting the appropriate
explanation method. We apply our approach on a chosen AI technique for graph drawing and present our
findings. Finally, we discuss future perspectives and opportunities for explainable graph drawing.
1 INTRODUCTION
AI influence in visualization is growing, automating
and simplifying aspects of the visualization design
process. Recently, AI algorithms were introduced in
Graph Drawing (GD) - that is the discipline of gener-
ating geometric representations of network data. AI
supports the construction of layouts for nodes and
edges by optimizing factors such as nearest neigh-
bors, space-filling curves, and repulsive and attrac-
tive forces (Wang et al., 2020; Wang et al., 2023;
Yan et al., 2022; Cao et al., 2022). However, one
of the concerns that is usually expressed when dis-
cussing the use of AI in visualization and data analy-
sis in general, is how to trust the results (Elzen et al.,
2023). Trust can come from comprehending how
the AI-powered results were generated, providing the
user with sufficient means to comprehend the reasons
behind the algorithm output.
XAI aims to make AI systems transparent and un-
derstandable, enhancing trustworthiness by providing
detailed explanations of AI processes (Barredo Ar-
rieta et al., 2020). In graph analysis, XAI could
a
https://orcid.org/0009-0008-3338-9741
b
https://orcid.org/0000-0003-1245-0503
c
https://orcid.org/0000-0002-5128-976X
d
https://orcid.org/0000-0003-2008-3651
provide human-readable explanations, aiding in val-
idating and understanding AI-driven insights. Popu-
lar XAI methods, such as Local Interpretable Model-
agnostic Explanations (LIME), Shapley Additive Ex-
planations (SHAP), and Layer-wise Relevance Prop-
agation (LRP), offer flexible, interpretable methods
that clarify AI predictions (Ribeiro et al., 2016;
Ribeiro et al., 2018; Simonyan et al., 2014). While
XAI facilitates the understanding and elucidation of
AI methodologies, deciding which XAI method to use
in each specific analysis context remains an open and
challenging issue, as many aspects are involved and
selecting an appropriate method is non-trivial.
We seek to bridge the gap between AI models in
GD and XAI techniques and address the challenge of
supporting users in “opening the black box” of AI-
accelerated GD methods, with the help of currently
existing XAI techniques. Therefore, the paper intro-
duces a preliminary framework that identifies and or-
ganizes key dimensions of XAI in GD, derived from
literature review. These dimensions include explana-
tion aspects, verification approaches, and user- and
task-related features (Miksch and Aigner, 2014). By
identifying and categorizing these dimensions, our
goal is to outline how existing XAI methods can be
applied to improve the understanding of AI reasoning
in the context of GD (Gobbo et al., 2022). To demon-
strate the utility of the framework, we apply it to a
Çela, K., van den Elzen, S., van Wijk, J. and Arleo, A.
Why Does It Look like this? Introducing a Preliminary Framework for Explainable Graph Drawing (XGD).
DOI: 10.5220/0013111100003912
Paper published under CC license (CC BY-NC-ND 4.0)
In Proceedings of the 20th International Joint Conference on Computer Vision, Imaging and Computer Graphics Theory and Applications (VISIGRAPP 2025) - Volume 1: GRAPP, HUCAPP
and IVAPP, pages 851-858
ISBN: 978-989-758-728-3; ISSN: 2184-4321
Proceedings Copyright © 2025 by SCITEPRESS – Science and Technology Publications, Lda.
851

case study (Kwon et al., 2019), mapping the identified
dimensions to corresponding XAI methods. Through
this analysis, we explore how XAI techniques can
support transparency and trust in AI-accelerated GD
methods. We include a reflection about the value
of XAI in GD and expansion opportunities for our
framework.
2 LITERATURE REVIEW
In this section, we present a succinct summary of the
current state of the art and of the related literature that
also acted as an inspiration for our work.
Understanding Human-AI Interaction. The founda-
tional elements of XAI strategies can be categorized
along two dimensions: explaining approaches (or ex-
plainers) and verification methods. An explainer is
identified as an XAI method used to explain the out-
put of the AI model while considering the given in-
put. On the other hand, we use verification methods
to ensure that users correctly understood the explana-
tion presented to them, therefore ensuring its success.
Gobbo and El-Assady (Gobbo et al., 2022) identify
the key attributes of these two dimensions and dis-
cuss how they are quite diverse and encompass as-
pects such as the task (action carried out through the
explanation), the type of data employed, the combi-
nation of media and language (medium), the way in
which blocks are connected (path), the type of navi-
gation and exploration allowed (exploration), the tar-
get user, and the usage and fruition scenarios (sce-
nario) (Gobbo et al., 2022). The explanation pro-
cess in XAI has been investigated in the work by El-
Assady et al. (El-Assady et al., 2019). This process is
as a sequence of phases, consisting of explanation and
verification blocks. Each block employs a specific
medium and strategy for explanation or verification.
These blocks are interconnected through pathways,
which can be linear or iterative, allowing the building
blocks to be visited once or multiple times. Pathways
also define the type of navigation, which can be either
guided or open for exploration. In this model, medi-
ums such as verbal explanations, visualizations, and
multimedia are used for effective communication in
regards to the data (Gobbo et al., 2022). Holter and
El-Assady (Holter and El-Assady, 2024) expand on
this by proposing a design space for human-AI col-
laboration, organized into three categories: Agency
(who controls the analysis), Interaction (communica-
tion between human and AI), and Adaptation (how
they learn from each other).
Explanation Approaches. Arrieta et al. (Barredo Ar-
rieta et al., 2020) discuss various types of explana-
tion approaches in XAI and how they cater to differ-
ent aspects (text, visual, local, by example, by sim-
plification, feature relevance). Spinner et al. (Spin-
ner et al., 2020) propose a framework for interactive
and explainable machine learning that enables users
to (1) understand machine learning models; (2) di-
agnose model limitations using different explainable
AI methods; as well as (3) refine and optimize the
models. It discusses types of explainers, both single
and multi-model. Model-specific and model-agnostic
(single), provide insights into individual model states,
either by delving into the model’s internal structure
(specific) or by treating the model as a black box (ag-
nostic) (Ribeiro et al., 2018). Multi-model explainers
offer a broader perspective by allowing for compara-
tive analysis across different model states, aiding in
model selection and refinement. Spinner et al. (Spin-
ner et al., 2020) also analyze the level-abstraction-
dependency properties and explain how each of them
contribute to the model of the explainer. The level
property refers to the data coverage by the explainer
(‘local’ or ‘global’). The abstraction dimension con-
cerns the model coverage, which is divided into ‘low’
and ‘high’ abstraction. The dependency aspect spec-
ifies the necessary inputs for the explainer to func-
tion and it can involve dependencies on data, model
specifics, or domain knowledge.
AI in Graph Drawing. AI has been introduced in
graph drawing recently, but proved to be an already
fruitful and thriving combination. There are sev-
eral applications of deep learning in the context of
end-to-end graph drawing, including (but not lim-
ited to) DL4GD (Giovannangeli et al., 2021; Giovan-
nangeli et al., 2024), DeepGD (Wang et al., 2020),
Deep4GD (Wang et al., 2023), DeepFD (for generat-
ing force-directed layouts of large graphs) (Cao et al.,
2022), GRAPHULY (Yan et al., 2022). Tiezzi et
al. (Tiezzi et al., 2024) build on graph neural network
research to propose graph neural drawers. Optimiza-
tion methods that produce a layout by iteratively im-
proving on a set of aesthetic criteria expressed as dif-
ferentiable function using, e.g., gradient descent (as
in the paper by Ahmed et al. (Ahmed et al., 2022)),
have been explored as well.
Assessment. From our analysis, we identify two key
points. First, while there is significant interest in
applying AI to graph drawing, most studies focus
solely on optimizing layout quality metrics and eval-
uate the results post-hoc, without exploring why spe-
cific embeddings are produced. Second, visualization
research increasingly seeks to deepen understanding
of AI recommendations. This paper aims to raising
awareness on XGD and encourage on expanding the
research at the intersection of XAI and GD.
IVAPP 2025 - 16th International Conference on Information Visualization Theory and Applications
852

3 A FRAMEWORK FOR XGD
In this section, we present and discuss our categoriza-
tion of the dimensions of AI-accelerated graph layout
methods. The methodology is illustrated in Figure 1.
Our work on this categorization started with a
comprehensive review of the literature to examine the
state-of-the-art of XAI and AI methods in GD. This
exploration was guided by the question: “How are
XAI methods constructed and how do they work in
the context of GD?” This process informed the foun-
dational elements of our framework and was further
inspired by prior works (Gobbo et al., 2022; Spinner
et al., 2020). Specifically, Gobbo et al.(Gobbo et al.,
2022) influenced the identification of our framework’s
main “building blocks” (explanation and verification
strategies), while Spinner et al.(Spinner et al., 2020)
provided insights into categorizing explainer models
and their characteristics.
3.1 Conceptual Framework Layout
The presented framework serves as both a strategic
guide and a practical tool, helping to navigate the
complexities of selecting appropriate XAI methods
for specific GD challenges. At a high-level, it is di-
vided into two main branches that represent the foun-
dational blocks of our framework (see Figure 2). The
first is the Explanation: within this block we include
the type of reasoning strategy used to explain the AI
result (inductive, deductive, contrastive). The second
is Verification. Under this branch we include the
methods used for ensuring that users understood the
explanation (flipped classroom, reproduction, trans-
fer). We describe and detail both of these dimensions
in the following.
3.2 Explanation
By explanation, we mean the process of making
something clear or understandable by describing its
cause, purpose, and underlying mechanisms. The ex-
planation could be further categorized into strategy,
approach, and model.
3.2.1 Strategy
Within our framework, we define explanation strate-
gies as follows. Inductive strategies break down com-
plex structures into clear, manageable parts and pro-
vide illustrative examples and metaphors to enhance
understanding (top-down). Notable examples include
approaches such as Divide and Conquer, Depth First
Breadth First, Teaching by Categories, Simplification
Figure 1: An illustration of the methodology approach that
guided the research and evaluation process of this paper.
Once the components building the framework were identi-
fied during the research phase, they were then used to build
the framework as well as analyze XAI methods. The built
framework was applied to a selected AI GD technique to
select an appropriate XAI method.
and many others as presented in Figure 2. Deductive
strategies, on the other hand, aggregate graph compo-
nents, offer detailed and high-level explanations, and
narrate the decision-making process to reveal the AI
model’s logic (bottom-up). Contrastive strategies ex-
plain the task at hand by highlighting differences be-
tween alternative outcomes or decisions, focusing on
why a specific result was chosen over others, and pro-
viding clarity through comparisons.
Attributes. Explanation strategies are defined by var-
ious attributes, which facilitate the AI-user interac-
tion (Gobbo et al., 2022; El-Assady et al., 2019). The
type of data employed in the system, the target user,
and the task to be carried out through the explanation,
all together form what we later refer to as Data-Users-
Tasks triangle, present by (Miksch and Aigner, 2014).
We also consider the combination of media and lan-
guage adopted (medium), the way in which the build-
ing blocks are connected (path) and navigated (explo-
ration), the usage scenarios, and the specialized area
of application (domain) as additional building blocks
attributes.
Data, Users, Tasks. We also integrated the Data-
Users-Tasks triangle (Miksch and Aigner, 2014) in
our attributes list, as these three aspects focus on crit-
ical elements considered in the final visualization de-
sign. The technical expertise of the intended user and
domain-specific knowledge, are pivotal in choosing
an XAI or visualization method that is both under-
standable and applicable. The selection of an XAI
method is also influenced by the nature of the task.
The complexity of the task, the nature of decision-
making it involves, and the required explanation de-
tail vary; complex tasks may need detailed, feature-
Why Does It Look like this? Introducing a Preliminary Framework for Explainable Graph Drawing (XGD)
853
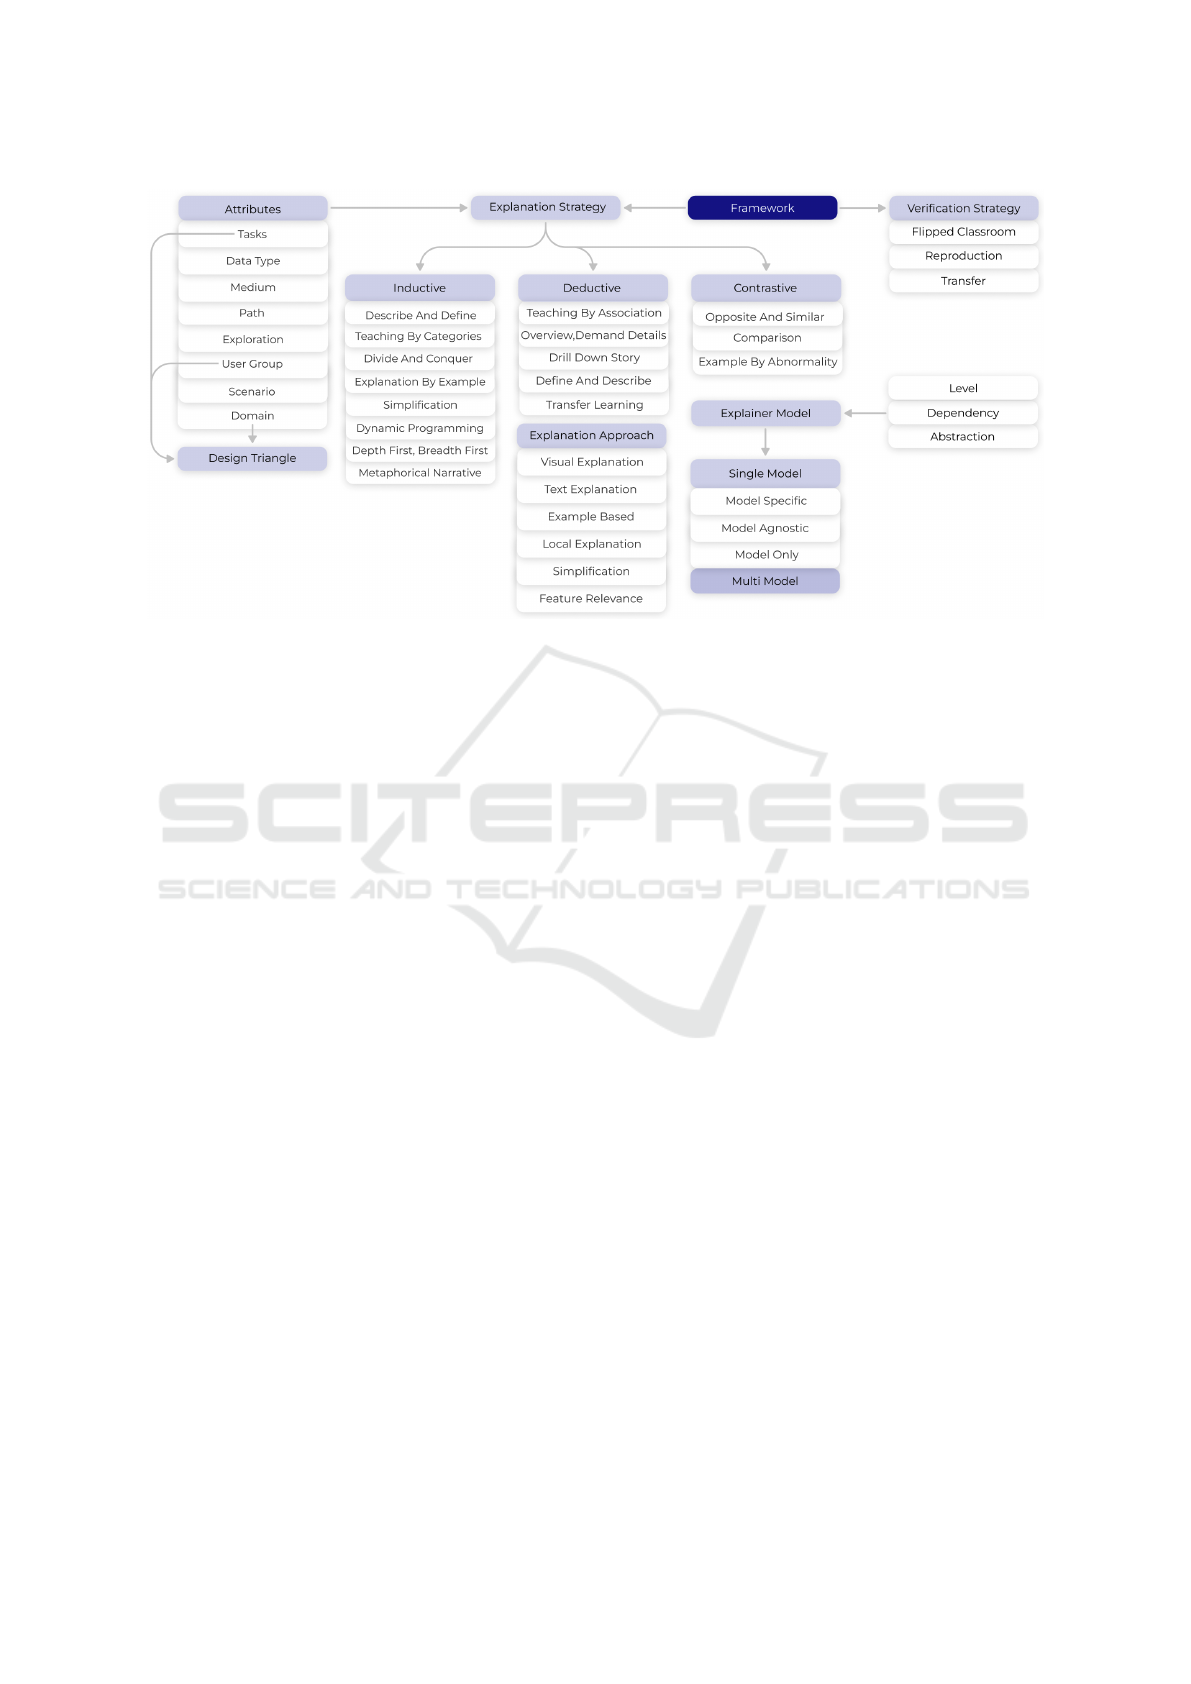
Figure 2: Extended overview of the framework, composed of the two building blocks, the attributes (including the design
triangle), explanation approach, explainer model and the level-abstraction-dependency relationship.
specific explanations, whereas simpler tasks might
only necessitate a basic understanding of the decision
process. In the context of XGD, the audience might
include data scientists, network analysts, and domain
experts; the tasks are more tailored to understanding
the reasons behind a network embedding given a spe-
cific parameter selection applied to a GD algorithm.
Medium, Path, Exploration, Scenario. Attributes
such as the medium, encompass the combination of
media and language, the path explains the method by
which blocks are interconnected, the exploration ex-
plains the type of navigation permitted, and the us-
age and application contexts describes the scenario
(Gobbo et al., 2022; El-Assady et al., 2019).
Domain. The choice of XAI method is heavily influ-
enced by the domain in which it is applied. For exam-
ple, healthcare prioritizes accuracy and interpretabil-
ity, while finance may focus on regulatory compli-
ance, influencing the selection process based on the
type of data and decision criticality inherent to the do-
main (Miksch and Aigner, 2014). Therefore, physi-
cians and nurses require detailed, clinically relevant
explanations, while patients benefit from simpler, ac-
cessible insights (Miksch and Aigner, 2014). Simi-
larly, in GD, the XAI method must cater to the vary-
ing needs of network analysts, data scientists, and
domain-specific experts, ensuring that the explana-
tions provided by the XAI methods are appropriate
for the intended audience, relevant to the domain, and
suitable for the specific tasks at hand.
3.2.2 Approach
Explanation approaches include text explanations
(generating text to explain AI model decisions), visu-
alizations (graphical representations), local explana-
tions (explaining specific decisions or aspects of the
AI model, not the entire model), example-based ex-
planations (examples to illustrate how the AI model
functions or makes decisions), simplifications (creates
a simpler model that approximates a more complex
behavior), and feature relevance (explains the impor-
tance of different features) (Barredo Arrieta et al.,
2020). These explanation approaches are particularly
suited for the context of GD, addressing various as-
pects in focus and complexity.
For instance, text explanations aim to simplify and
articulate the decision-making process of AI mod-
els. For example, when a user clicks on a node,
a text-based explanation could clarify its placement
by describing the influence of its connectivity, de-
gree, or proximity to other nodes. Similarly, visu-
alizations make it easier to interpret complex rela-
tionships within a graph by presenting them in an in-
tuitive, graphical form—such as heatmaps highlight-
ing feature importance or diagrams depicting struc-
tural relationships. Example-based explanations can
offer users relatable scenarios, demonstrating how
changes in inputs (e.g., adding or removing edges) af-
fect the resulting layout. Simplifications address the
need for interpretability by approximating the behav-
ior of complex graphs with simpler surrogate mod-
els. For instance, a linear regression model might
be used to approximate how edge crossings are mini-
IVAPP 2025 - 16th International Conference on Information Visualization Theory and Applications
854

mized in a graph layout, providing an easy-to-follow
explanation for a technically complex process. Fea-
ture relevance provides a deeper, more technical in-
sight into how specific graph attributes (e.g., node de-
gree, edge weights, clustering coefficients) influence
the layout process. Local explanations are particu-
larly useful for tasks requiring granular insights, such
as justifying the placement of an individual node or
cluster, while example-based explanations can offer
users relatable scenarios, demonstrating how changes
in inputs (e.g., adding or removing edges) affect the
resulting layout. Depending on the specific task and
audience, certain explanation approaches may prove
more effective than others.
Level-Abstraction-Dependency Decision Parame-
ters. Another key element of the framework are
the level-abstraction-dependency decision parame-
ters. By incorporating these three dimensions, the
framework gains precision in selecting the appropri-
ate XAI methods. The abstraction level and user per-
spective from the design triangle mentioned above are
crucial in determining the depth of detail needed in
the explanations for explainable GD.
Global explainability methods such as Partial De-
pendence Plots (PDP) provide a broad view of how
features affect a model’s output, which is valuable
for stakeholders needing a general understanding of
what drives model decisions in graph layouts (Spinner
et al., 2020). Conversely, Local explainability meth-
ods like LIME (Ribeiro et al., 2016) or SHAP (Lund-
berg and Lee, 2017) focus on individual predictions
and are essential in fields like telecommunications or
bioinformatics where detailed explanations for spe-
cific graph structures are necessary.
Abstraction in XAI, which determines how de-
tailed or simplified explanations should be, must
match the user’s expertise and the complexity of
the task. For example, graph models used by net-
work analysts may require more detailed explana-
tions, whereas those for the general public or non-
experts should be more simplified.
The dependency aspect in XAI addresses how ex-
planations consider feature interdependencies in data,
domain and model. Methods like SHAP account for
interactions between features, which is important in
GD models where these interactions significantly in-
fluence the layout.
3.2.3 Model
A model is identified as an XAI method used to ex-
plain the output of the AI model while considering
the given input. Identifying components like the user-
domain-task and the level-abstraction-dependency re-
lationships in the framework aids in selecting the ap-
propriate explainer model, as outlined in Section 2.
We categorize explainers as single and multi-model,
following the description in the paper by Spinner et
al. (Spinner et al., 2020).
Single-model explainers (model-agnostic and
model-specific) focus on understanding and refining
a single model by analyzing its inputs, outputs, and
internal mechanisms. In the context of GD, single-
model explainers can help dissect and improve indi-
vidual graph layout algorithms by providing in-depth
analyses of how specific inputs influence the graph
structure. In explainable GD, model-agnostic ex-
plainers can provide general insights into the effec-
tiveness of the layout without needing to understand
the algorithm’s inner workings (remaining in a black-
box nature), whereas model-specific explainers can
offer detailed explanations on how specific layout al-
gorithms operate. For GD, architecture-focused ex-
plainers can provide insights into the computational
processes behind the layout generation.
Multi-model explainers are valuable for conduct-
ing comparative analyses between different model
states, helping to choose the best configuration or un-
derstand varied parameter effects. For GD, this is par-
ticularly useful in comparing different graph layout
algorithms to determine which provides the most ac-
curate or visually appealing representations for spe-
cific datasets.
3.3 Verification
Our second fundamental block of this framework is
verification. It is a critical step following the expla-
nation of an AI method, because it ensures that users
not only receive the explanation, but also genuinely
understand it and can act on it. This process builds
trust and confidence in the AI system by validating
that the user has understood how the model works and
how decisions are made. Without verification, there is
a risk that users may misinterpret explanations, lead-
ing to incorrect conclusions or ineffective use of the
AI’s insights. We include reproduction, transfer, and
flipped classroom as three distinct methods of verifi-
cation in the framework. In a reproduction set, users
are asked to reproduce the models output, but when
using transfer in verifying, it is crucial that they are
able to apply the model in a similar set of inputs
that result in a valuable and correct output. Apart
from these two methods, flipped classroom works in
a slightly different way, where the users are now the
explainers of the model.
Why Does It Look like this? Introducing a Preliminary Framework for Explainable Graph Drawing (XGD)
855
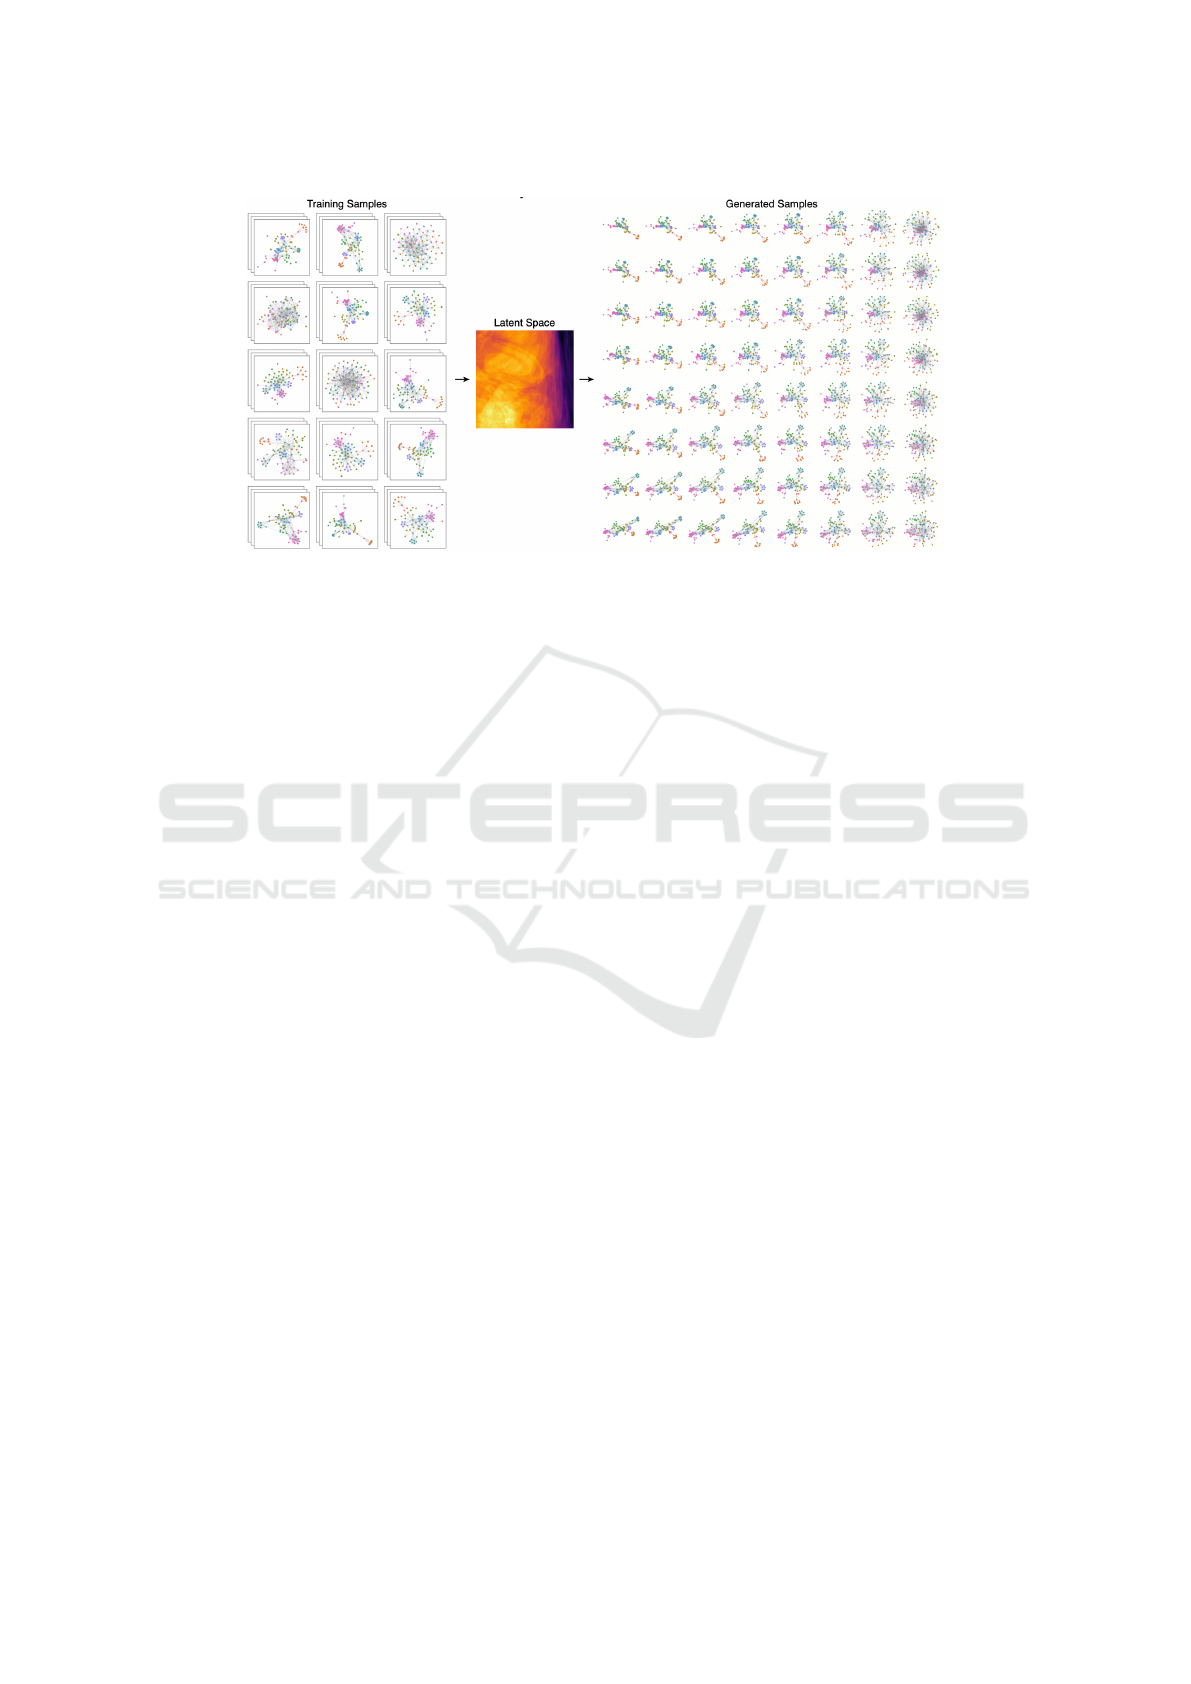
Figure 3: Figure from the paper by Kwon and Ma (Kwon et al., 2019). Within the grid of generated samples (right side of the
picture), smooth transitions between the different layouts can be seen. The color mapping of the latent space represents the
shape-based metric (Eades et al., 2017) of the generated samples.
4 FRAMEWORK APPLICATION
We apply our framework to a GD paper with AI ele-
ments, breaking it down along its dimensions. We in-
troduce three well-known and highly used methods:
LIME, SHAP, and LRP. Then, we discuss which of
the three mentioned XAI methods could be feasible
considering the characteristics of the dimensions as
highlighted by the XGD framework.
Foreword. LIME, SHAP, and LRP are distinct XAI
methods, all with unique characteristics (Alicioglu
and Sun, 2022). LIME uses a surrogate model, sam-
pling data points around an example, and learning a
linear model to highlight local feature importances.
SHAP, based on Shapley values and game theory, cal-
culates the contribution of each feature to the final
prediction. LRP uses backward propagation to as-
sign relevance scores, specifying feature importances
(Alicioglu and Sun, 2022). The primary distinction
is their approach: LIME uses linear approximation,
SHAP employs a game-theoretic method, and LRP
uses backward propagation.
Analysis and Discussion. We apply our XGD frame-
work to a paper by Kwon and Ma (Kwon et al.,
2019) about an innovative approach of deep learn-
ing in the context of GD. The selection criteria for
this paper was the innovative approach in deep learn-
ing methods concerning GD. Deep learning auto-
mates and optimizes tasks by reducing dependency
on existing algorithms, learning graph features au-
tonomously, and once trained these models gener-
ate layouts faster compared to traditional approaches,
with similar quality metrics. We use our framework to
evaluate how SHAP, LRP, and LIME fit as XAI meth-
ods for this technique.
The paper introduces a deep generative model for
GD, shown in Figure 3. This model aims to al-
leviate the labor-intensive and time-consuming pro-
cess of graph layout design, which is often a trial-
and-error method for users. The study presents an
encoder-decoder architecture to learn from a collec-
tion of graph layout examples, which then enables the
generation of new, diverse layouts. The model gener-
ates a 2D latent space of different layouts for the users
to explore, making it more intuitive and less reliant on
user expertise or manual tweaking of parameters.
The breakdown of the technique along the dimen-
sions of our framework is illustrated in Table 1. Since
the variational autoencoder generates layouts based
on encoded graph attributes, we suggest SHAP as ap-
propriate for local feature importance explanations.
SHAP aims to show how individual node or edge at-
tributes (such as node centrality or connectivity) im-
pact their positions in the final layout by analyzing
how much each feature contributes to a particular lay-
out decision. The task, one of the attributes in the
framework, would be to help users understand why
certain nodes are placed together or why certain graph
attributes are emphasized in the layout.
As far as global explanations go, LRP could po-
tentially enable the back-tracing through the Graph
Neural Network (GNN) encoded layers to highlight
how different parts of the graph structure are pro-
cessed and how this affects the latent representation.
Considering these observations, the framework com-
ponent that could have the most weight in determining
the XAI method is the Data-Users-Tasks aspects (see
Section 3.2.1). Depending on the expertise and the
IVAPP 2025 - 16th International Conference on Information Visualization Theory and Applications
856
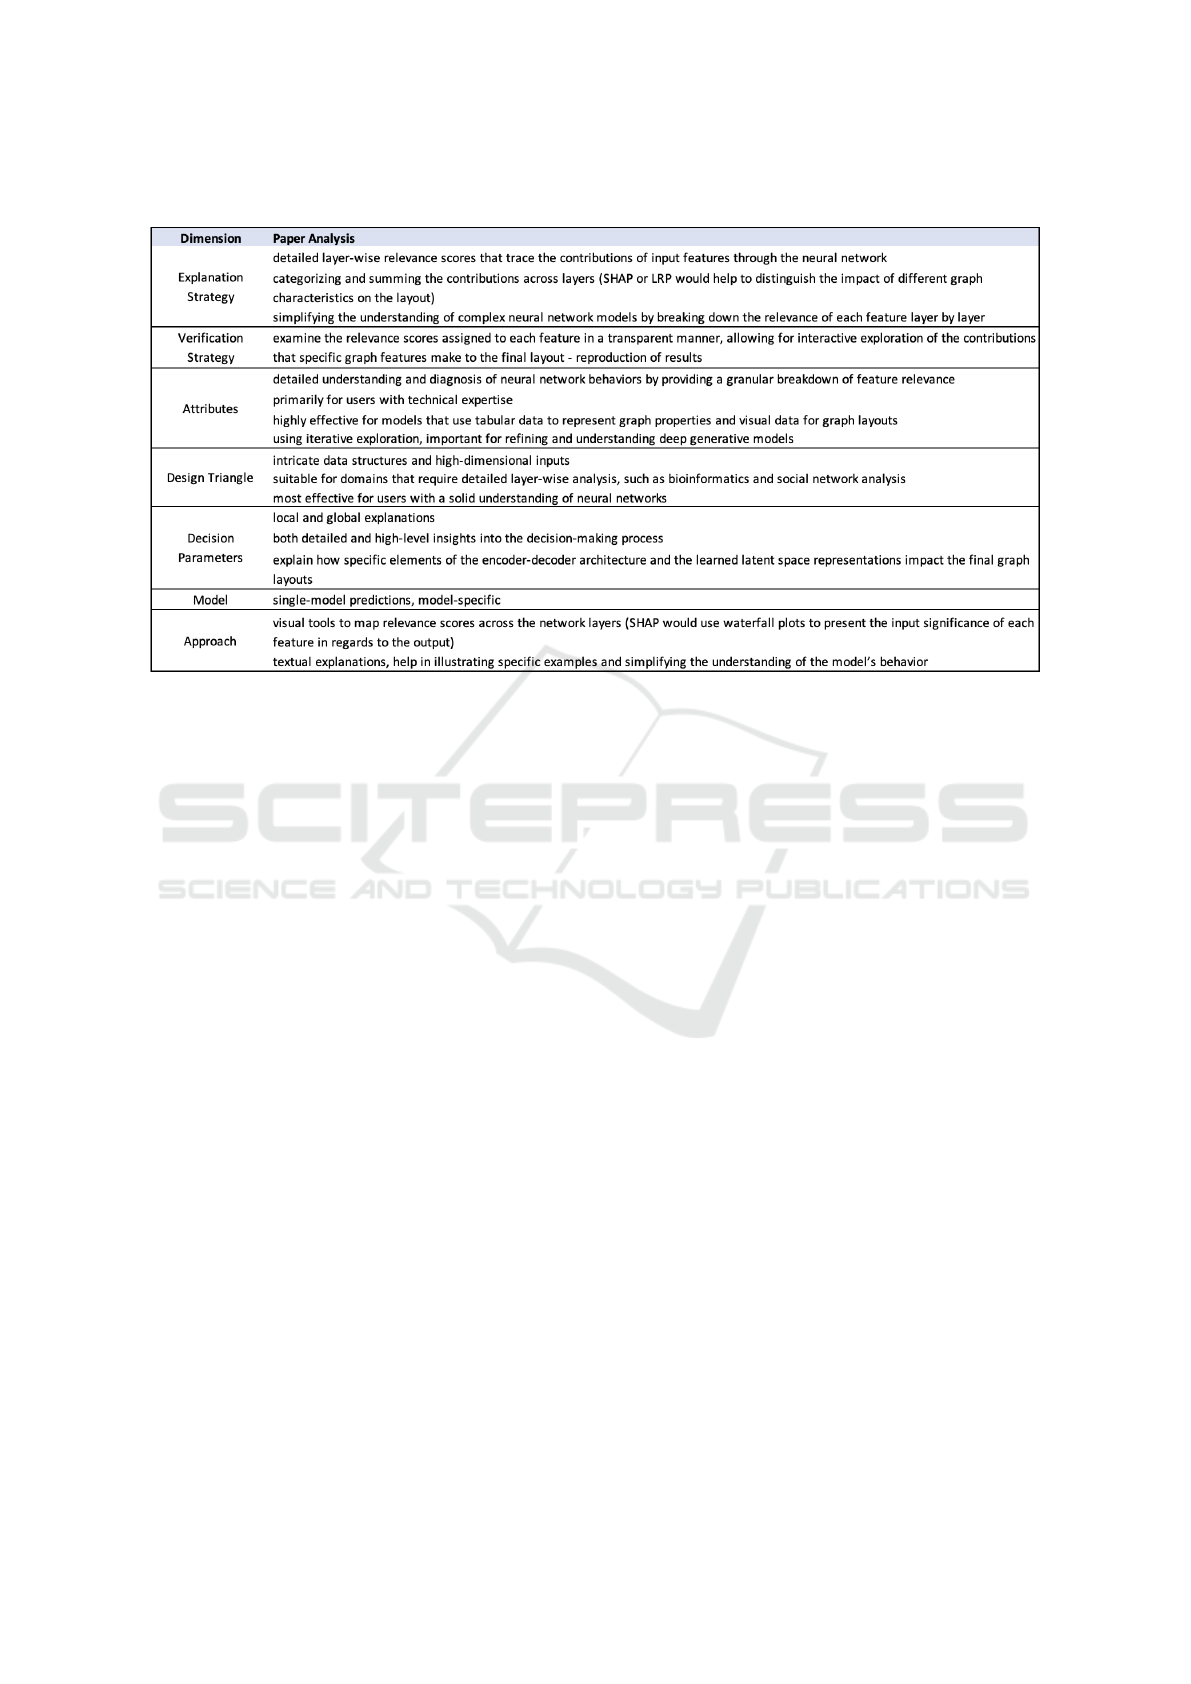
Table 1: Results of analyzing the paper based on the components specified in the framework.
task in hand, one would choose between SHAP and
LRP for experts of the field and LIME for text and
visual explanations for novice readers to explain the
described AI technique.
The paper by Kwon and Ma (Kwon et al., 2019)
provides a tool intended for users who are primarily
researchers or practitioners in GD and visualiza-
tion, with varying degrees of focus on interpretability.
Local explanation is required to explain the individ-
ual graph features and node placements, while global
explanation is necessary to understand the overall pro-
cess of layout generation. When determining the suit-
able XAI method, the focus is an expert audience fa-
miliar with GD. Therefore, SHAP appears to be an
effective XAI method for the GD model explored, due
to its ability to provide consistent, locally accurate ex-
planations, but also global explanations. As the tech-
nique described in the paper dynamically generates
graph structures, SHAP could break down the con-
tributions of each node or edge. This step-by-step
reasoning captures the complexity of the paper pro-
cesses, providing users with understandable explana-
tions. In our view, SHAP would provide a flexible and
intuitive framework for interpreting how the model
generates graph layouts.
As for LIME and LRP, our framework categorized
the former as more appropriate for a non-expert audi-
ence, which is not the case, and the latter best suited
for global explanations, rather than local. There-
fore, considering the nature of GD and the importance
of graph features, and that we were able to identify
ways on how SHAP could provide global explana-
tions, SHAP was concluded to be our XAI recommen-
dation for this technique.
5 CONCLUSION
In this paper, we introduce a preliminary framework
that identifies and organizes the relevant dimensions
of XAI applied to GD. These dimensions encompass
key features of XAI methods and the context in which
they are applied, providing a structured foundation for
understanding the interactions between AI and GD.
By analyzing these dimensions, the framework offers
insights into how existing XAI methods can support
the interpretation of AI-driven decisions in GD. We
apply our method on a deep learning GD technique,
and then matching our findings with three popular
XAI methods, specifically LIME, SHAP, and LRP.
The goal of this paper is to raise awareness about
the XGD challenge, providing a first interpretation
of a complex puzzle. Our proposed dimensions are
based on observations of the literature, which require
further validation and experimentation. There are sev-
eral questions left to answer: how expressive and
comprehensive is our framework?
The potential returns of this research include bet-
ter techniques to explain AI applications in GD, iden-
tifying unique requirements and challenges in each
domain. Avenues for future work include expanding
and detailing the presented framework to expand its
applicability beyond the drawing of simple graphs,
enabling to tackle dynamic and multi-faceted net-
Why Does It Look like this? Introducing a Preliminary Framework for Explainable Graph Drawing (XGD)
857

works. Also, we could develop concrete instances of
systems that use AI for graph drawing and provide
explanations. Evaluation of these can teach us what
the contribution of XGD could be in practice. Fur-
thermore, expanding the valuation on different tech-
niques could lead to the creation of design guidelines
for XAI method selection, ultimately contributing to
the broader goal of enhancing AI interpretability and
trustworthiness of AI for GD.
REFERENCES
Ahmed, R., De Luca, F., Devkota, S., Kobourov, S., and
Li, M. (2022). Multicriteria scalable graph drawing
via stochastic gradient descent, (sgd)
2
(sgd)2. IEEE
Transactions on Visualization and Computer Graph-
ics, 28(6):2388–2399.
Alicioglu, G. and Sun, B. (2022). A survey of visual an-
alytics for explainable artificial intelligence methods.
Computers & Graphics, 102:502–520.
Barredo Arrieta, A., D
´
ıaz-Rodr
´
ıguez, N., Del Ser, J., Ben-
netot, A., Tabik, S., Barbado, A., Garcia, S., Gil-
Lopez, S., Molina, D., Benjamins, R., Chatila, R.,
and Herrera, F. (2020). Explainable artificial intelli-
gence (xai): Concepts, taxonomies, opportunities and
challenges toward responsible ai. Information Fusion,
58:82–115.
Cao, J., Li, M., Chen, X., Wen, M., Tian, Y., Wu, B., and
Cheung, S.-C. (2022). Deepfd: automated fault diag-
nosis and localization for deep learning programs. In
Proceedings of the 44th International Conference on
Software Engineering, page 573–585. Association for
Computing Machinery.
Eades, P., Hong, S.-H., Nguyen, A., and Klein, K. (2017).
Shape-based quality metrics for large graph visualiza-
tion. Journal of Graph Algorithms and Applications,
21(1):29–53.
El-Assady, M., Jentner, W., Kehlbeck, R., Schlegel, U.,
Sevastjanova, R., Sperrle, F., Spinner, T., and Keim,
D. (2019). Towards explainable artificial intelligence:
Structuring the processes of explanations. In HCML
Workshop at CHI’19, Glasgow, UK.
Elzen, S. v. d., Andrienko, G., Andrienko, N., Fisher, B. D.,
Martins, R. M., Peltonen, J., Telea, A. C., and Ver-
leysen, M. (2023). The flow of trust: A visualization
framework to externalize, explore, and explain trust in
ml applications. IEEE Computer Graphics and Appli-
cations, 43(2):78–88.
Giovannangeli, L., Lalanne, F., Auber, D., Giot, R., and
Bourqui, R. (2021). Deep neural network for drawing
networks, (dnn)
2
. In Purchase, H. C. and Rutter, I.,
editors, Graph Drawing and Network Visualization,
pages 375–390, Cham.
Giovannangeli, L., Lalanne, F., Auber, D., Giot, R., and
Bourqui, R. (2024). Toward efficient deep learning for
graph drawing (dl4gd). IEEE Transactions on Visual-
ization and Computer Graphics, 30(2):1516–1532.
Gobbo, B., Elli, T., Hinrichs, U., and El-Assady, M. (2022).
xai-primer.com — a visual ideation space of interac-
tive explainers. In Extended Abstracts of the 2022 CHI
Conference on Human Factors in Computing Systems,
CHI EA ’22, New York, NY, USA. Association for
Computing Machinery.
Holter, S. and El-Assady, M. (2024). Deconstruct-
ing human-ai collaboration: Agency, interaction,
and adaptation. Computer Graphics Forum, 43(3).
Manuscript received; accepted. The final version
available at Eurographics.
Kwon, O.-H., Crnovrsanin, T., and Ma, K.-L. (2019). A
deep generative model for graph layout. In IEEE Pa-
cific Visualization Symposium (PacificVis), pages 96–
100, Bangkok, Thailand. IEEE.
Lundberg, S. M. and Lee, S. (2017). A unified approach
to interpreting model predictions. In Proceedings of
the 31st International Conference on Neural Informa-
tion Processing Systems (NIPS’17), pages 4768–4777,
Red Hook, NY, USA. Curran Associates Inc.
Miksch, S. and Aigner, W. (2014). A matter of time: Ap-
plying a data–users–tasks design triangle to visual an-
alytics of time-oriented data. Computers & Graphics,
38:286–290.
Ribeiro, M. T., Singh, S., and Guestrin, C. (2016). “why
should i trust you?” explaining the predictions of any
classifier. In Proceedings of the 22nd ACM SIGKDD
International Conference on Knowledge Discovery
and Data Mining, pages 1135–1144, San Francisco,
CA, USA. ACM.
Ribeiro, M. T., Singh, S., and Guestrin, C. (2018). Anchors:
High-precision model-agnostic explanations. In Pro-
ceedings of the Thirty-Second AAAI Conference on
Artificial Intelligence (AAAI-18). AAAI.
Simonyan, K., Vedaldi, A., and Zisserman, A. (2014).
Deep inside convolutional networks: Visualising im-
age classification models and saliency maps. arXiv
preprint arXiv:1312.6034.
Spinner, T., Schlegel, U., Sch
¨
afer, H., and El-Assady, M.
(2020). explainer: A visual analytics framework for
interactive and explainable machine learning. IEEE
Transactions on Visualization and Computer Graph-
ics, 26(1):1064–1074.
Tiezzi, M., Ciravegna, G., and Gori, M. (2024). Graph neu-
ral networks for graph drawing. IEEE Transactions on
Neural Networks and Learning Systems, 35(4):4668–
4681.
Wang, X., Yen, K., Hu, Y., and Shen, H.-W. (2023).
Smartgd: A gan-based graph drawing framework for
diverse aesthetic goals. IEEE Transactions on Visual-
ization and Computer Graphics, pages 1–12.
Wang, Y., Jin, Z., Wang, Q., Cui, W., Ma, T., and Qu, H.
(2020). Deepdrawing: A deep learning approach to
graph drawing. IEEE Transactions on Visualization
and Computer Graphics, 26(1):676–686.
Yan, K., Zhao, T., and Yang, M. (2022). Graphuly: Graph u-
nets-based multi-level graph layout. IEICE Transac-
tions on Information and Systems, E105.D(12):2135–
2138.
IVAPP 2025 - 16th International Conference on Information Visualization Theory and Applications
858
