
Evaluating Transformers Learning by Representing Self-Attention
Weights as a Graph
Rebecca Leygonie
a
, Sylvain Lobry
b
and Laurent Wendling
c
Laboratory LIPADE, Universit
´
e Paris Cit
´
e, 45 rue des Saints-P
`
eres, Paris, 75006, France
Keywords:
Explainability, Graph Visualization, Self-Attention, Health Data.
Abstract:
Transformers architectures have established themselves as the state of the art for sequential data processing,
with applications ranging from machine translation to the processing of Electronic Health Records (EHR).
These complex data present a particular challenge in terms of explainability, which is a crucial aspect for their
adoption in the healthcare field, subject to strict ethical and legal requirements. To address this challenge, we
propose an approach to represent learning through graphs by exposing the self-attention links between tokens.
We introduce a metric to assess the relevance of the connections learned by the model, in comparison with
medical expertise. We apply our approach to the Behrt model, designed to predict future hospital visits based
on sequences of previous visits, trained on data from the French National Health Data System. Our exper-
iments show that our method facilitates understanding of model learning, and enables a better appreciation
of the influence of diagnoses on each other, as well as of the biases present in the data, than global model
evaluation measures.
1 INTRODUCTION
Since their introduction (Vaswani et al., 2017), Trans-
formers architectures (Lin et al., 2022) have been
recognized as the state of the art for processing se-
quential data (Wen et al., 2023), primarily due to
their self-attention mechanism. This mechanism ef-
fectively captures the relationships between different
elements (tokens) of a sequence while minimizing the
vanishing gradient problem (Bengio et al., 1994) of-
ten encountered with recurrent architectures. Some of
the best-known models using this technology include
BERT (Bidirectional Encoder Representations from
Transformers) (Devlin et al., 2019), GPT (Generative
Pre-trained Transformer) (Radford et al., 2018), and
T5 (Raffel et al., 2020), which have revolutionized
the field of natural language processing.
Initially introduced for machine translation task
(Vaswani et al., 2017), Transformers are now com-
monly used to process all forms of sequential data,
including Electronic Health Records (EHR) (Nerella
et al., 2023). EHR contains a multitude of complex
data. This includes ICD (International Classification
a
https://orcid.org/0009-0007-1279-9832
b
https://orcid.org/0000-0003-4738-2416
c
https://orcid.org/0000-0003-1091-5995
of Diseases)
1
codes for diagnoses and medications, as
well as demographic information and treatment his-
tories, which are recorded at each patient visit. The
complexity of these data stems not only from their
volume and diversity, but also from their structuring
into temporal sequences, which capture cycles of di-
agnosis, treatment and patient follow-up, including
potential re-admissions.
Although the adaptation of natural language pro-
cessing methods for EHR data is very promising, the
lack of explainability raises legal and ethical issues
that constitute a significant obstacle on the deploy-
ment of these methods for decision support in the
healthcare field (Amann et al., 2020; Shortliffe et al.,
2018). It is currently possible to explain model learn-
ing by visualizing learned self-attention weights, but
this is done on a few examples, often to show what
the model has learned well, without comparison with
a ground truth (Siebra et al., 2024).
To address this problem, we propose an approach
for understanding and validating the learning of a
model based on self-attention mechanisms. This
framework consists in representing, in the form of
graphs, the links between input tokens, weighted by
the self-attention weights learned by the model. Each
1
The International Classification of Diseases is a med-
ical classification used worldwide for epidemiological,
health management and clinical purposes.
Leygonie, R., Lobry, S. and Wendling, L.
Evaluating Transformers Learning by Representing Self-Attention Weights as a Graph.
DOI: 10.5220/0013111400003912
Paper published under CC license (CC BY-NC-ND 4.0)
In Proceedings of the 20th International Joint Conference on Computer Vision, Imaging and Computer Graphics Theory and Applications (VISIGRAPP 2025) - Volume 1: GRAPP, HUCAPP
and IVAPP, pages 695-705
ISBN: 978-989-758-728-3; ISSN: 2184-4321
Proceedings Copyright © 2025 by SCITEPRESS – Science and Technology Publications, Lda.
695

Visit 1: O20 (Hemorrhage in early pregnancy)
Visit 2: J45 (Asthma)
Visit 3: O43 (Placenta anomalies)
Visit 4: O80 (Single spontaneous birth)
diagnostic
correlation
Figure 1: Overview of the proposed approach. Given a sequence of diagnostics input into a Transformer model, we extract
the self-attention weights learned by the model between each pair of tokens and represent them as a graph, where each node
is a diagnostic and each directed edge from node A to node B represents the self-attention weight node A gives to node B
during the model’s prediction. We evaluate this graph against a graph representing medical expertise to assess the relevance
of the self-attention weights learned by the model.
link in the graph thus represents the relative impor-
tance of each token in relation to the others, in a pre-
cise data sample. We then evaluate the graph against
a ground truth collected from experts to obtain a rele-
vance score for the self-attention links learned by the
model. Figure 1 illustrates the proposed approach.
To assess our methodology we apply this approach
to a specific model, Behrt (Li et al., 2020), which has
been trained on data from the French National Health
Data System (SNDS). This model aims at predicting
the next hospital visit of a patient given a sequence of
previous visits. We apply our approach on two differ-
ent use cases, illustrating the versatility and effective-
ness of our method. The results show that our method
can be used to understand and validate model learn-
ing. In addition, the use of graphical representations
helps users to understand more directly the connec-
tions that the model has learned, which is crucial for
increasing the confidence of healthcare professionals
in using the model’s predictions in concrete clinical
situations. In this work, we introduce four contribu-
tions:
• Contribution 1. We propose a method that graph-
ically represents the interactions between tokens
learned by the model.
• Contribution 2. We propose an approach for
modeling medical expertise as a graph.
• Contribution 3. We introduce a new metric to
evaluate the relevance of the connections learned
by the model by comparing them to medical ex-
pertise.
• Contribution 4. We validate our method through
two use cases.
The paper is structured as follows. In Section 2, we
review existing works on adapting Transformers to
electronic health record (EHR) data, as well as the
explainability methods used to validate these models.
Section 3 details our proposed methodology. Experi-
mental protocols are explained in Section 4, while the
results obtained are presented in Section 5 and dis-
cussed in Section 6.
2 RELATED WORK
2.1 Transformers for Health Data
For several years, researchers have propose to exploit
data from the International Classification of Diseases
IVAPP 2025 - 16th International Conference on Information Visualization Theory and Applications
696

(ICD), notably for the task of predicting future diag-
noses (Nerella et al., 2023). Behrt (Li et al., 2020),
an adaptation of BERT for EHR data, is pre-trained
using a masked language model before being trained
on sequences of ICD codes and age data to predict
future diagnoses. Hi-BEHRT (Li et al., 2022), an ex-
tension of Behrt, uses a hierarchical structure to pro-
cess long sequences of medical data more efficiently.
Furthermore, Med-BERT (Rasmy et al., 2021) mod-
ifies the pre-training task to include the prediction
of length of stay and uses a combination of ICD-9
and ICD-10 codes to predict diabetes and heart fail-
ure. ICD-9 and ICD-10 are two different versions
of disease classification. Proposed in 1979, ICD-9
comprises 14, 000 codes covering diagnoses and pro-
cedures. The codes are mainly numerical and fairly
general. Adopted in 1990 and implemented in many
countries in the early 2000s, ICD-10 is much more
detailed, with around 70, 000 diagnostic codes. It pro-
vides a much more precise description of diseases and
their symptoms. HiTANet (Hierarchical Time-aware
Attention Network) (Luo et al., 2020) incorporates a
temporal vector to represent the time elapsed between
consecutive visits, combined with the embedding of
the original visit to predict future diagnoses on three
disease-specific databases. Finally, RAPT (Represen-
tAtion by Pre-training time-aware Transformer) (Ren
et al., 2021) integrates an explicit duration vector with
additional pre-training tasks such as similarity predic-
tion and reasonableness checking to address issues
of insufficient data, incompleteness, and the typical
short sequences of EHR data. RAPT is evaluated
for predicting pregnancy outcomes, risk periods, as
well as diagnoses of diabetes and hypertension dur-
ing pregnancy.
2.2 Validation of Self-Attention Links
Among the studies that use Transformer-type archi-
tectures on electronic health record (EHR) data, those
that evaluate model performance by validating the
self-attention links learned by the model fall into two
groups. The first category includes works that assess
the relevance of self-attention weights through a few
selected examples. Among these works, the authors
of LSAN (Ye et al., 2020), using a hierarchical at-
tention module, randomly select samples to analyze
which symptoms receive the most attention during
each visit for risk prediction. Others, such as the au-
thors of Behrt (Li et al., 2020), Med-BERT (Rasmy
et al., 2021) and (Meng et al., 2021), use the bertviz
(Vig, 2019) tool to visualize interactions between di-
agnoses with significant self-attention weights. This
tool allows to visualize self-attention links between
pairs of elements in a sentence, by choosing from the
attention heads and layers of the model.
The second category includes work that modi-
fies the representation of input data, making self-
attention weights more interpretable. For example,
(Dong et al., 2021) represent data as graphs linking
domain concepts. This modification of the data rep-
resentation improves the explainability of the atten-
tion mechanism, as it relies on the attention weights
assigned to each graph instance and not just on the
direct relationships between inputs and outputs. Sim-
ilarly, (Peng et al., 2021) introduce ontologies as input
data, demonstrating that it is possible to obtain more
interpretable medical codes links.
Theses works aims to interpret and validate model
learning through self-attention, but experiments in the
EHR field are often limited to validating performance
through manually evaluated visual examples. In this
work, we propose a method that evaluates the learn-
ing of self-attention links by representing them as a
graph and comparing them to a ground truth also rep-
resented as a graph. To represent self-attention links
as a graph, we first extract these weights (Section 3.1)
during inference of a Behrt (Li et al., 2020) model,
by choosing a specific layer. These weights show the
attention that each token gives to every other token in
the same sequence. In parallel with this collection of
data for all sequences, we identify the most influen-
tial tokens for prediction, by analyzing their gradient
(Section 3.2). We then use these information to con-
struct a directed graph (Section 3.3). In this graph, the
tokens of importance are the source nodes, and they
are connected to the other tokens to which they are
linked in the sequences. We also add self-attention
links between tokens that are linked to those identi-
fied as important, illustrating the interactions and self-
attention weights between the different tokens playing
a primary or secondary role in the prediction made by
the model. Finally, we evaluate the graph by measur-
ing the weight of directed edges common to those of
a graph representing ground truth (Section 3.4).
3 METHODOLOGY
Figure 2 illustrates the different steps of our method-
ology.
3.1 Creation of the Global Attention
Matrix
Let T = {t
1
, t
2
, . . . , t
V
} be a set (or vocabulary) of V
distinct tokens. We consider a labeled dataset X =
(X
i
, y
i
)
i∈J1;NK
consisting of N sequences X
i
and their
Evaluating Transformers Learning by Representing Self-Attention Weights as a Graph
697
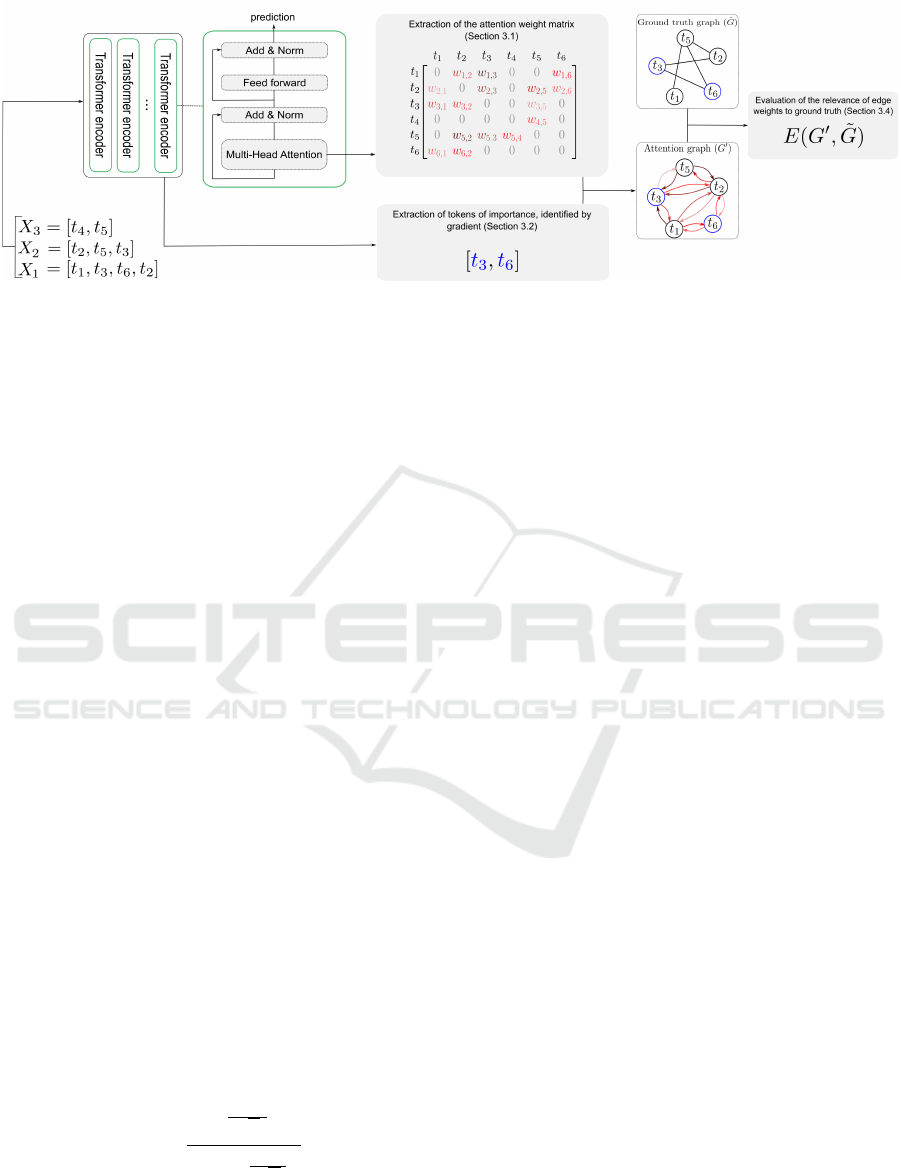
Figure 2: Stages of the proposed methodology: from the sequences given as input to a Transformer, we identify tokens of
importance by gradient analysis. A global attention matrix is constructed in which each token assigns a weight (denoted
w) to all other tokens in a global vocabulary, provided that both tokens coexist in the same sequence. Then, we extract a
self-attention subgraph G
′
by starting with the important tokens (blue nodes) and adding all the tokens (black nodes) to which
they are linked in the global attention matrix. A directed edge linking two nodes in G
′
is weighted by the self-attention weight
that the source node assigns to the target node. We evaluate the relevance of the self-attention weights learned by the model
using the evaluation function E, which compares the attention graph G
′
with the graph representing ground truth, denoted
˜
G.
associated ground truth y
i
. Specifically, each X
i
is
a sequence of tokens (x
1
, . . . , x
z
i
), where z
i
∈ N and
∀j ∈ J1, z
i
K, x
j
∈ T . We feed each sequence X
i
into a
Transformer trained to predict ˆy
i
. If the model’s pre-
diction ˆy
i
matches the true label y
i
, we retrieve the at-
tention matrix A
i
of size z
i
×z
i
during the processing
of X
i
through the model:
A
i
=
a
1,1
a
1,2
··· a
1,z
i
a
2,1
a
2,2
··· a
2,z
i
.
.
.
.
.
.
.
.
.
.
.
.
a
z
i
,1
a
z
i
,2
··· a
z
i
,z
i
(1)
where each element a
m,n
represents the self-attention
that the token x
m
in the sequence X
i
gives to the to-
ken x
n
in the same sequence. Specifically, in a Trans-
former layer, the self-attention a
m,n
is calculated by
projecting x
m
into a query vector Q
m
= W
Q
x
m
and x
n
into a key vector K
n
=W
K
x
n
, where, W
K
and W
Q
rep-
resent the learned weight matrices. These query and
key vectors are used to compute a raw self-attention
score via a dot product, which is then divided by the
dimension of the key vectors (the size of the embed-
dings used to represent each token in the key space).
Finally, this normalized score is passed through a soft-
max function that converts it into probabilities, result-
ing in :
a
m,n
=
e
Q
m
·K
n
√
d
k
∑
z
i
l=1
e
Q
m
·K
l
√
d
k
(2)
where z
i
is the total number of tokens in the sequence
X
i
. Note that the self-attention a
m,n
in the matrix is
calculated as the mean of the attention that token x
m
gives to token x
n
in all the attention heads of the se-
lected layer.
Once we’ve retrieved the self-attention weights
for each peer in each sequence, we aggregate these
weights into a global attention matrix G of size (V ×
V ) where V is the size of the token vocabulary T . Fi-
nally, the matrix G is nothing other than an adjacency
matrix representing the self-attention links between
all tokens. This matrix lists the values of the self-
attention weights of all possible pair links among all
tokens in the global vocabulary. Specifically, G syn-
thesize the attention that each token t
m
gives to each
other token t
n
across all analyzed sequences. For each
pair of tokens (t
m
, t
n
), we identify all occurrences of
these tokens in different sequences and accumulate
the corresponding self-attention values for these to-
kens from the A
i
matrices associated with each se-
quence. We collect these values into a set S
mn
:
S
mn
= {a
m
′
,n
′
| x
m
′
= t
m
, x
n
′
= t
n
,
m, n ∈ {1, . . . , V }, m
′
, n
′
∈ {1. . . , z
i
}}
(3)
Each element G[m, n] of the matrix is then calcu-
lated by taking the median of these values from the
set S
mn
:
G[m, n] = Median(S
mn
) (4)
Note that we choose to take the median value to
avoid potential outliers. Finally, G[m, n] captures the
level of attention that each token t
m
gives to every
other token t
n
across all sequences, reflecting the cen-
tral tendency of the intensity of interaction between
any pair of tokens in the dataset.
IVAPP 2025 - 16th International Conference on Information Visualization Theory and Applications
698

3.2 Identification of Important Tokens
For each sequence X
i
where the model correctly pre-
dicts the label ˆy
i
, we recover the gradient ∆(x
j
) of
each token x
j
in X
i
by performing a backpropagation
pass. The gradients allow us to measure the influence
of each token on the prediction. Knowing that the
model makes a good prediction, gradients with higher
values indicate a more significant contribution to the
model’s decision (Simonyan et al., 2014). For each
token in the vocabulary T that appears in at least one
correctly predicted sequence, we calculate the median
importance of the gradients associated with that to-
ken.
Finally, we select a predefined number g of
the most important tokens according to these me-
dian gradient measures, thus identifying those tokens
that most consistently and significantly influence the
model’s correct predictions.
3.3 Self-Attention Graph Generation
We aim to construct a self-attention graph G
′
that rep-
resents the interactions between tokens as learned by
the model. In other words, we extract a subgraph from
the global attention matrix by selecting the relation-
ships between a chosen set of tokens (nodes). In this
section, we explain how we select the nodes of the
graph.
To create an interpretable and comparable graph,
we use the g tokens with the most significant gradients
as the initial nodes of G
′
. Then, we expand this ini-
tial set by adding any token t
n
from the global vocab-
ulary T , for which the self-attention G[m, n] is non-
zero, where the token t
m
or t
n
belongs to the initial
set of g tokens of importance. Thus, the set of nodes
in G
′
includes the initial g tokens and all the tokens
directly linked to them, with their associated median
self-attention weights. We construct a directed graph
where each pair (t
m
, t
n
) among the nodes of G
′
is con-
nected by a directed edge from t
m
to t
n
if G[m, n] is
non-zero. The directed edges are weighted by the cor-
responding values of G, which quantify the intensity
of self-attention t
m
gives to t
n
.
3.4 Evaluation of the Self-Attention
Learned by a Model
We want to evaluate in an automated way the qual-
ity of the self-attention connections between tokens
learned by an attention-based model. To do this, we
compare these connections to a reference, represented
by a graph
˜
G. For our experiments we have imple-
mented a protocol for the creation of the reference
graph by medical experts, detailed in Section 4.4.
This ground-truth graph,
˜
G, contains the same nodes
as the graph G
′
because we want to evaluate the inter-
actions (directed edges) and not the tokens (nodes),
which depend essentially on the sequences used. We
wish to evaluate whether the model has learned a good
distribution of self-attention weights compared to es-
tablished expertise. For this, we introduce an eval-
uation method that takes into account the weight of
edges, which is not the case for classical evaluation
measures such as precision or recall. Evaluation is
performed by calculating the difference between the
weighted proportion of G
′
directed edges common to
˜
G and the weighted proportion of G
′
directed edges
not common to
˜
G. The evaluation function, which we
call E, is calculated as follows:
E(G
′
,
˜
G) = w
in
−w
out
(5)
where:
• w
in
=
∑
(m,n)∈G
′
∩
˜
G
w
mn
∑
(m,n)∈G
′
w
mn
, is the weighted proportion
of directed edges in the graph G
′
that are also
present in the ground truth
˜
G, i.e. the number of
G
′
directed edges included in
˜
G weighted by their
weight and normalized by the weighted number
of directed edges in G
′
.
• w
out
=
∑
(m,n)∈G
′
,(m,n)̸∈
˜
G
w
mn
∑
(m,n)∈G
′
w
mn
, is the weighted propor-
tion of directed edges in G
′
that are not confirmed
by
˜
G.
The evaluation function E measures the alignment be-
tween the graph G
′
and the ground truth
˜
G. It ranges
from -1 to 1, where a score of 1 is reached when all
directed edges of G
′
are included in
˜
G, and -1 when
no directed edges are included. Scores between 0 and
1 indicate that directed edges included in
˜
G are more
heavily weighted than those not included, reflecting
a predominance of matches. Conversely, scores be-
tween -1 and 0 indicate that directed edges not in-
cluded in
˜
G are more heavily weighted, reflecting a
predominance of mismatches.
4 EXPERIMENTS
We evaluate our method using an attention-based
model, trained by the Lab Sant
´
e of the Direction de
la recherche, des
´
etudes, de l’
´
evaluation et des statis-
tiques (Drees
2
). To test the validity of the graphs
generated from self-attention weights and links, we
set up a protocol for creating ground truth graphs in
collaboration with the medical experts in the depart-
ment.
2
https://drees.solidarites-sante.gouv.fr
Evaluating Transformers Learning by Representing Self-Attention Weights as a Graph
699

4.1 Model
We wish to study the learning of a model based on at-
tention mechanisms, specifically adapted to the anal-
ysis of medical data. For our experiments, we use the
model Behrt, a variant of BERT, trained on the task
of predicting patient diagnoses during future hospital
visit, based on a historical sequence of visits.
4.1.1 Data
The data on which the model was trained comes
from the MCO (M
´
edecine, Chirurgie, Obst
´
etrique) ta-
bles of the PMSI (Programme de M
´
edicalisation des
Syst
`
emes d’Information) of the SNDS. Each hospi-
tal visit is characterized by a set of diagnoses, in-
cluding a principal diagnosis and, where applicable,
a related diagnosis, as well as several associated diag-
noses, which enrich the context of the principal diag-
nosis.
4.1.2 Training Task
The model is trained on a multi-class and multi-label
classification task. This means that the label to be
predicted can contain several different classes. The
classes are represented by 2053 diagnoses coded ac-
cording to the 10th revision of ICD, which is the list
of codes that classify diseases and medical problems.
The model training process is divided into two dis-
tinct phases to refine the predictive capabilities of the
model, specializing it to meet the specific require-
ments of the medical field:
1. Prediction of masked words, where the model
learns to identify and restore hidden elements in
the training data.
2. Fine-tuning of the pre-trained model to specif-
ically adapt it to the task of predicting diagnoses
for upcoming hospital visits.
The training of the model for masked word predic-
tion was conducted on individuals having more than 2
hospital visits and at least 3 diagnostic codes, drawn
from two samples. A random sample of 4% of the
SNDS data covering the period from 2008 to 2017,
and a sample considering all SNDS data from 2018
to 2021. The dataset for the masked word prediction
contains 14, 59M samples. The training of the model
for predicting diagnoses of the next hospital visit is
carried out on individuals having at least 4 visits in
their medical history, using the same datasets as the
first phase. The dataset for the fine-tuning, i.e the pre-
diction of the next hospital visit contains 5, 94M sam-
ples. In both datasets, the minimum numbers of visits
and codes in the sequence are imposed to ensure that
the training sample contains sufficiently diverse med-
ical paths and thus avoid overfitting.
4.2 Use Cases
We apply our method during the model inference
phase, retrieving the medical histories of individuals
for whom the model has correctly predicted the next
visit, i.e. the diagnosis to be predicted is in the top 2
of predictions. We ensure that the other diagnosis in
the top 2 is contextually related to the predicted diag-
nosis, reinforcing the relevance of our interpretation
of importance gradients. We are working on two dis-
tinct use cases, based on different samples of test data.
These use cases concern the prediction of incident di-
agnoses, meaning that the diagnosis to be predicted
does not appear in the input sequence. This approach
makes it possible to precisely analyze the influence of
previous diagnoses on predictions.
4.2.1 Use Case of Childbirth
The class childbirth includes the following ICD10
codes: (O80) single spontaneous delivery; (O81) sin-
gle delivery by forceps and suction cup; (O82) single
delivery by caesarean section; (O83) other assisted
single deliveries; and (O84) multiple deliveries. We
select 2000 individuals for whom the visit to be pre-
dicted contains a label of the childbirth class, which
is not in the sequence we give as model input. On the
sample used, the model makes a good prediction for
190 individuals.
4.2.2 Use Case of Hypertensivity
The hypertensivity is defined by the following ICD10
codes: (I10) essential hypertension; (I11) hyperten-
sive heart disease; (I12) hypertensive nephropathy;
(I13) hypertensive cardionephropathy; and(I15) sec-
ondary hypertension. As in the case of childbirth, we
randomly select 2000 individuals for whom the visit
to be predicted contains the diagnosis I10 and none
of the hypertensivity class labels is in the sequence
corresponding to the medical history. On the sample
used, the model makes a good prediction for 514 in-
dividuals.
4.3 Generation of Graph G
′
from Behrt
in Inference
For each use case, the creation of the graph begins by
retrieving the attention matrices for each individual,
taken from the last layer of the Behrt model. Next,
we build a global median attention matrix of dimen-
sions 2053 ×2053, where 2053 represents the number
IVAPP 2025 - 16th International Conference on Information Visualization Theory and Applications
700

of possible diagnoses. We also extract the gradient for
each diagnosis from the sequence representing an in-
dividual’s medical history, which we give as input to
the model. This enables us to identify, for each indi-
vidual, which diagnoses most influenced the predic-
tion. We then calculate the median of the gradients
per diagnosis.
For both use cases and to preserve confidentiality,
we limit ourselves to the study of diagnoses or pairs of
diagnoses present in at least five distinct medical path-
ways. This method allows us to maintain anonymity
while preserving analytical relevance. Consequently,
some diagnoses selected from the g diagnoses of im-
portance may not appear in our graph if their connec-
tions with other diagnoses do not appear in the re-
quired minimum of five distinct medical pathways.
Similarly, a connection between two diagnoses will
not be visible in the graph if the pair of diagnoses does
not appear in at least five distinct sequences. Thus, for
both use cases, the number of significant diagnoses
identified by the median gradient value is arbitrarily
chosen so that the generated graph contains enough
directed edges.
4.3.1 Use Case of Childbirth
We select the 10 most influential diagnoses accord-
ing to the median value of their gradient (represented
by blue-bordered nodes in Figure 3a). From these
diagnoses, we extract the self-attention subgraph G
′
that links important nodes to other associated nodes
in the global attention matrix, as well as links be-
tween added nodes (nodes that are not part of the set
of importance diagnoses). Figure 3a illustrates the
overall graph showing the self-attention relationships
between the importance diagnoses, the diagnoses to
which they are connected in the global attention ma-
trix, and the links between these diagnoses. More pre-
cisely, an directed edge from node A to node B in the
same graph is weighted by the median self-attention
that A gives to B. The weight is represented by the
color of the directed edge.
4.3.2 Use Case of Hypertensivity
We identify the 46 most significant diagnoses accord-
ing to the value of their gradients. As with the child-
birth use case, these diagnoses are then connected to
the other tokens associated with them in the global at-
tention matrix, and the directed edges of the graph are
weighted according to the self-attention weight. The
graph for this use case is shown in figure 3b.
3
https://icd.who.int/browse10/2019/en
4.4 Creation of the Ground Truth
Graph
˜
G
To interpret the links between diagnoses learned by
the Behrt model through the mechanics of attention,
we want to compare them with a ground truth, which
translates into medical expertise. Self-attention, al-
though significant in our model, has no direct and ob-
vious correspondence in the medical context. In order
to validate or invalidate these links, we have designed
a protocol aimed at healthcare professionals, involv-
ing the creation of a graph of relationships between
diagnoses. This graph is designed to be undirected
and unweighted.
The protocol is based on two lists of diagnoses:
the first, called ”gradients”, contains the diagnoses
we have identified as important for prediction. The
second, called ”other”, includes diagnoses that are
related to the ”gradient” diagnoses according to the
global attention matrix. To produce a graph that faith-
fully reflects the clinical reality of the two use cases
presented, we called on the expertise of two Drees
medical experts to form clusters. We specifically
asked them to link each diagnosis from the ”other”
list to one or more diagnoses from the ”gradient” list,
taking into account the existence of a contextual cor-
relation between them. This correlation may concern
elements such as comorbidity, causality, impact on
treatment, clinical implication, or coding frequency.
4.5 Evaluation of G
′
Relative to
˜
G
We evaluate the self-attention weights of the graph
G
′
in relation to the ground truth
˜
G by calculating
E(G
′
,
˜
G). Because G
′
is directed, and
˜
G is not, we
consider the edges of
˜
G to be bidirectional edges. The
aim is to analyze G
′
according to different thresh-
olds that determine which directed edges are taken
into account. More specifically, we aim to determine
whether there is a threshold where the directed edges
of G
′
in common with
˜
G are correctly identified by
the model as being significant, i.e. the weight of these
directed edges is greater than that of directed edges
not included. For each threshold established, we con-
sider only those directed edges of G
′
whose weight
exceeds that threshold. We then remove the isolated
nodes from G
′
and keep the same nodes in
˜
G. The
results of this evaluation, depending on the thresholds
chosen, are presented in Section 5.
Evaluating Transformers Learning by Representing Self-Attention Weights as a Graph
701
(a) (b)
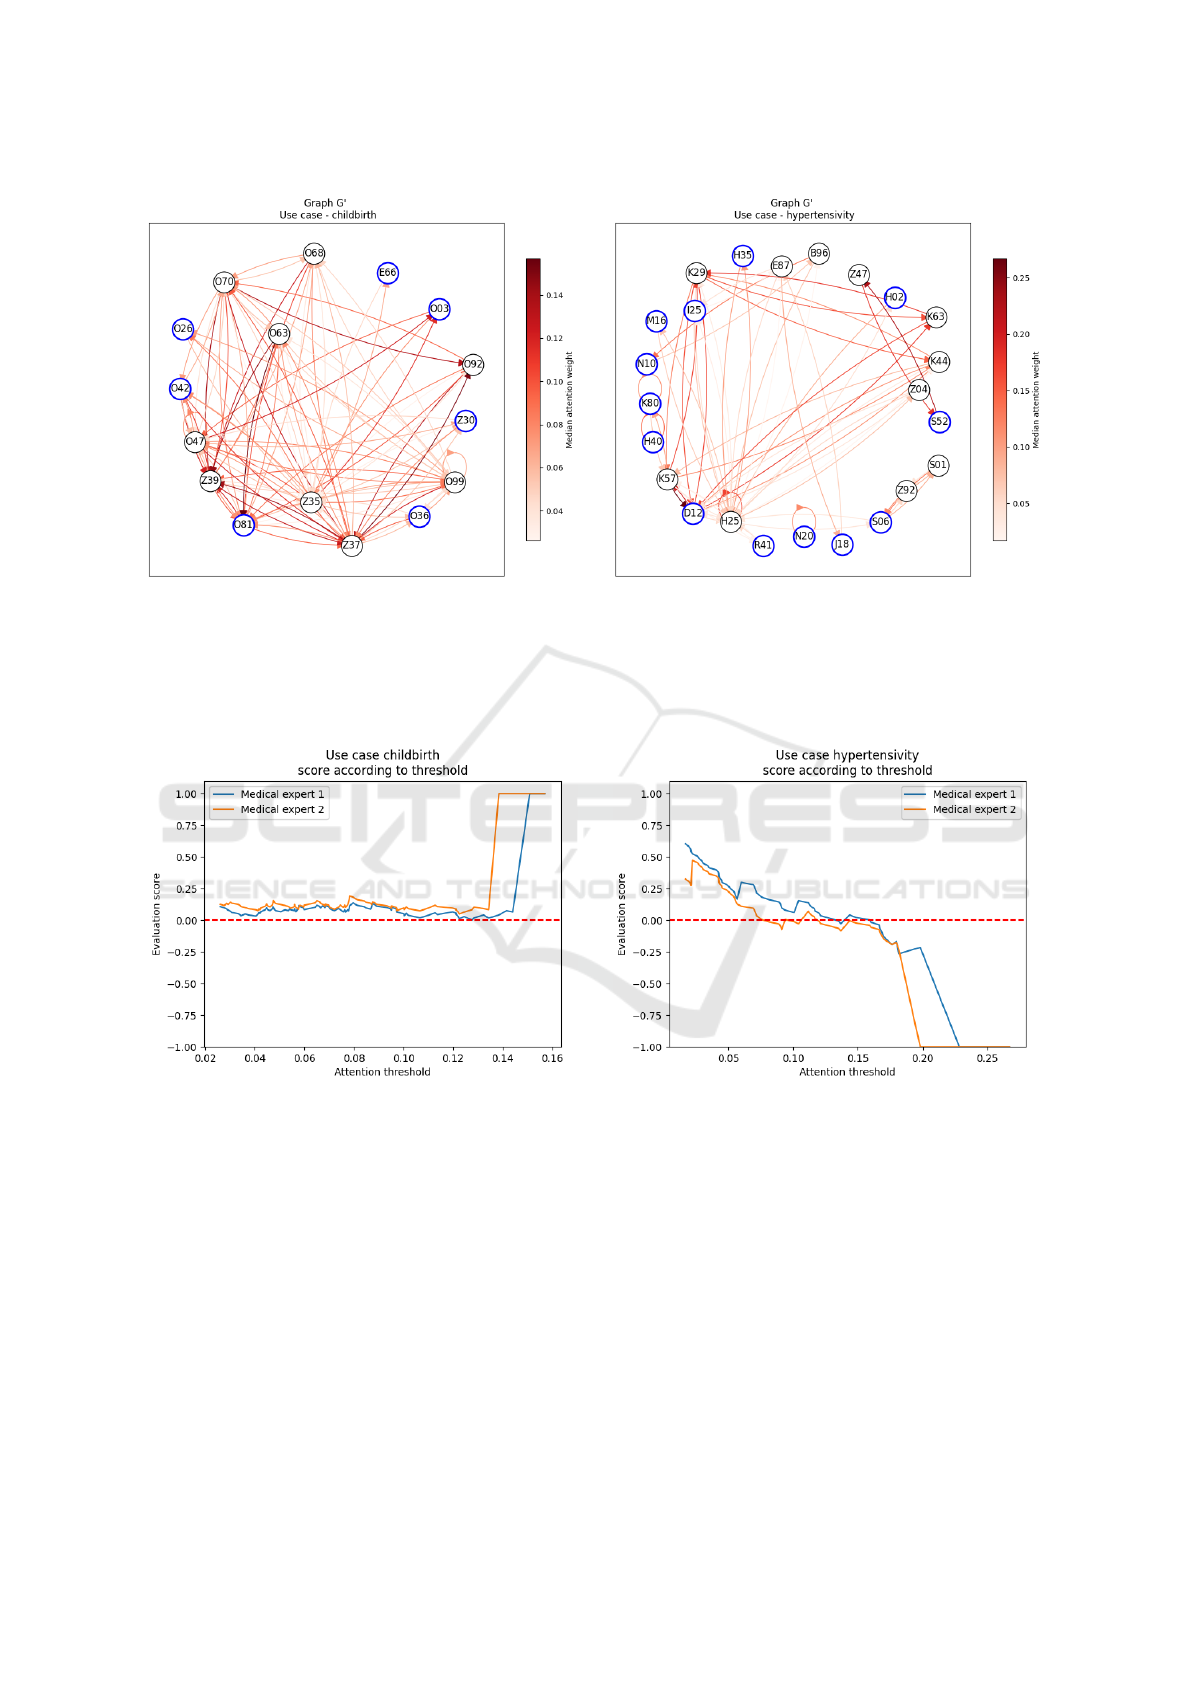
Figure 3: Graphs obtained from our approach applied to the Behrt model in inference. The visualizations were generated
using the NetworkX python package. (a) use case of childbirth, (b) use case of hypertensivity. Nodes with a blue border
are diagnoses identified by the gradient as being important for prediction. Nodes with a black border are the diagnoses to
which the importance nodes are linked in the global attention matrix. An directed edge from node A to node B has a color
corresponding to the median weight of self-attention that A gives to B. Descriptions of ICD10-coded diagnoses in the nodes
are referenced online
3
.
(a) (b)
Figure 4: Curves illustrating the evolution of the evaluation score as a function of the self-attention threshold used to select
directed edges in the G
′
graph. (a) corresponds to use case of childbirth, and (b) to use case of hypertensivity. In both figures,
the blue curve represents the evaluation of the graph in relation to the medical expertise of the first doctor, while the orange
curve reflects the evaluation in relation to the second doctor. A red dotted line located for score=0 is included to facilitate
visualization of evaluation scores that become negative.
5 RESULTS
We are testing our evaluation method on two use
cases: the prediction of a diagnosis signaling child-
birth, and a case revealing a diagnosis of essential hy-
pertension. To do this, we evaluate the graph gen-
erated from the information extracted during infer-
ence phase of the Behrt model, by comparing it with
ground truths obtained via the protocol described in
Section 4.4 and involving two medical experts. This
evaluation consists in computing the difference be-
tween the weighted proportion of directed edges com-
mon to the ground truths and those not included, i.e.
those not validated by the ground truths. We adjust
the threshold above which directed edges are con-
sidered in the graph G
′
to determine whether, above
IVAPP 2025 - 16th International Conference on Information Visualization Theory and Applications
702

a certain threshold, directed edges included in the
ground truths have a more significant weight than
those excluded. This allows us to determine whether a
specific threshold produces a graph that most closely
approximates the ground truth.
The curves evaluating the score of G
′
in relation
to ground truths are shown for each use case in Fig-
ure 4. For the case of childbirth (see Figure 4a), we
observe that above a threshold of 0.13 or 0.15, de-
pending on the ground truth, the score reaches 1. This
indicates that all the directed edges of G
′
are included
in
˜
G, confirming the existence of a threshold beyond
which the directed edges correspond precisely to the
ground truth and demonstrating that the model cor-
rectly assigns high self-attention weights to the rele-
vant directed edges. Before this threshold, the score
remains positive but does not exceed 0.25, suggesting
that, although some directed edges are not included in
the ground truth, their influence is relatively minor.
On the other hand, in the case of hypertensivity
(see Figure 4b), the curves show a constant decay,
meaning that the higher the directed edge selection
threshold, the fewer directed edges are in common
with the ground truth, or their weight is less than those
excluded. These results indicate that, in this use case,
the model fails to pay sufficient attention to diagnosis
pairs validated by the expert.
6 DISCUSSION
We develop a method for automatically evaluating the
links between tokens learned by an attention-based
model, using the Behrt architecture, trained by the
Lab Sant
´
e (Drees) on SNDS data. We analyze the
learning of the model on a task that can be evaluated
by an expert: the prediction of a diagnosis. More
precisely, the model we use is trained to predict the
next hospital visit from a sequence of previous visits,
which does not contain the diagnosis to be predicted,
which we call an incident diagnosis. We graphically
represent the model’s learning by linking diagnoses
identified as important by their gradient to the diag-
noses to which they are linked via the self-attention
learned by the model. The representation we pro-
pose makes it easier for medical experts to understand
how the Behrt model is learned. It enables the anal-
ysis of self-attention links between tokens, which can
be compared to correlations between diagnoses in the
medical field.
Our approach enables a more granular assess-
ment of model learning than would be possible with
global measures such as precision or recall. Indeed,
the framework we propose facilitates visualization
and evaluation of the diagnostic links learned by the
model, and enables learning to be adjusted according
to these observations. Although the model does not
achieve a high recall rate - correctly diagnosing 190
out of 2000 individuals in the case of childbirth and
514 out of 2000 in the case of hypertensivity - our ap-
proach is applied to determine whether these results
are the result of overfitting. Analyses reveal that the
model establishes more relevant diagnostic links for
childbirth than for hypertensivity, which is surprising
given the better recall rate observed for hypertensiv-
ity. This anomaly is interpreted as being due to the
complexity of the hypertensivity case, which presents
a wide variety of diagnostic pathways that can lead
to correct predictions. These results demonstrate the
added value of our approach, whose analysis creates
a direct link between the training data used and the
performance obtained, enabling potential adjustment
of the sample used.
In our experiments, we developed a protocol for
creating a ground truth graph, which allows us to eval-
uate the graph of self-attention links learned by the
model. The curves shown in Figure 4 indicate that the
evaluation score of the model graph, relative to the
ground truth graph, follows the same trend, indepen-
dently of the medical expertise being compared. This
finding suggests that our proposed protocol succeeds
in establishing a ground truth that reflects shared med-
ical knowledge, thus reinforcing the validity of the
established ground truth as representative of general
medical expertise. The protocol for establishing the
ground truth does not take into account the weight-
ing of edges, as there is no direct and obvious cor-
respondence with self-attention in the medical con-
text. In the future, we would like to develop a method
to weight the edges established by medical expertise,
in order to more accurately evaluate the self-attention
weighting adopted by the model.
Finally, the proposed method offers an accurate
assessment of model learning based on attention
mechanisms, which is fundamental in the medical
field. Indeed, understanding how the model learns is
crucial to being able to use its predictions to make in-
formed decisions.
7 CONCLUSION
Our method aims to validate the learning of models
based on self-attention mechanisms by representing
the learned links as graphs and evaluating their rele-
vance to a graph that represents the ground truth. This
approach enabled us to gain a better understanding of
how a BERT-type model works, specifically trained to
Evaluating Transformers Learning by Representing Self-Attention Weights as a Graph
703

predict the diagnosis of the next hospital visit based
on a series of previous visits. Our experiments on
two distinct use cases revealed that the case where the
model showed better initial performance established
less relevant diagnostic links than in the case where
the model appeared a priori to perform less, underlin-
ing the importance of a detailed analysis of learned
relationships.
We have also developed a method for creating a
ground truth from a simple-to-implement protocol.
Although we have considered ground truths defined
individually by different medical experts, a future ap-
proach could be to unify these various truths into a
single one. Furthermore, the protocol for establish-
ing the reference graph does not take into account the
weighting of edges, as there is no direct correspon-
dence with self-attention in the medical context. In
the future, we would like to develop a method for
weighting the edges established by medical expertise,
thus enabling a more accurate assessment of the self-
attention distribution assigned by the model.
To extract a subgraph from the global attention
matrix, which we call the self-attention graph, we
start with g tokens considered important for predic-
tion based on their associated gradients. The num-
ber g is chosen to have a graph with enough edges to
evaluate. Subsequently, we would like to extract the
graph using a less arbitrary initialization, for example
by extracting weakly connected components based on
a self-attention threshold in the global attention ma-
trix. This would also allow us to evaluate the different
components derived from the global attention matrix
against those from a richer reference graph.
To generate the graph, we used the self-attention
weights of the last layer of the model. However, we
plan to explore the weights of other layers in the fu-
ture and design a method for integrating the atten-
tion of all layers, in order to better evaluate learning.
Furthermore, the self-attention weight between two
tokens is calculated by averaging the self-attention
weights from all attention heads in the last layer. In
our future work, we plan to analyze each attention
head individually to examine whether the associated
weights may have distinct interpretations in the med-
ical context. Finally, we aggregate the self-attention
weights between two tokens by calculating the me-
dian of these weights in all sequences combined. In
future work, we’d like to study the impact of the
choice of aggregation operation.
Finally, the results obtained showed that our ap-
proach enables a different performance analysis to
that obtained with global evaluation measures. In-
deed, in the two use cases studied, our method re-
vealed biases linked to the training data, which were
not detectable with recall measures, for example. In
this way, our approach facilitates understanding and
confidence in the predictions made by a model, thanks
to an automatic but thorough analysis of its learning.
ACKNOWLEDGEMENTS
We thank Milena Suarez Castillo and Javier Nicolau
for allowing this collaboration, the Lab Sant
´
e team for
the model developpement and the medical experts Di-
ane Naouri, Albert Vuagnat, and Constance Prieur for
their valuable expertise and the time dedicated to this
work. Their active participation in the validation ex-
ercises greatly contributed to the quality of our study.
REFERENCES
Amann, J. et al. (2020). Explainability for artificial intel-
ligence in healthcare: a multidisciplinary perspective.
BMC medical informatics and decision making, 20.
Bengio, Y. et al. (1994). Learning long-term dependencies
with gradient descent is difficult. IEEE Transactions
on Neural Networks, 5(2):157–166.
Devlin, J. et al. (2019). BERT: Pre-training of deep bidi-
rectional transformers for language understanding. In
Conference of the North American Chapter of the As-
sociation for Computational Linguistics: Human Lan-
guage Technologies, Volume 1 (Long and Short Pa-
pers), pages 4171–4186. Association for Computa-
tional Linguistics.
Dong, G. et al. (2021). Semi-supervised graph instance
transformer for mental health inference. In 2021 20th
IEEE International Conference on Machine Learning
and Applications, pages 1221–1228.
Li, Y. et al. (2020). BEHRT: transformer for electronic
health records. Scientific reports, 10(1):7155.
Li, Y. et al. (2022). Hi-BEHRT: hierarchical transformer-
based model for accurate prediction of clinical
events using multimodal longitudinal electronic health
records. IEEE journal of biomedical and health infor-
matics, 27(2):1106–1117.
Lin, T. et al. (2022). A survey of transformers. AI open,
3:111–132.
Luo, J. et al. (2020). HiTANet: Hierarchical time-aware
attention networks for risk prediction on electronic
health records. In 26th ACM SIGKDD International
Conference on Knowledge Discovery & Data Mining,
pages 647–656.
Meng, Y. et al. (2021). Bidirectional representation learning
from transformers using multimodal electronic health
record data to predict depression. IEEE journal of
biomedical and health informatics, 25(8):3121–3129.
Nerella, S. et al. (2023). Transformers in healthcare: A
survey. arXiv preprint arXiv:2307.00067.
IVAPP 2025 - 16th International Conference on Information Visualization Theory and Applications
704

Peng, X. et al. (2021). Sequential diagnosis prediction
with transformer and ontological representation. In
2021 IEEE International Conference on Data Mining,
pages 489–498.
Radford, A. et al. (2018). Improving language understand-
ing by generative pre-training.
Raffel, C. et al. (2020). Exploring the limits of transfer
learning with a unified text-to-text transformer. Jour-
nal of machine learning research, 21(140):1–67.
Rasmy, L. et al. (2021). Med-BERT: pretrained contextual-
ized embeddings on large-scale structured electronic
health records for disease prediction. NPJ digital
medicine, 4(1):86.
Ren, H. et al. (2021). RAPT: Pre-training of time-aware
transformer for learning robust healthcare representa-
tion. In Proceedings of the 27th International Confer-
ence on Knowledge Discovery & Data Mining, pages
3503–3511.
Shortliffe, E. H. et al. (2018). Clinical decision support in
the era of artificial intelligence. Jama, 320(21):2199–
2200.
Siebra, C. A. et al. (2024). Transformers in health: a sys-
tematic review on architectures for longitudinal data
analysis. Artificial Intelligence Review, 57(2):1–39.
Simonyan, K. et al. (2014). Deep inside convolutional net-
works: visualising image classification models and
saliency maps. In International Conference on Learn-
ing Representations.
Vaswani, A. et al. (2017). Attention is all you need. Ad-
vances in neural information processing systems, 30.
Vig, J. (2019). A multiscale visualization of attention in
the transformer model. In 57th Annual Meeting of
the Association for Computational Linguistics: Sys-
tem Demonstrations, pages 37–42.
Wen, Q. et al. (2023). Transformers in time series: a survey.
In 32nd International Joint Conference on Artificial
Intelligence, pages 6778–6786.
Ye, M. et al. (2020). Lsan: Modeling long-term depen-
dencies and short-term correlations with hierarchical
attention for risk prediction. In 29th ACM Interna-
tional Conference on Information & Knowledge Man-
agement, pages 1753–1762.
Evaluating Transformers Learning by Representing Self-Attention Weights as a Graph
705
