
Leveraging Embedding Vectors of Aggregate Images for Particle Size
Distribution Estimation and Concrete Compressive Strength Prediction
Samuel Fringeli
1 a
, Houda Chabbi Drissi
1 b
, Killian Ruffieux
1
, Julien Ston
2 c
and Daia Zwicky
2 d
1
iCoSys - Institute of Artificial Intelligence and Complex Systems, HEIA-FR,
Haute
´
Ecole Sp
´
ecialis
´
ee de Suisse Occidentale, Switzerland
2
iTEC - Institut des Technologies de l’Environnement Construit, HEIA-FR,
Haute
´
Ecole Sp
´
ecialis
´
ee de Suisse Occidentale, Switzerland
fi
Keywords:
Visual Embedding Vectors, Particle Size Distribution, Concrete, Compressive Strength, Data Augmentation,
MLP, XGBoost.
Abstract:
Accurate prediction of concrete properties, such as compressive strength, is essential for ensuring structural
performance. Particle size distribution (PSD) and nature of aggregates are key components of concrete mix-
tures, significantly influencing their final compressive strength. This paper presents a novel approach that
leverages embedding vectors extracted from images of aggregates using the DinoV2 model to efficiently pre-
dict compressive strength. DinoV2 is a state-of-the-art vision transformer that excels at generating high-quality
embeddings for various visual tasks. In this study, the effectiveness of these embeddings is evaluated by using
them to classify and estimate the PSD of aggregates on public datasets. Small neural models trained on these
vectors achieved comparable accuracy to the best found fine-tuned ViT-16 model, demonstrating the poten-
tial of using embedding vectors for accurate PSD prediction. Building on these results, a new approach for
predicting concrete compressive strength by combining embedding vectors with data on concrete mix com-
ponents is explored. A small dataset of concrete mixtures was created. To mitigate the challenges of limited
data, augmentation techniques were proposed to generate additional, realistic mix designs. An ablation study
was performed, indicating promising results and highlighting the potential of this new approach for predicting
other concrete properties.
1 INTRODUCTION
Among the properties of concrete, compressive
strength is significant to evaluate. This property is
essentially influenced by the principal components of
its recipe, i.e. the quantities of water, cement and the
used sources of aggregates. The latter differ in size
(particle size distribution PSD) and type (recycled or
natural). When dealing with natural aggregate con-
crete, it is possible to use semi-empirical formulas to
approximate the compressive strength based on some
parameters of the mix design. Using mixed or recy-
cled aggregates introduces new factors, which makes
it hard to use those formulas to predict the concrete
strength.
This paper focus on the use of machine learning to
a
https://orcid.org/0009-0001-7688-7360
b
https://orcid.org/0000-0001-7087-8108
c
https://orcid.org/0000-0002-4853-2685
d
https://orcid.org/0000-0003-4773-8670
train a model on various concrete recipes using differ-
ent aggregate sources to predict compressive strength.
The originality is to explore the potential of image
embedding vectors of the aggregates for estimating
concrete properties. To the best of our knowledge, no
previous studies have integrated embedding vectors
from aggregate images into concrete mix recipe data.
However, successful work has been carried out to es-
tablish the PSD from aggregate images. Our study
therefore begins by checking whether the embedding
vectors we plan to use contain information relevant
to aggregate images by means of estimating the PSD
using them and comparing this approach with others.
Figure 1 presents the two evaluations performed with
the embedding vectors of the aggregate images.
The paper is organized as follows. After present-
ing the related works in section 2, section 3 presents
the aggregates used in our work with their extracted
embedding vectors. The two following sections an-
swer the two questions that we deal with in this paper:
112
Fringeli, S., Drissi, H. C., Ruffieux, K., Ston, J. and Zwicky, D.
Leveraging Embedding Vectors of Aggregate Images for Particle Size Distribution Estimation and Concrete Compressive Strength Prediction.
DOI: 10.5220/0013111800003890
In Proceedings of the 17th International Conference on Agents and Artificial Intelligence (ICAART 2025) - Volume 2, pages 112-123
ISBN: 978-989-758-737-5; ISSN: 2184-433X
Copyright © 2025 by Paper published under CC license (CC BY-NC-ND 4.0)

Figure 1: The two evaluations performed in this paper
around the richness of embeddings vectors.
• Section 4 presents and discusses the performance
of embedding vectors derived from aggregate im-
ages in estimating the particle size density (PSD).
This section compares the proposed approach
with existing techniques.
• Section 5 presents and evaluates the effectiveness
of embedding vectors as supplementary features
in predicting concrete properties. Additionally,
this section details the small specialized dataset
employed in our study, along with the augmented
techniques developed to expand it.
Section 6 presents our conclusions, highlighting
key results and outlining our future research direc-
tions.
2 RELATED WORKS
Previous research has demonstrated the feasibility of
using aggregate images to predict PSD. Notable stud-
ies include Coenen et al.’s work (Coenen et al., 2022)
using a dedicated CNN model (AggNet) to achieve
95.5% accuracy on the public dataset (Coenen, 2022).
(Pasquier and Drissi, 2024) further explored this ap-
proach using pre-trained CNN models such as ResNet
and transformers, achieving 97% accuracy, on the
same dataset, by applying transfer learning and fine-
tuning to a pre-trained ViT-16 model.
This paper, proposes a novel approach leverag-
ing embedding vectors extracted from aggregate im-
ages using the DinoV2 model (Oquab et al., 2024).
DinoV2 is a self-supervised learning model that has
been trained on thousands of unlabelled images. Un-
like previous studies relying on implicit feature ex-
traction, our method explicitly extracts image em-
beddings and directly applied them to various tasks.
For PSD estimation, a multi layer perceptron (MLP)
model was created that takes these embedding vec-
tors as input. The MLP was then trained to predict the
PSD. To evaluate the approach, two publicly available
datasets (Coenen, 2022) and (Coenen, 2023) were
used, which aligns with our research objectives and
provides a robust benchmark for comparison.
When it comes to estimating the concrete com-
pressive strength, a time consuming experimental
”trial-and-error” approach can be used. Concrete
specimens are cast in cylindrical or cubic molds of
standard dimensions and the compressive strength
(CS) measured at specific ages (e.g., 7 and 28 days).
This approach was used in this study to build a custom
dataset where the produced concrete not only uses
natural aggregates but also recycled concrete aggre-
gates (RA).
Various methods have been developed to estimate
concrete compressive strength from the composition
recipe. A method used in European countries is
the so-called Bolomey’s formula (Abdelgader et al.,
2022). This semi-empirical equation considers the
water-to-binder ratio, the average strength of the ce-
ment at a given age, a coefficient characterizing the
aggregates and optionally the air content to estimate
the compressive strength of a concrete with such a
mix design. This equation provides reasonable pre-
dictions for normal concrete but lacks the finesse to be
efficient with RA. Recycled concrete is produced with
a fraction of its aggregate coming from crushed de-
molition waste, mostly concrete. Recycled aggregates
tend to have physical properties much more variable
than natural aggregates, thus making any prediction
complex.
(Nithurshan and Elakneswaran, 2023) reviews
predicting models of concrete compressive strength
and presents the approaches and models used as well
as the achieved accuracy. This review acknowledges
the accuracy of Machine Learning (ML) models, even
though it states that they may be difficult to inter-
pret. Our study aims to use an ML approach to
predict compressive strength of recycled aggregate
concrete. Many studies compared a variety of ML
models, including eXtreme Gradient Boosting (XG-
Boost), Random Forest, K-nearest Neighbors, Sup-
port Vector Regression, and Gradient Boosted Deci-
sion Trees (GBDT), to achieve this prediction. (Yuan
et al., 2022) and (Ouyang et al., 2020) findings show
that Random forest is a good tool for compressive
strength prediction while (Zhang et al., 2023) demon-
strated the superior predictive accuracy and gener-
alization ability of GBDT. Similarly, (Hosseinzadeh
et al., 2023) and (Wang et al., 2024) compared several
ML models and found XGBoost to be the most accu-
rate. These findings encouraged us to evaluate a deci-
sion tree technique, specifically XGBoost. While the
datasets used in these studies may not have identical
features, they all focus on the components of the con-
crete mix recipe. This is why none of these datasets
is suitable for the present research, as they lack the
necessary aggregate images for extracting embedding
Leveraging Embedding Vectors of Aggregate Images for Particle Size Distribution Estimation and Concrete Compressive Strength
Prediction
113
vectors alongside the recipe components. To address
this, we developed a new, dedicated dataset. To assess
the value of embedding vectors as additional features,
we conducted an input ablation study, to investigate
the benefits of incorporating them as additional fea-
tures alongside traditional inputs.
3 AGGREGATE IMAGES AND
THEIR EMBEDDING VECTORS
DinoV2 is a state-of-the-art self-supervised learning
(SSL) framework designed for image representation
learning. It is is trained on various large-scale un-
labeled datasets. Its key output is an image embed-
ding vector, which is a numerical representation that
capture the semantic and visual information contained
within an image. These embedding vectors can then
be used for training models on different specific tasks.
The backbone architecture used in DinoV2 is a Vi-
sion Transformer (ViT). Depending on the used ViT
(ViT-Small, ViT-Base, ViT-Large and ViT giant), the
embedding vectors are of different dimensional (384,
768, 1025 or 1535 respectivel ).
For our study, we focused on the embedding
vectors extracted from images of various aggregate
sources used in concrete mixes. Our images are ob-
tained by taking pictures in our laboratories. All im-
ages are homographically rectified to ensure consis-
tency.
Ten distinct aggregate sources are used, including
four natural aggregates and six recycled aggregates.
These sources exhibited varying size distributions.
Tables 1 and 2 provide the number of images for each
recycled and natural source, respectively. The PSD
ranges in mm are also provided for each source.
Table 1: Used recycled aggregate sources with their PSD
range and the number of images.
Rec-1 Rec-2 Rec-3 Rec-4 Rec-5 Rec-6
0-6 4-22 0-4 4-16 0-16 0-16
96 71 94 31 80 102
Table 2: Used natural aggregate sources with their PSD
range and the number of images.
Nat-7 Nat-8 Nat-9 Nat-10
0-4 4-8 8-16 16-32
87 80 96 86
For each aggregate source, every image was used
to extract two embedding vectors using DinoV2. We
selected 384 and 768 as our embedding dimensions,
to achieve a favorable trade-off between representa-
tional power and computational efficiency, creating
two multi-sets of embeddings: {EV S
384
i
,i = 1..10}
and {EV S
768
i
,i = 1..10}.
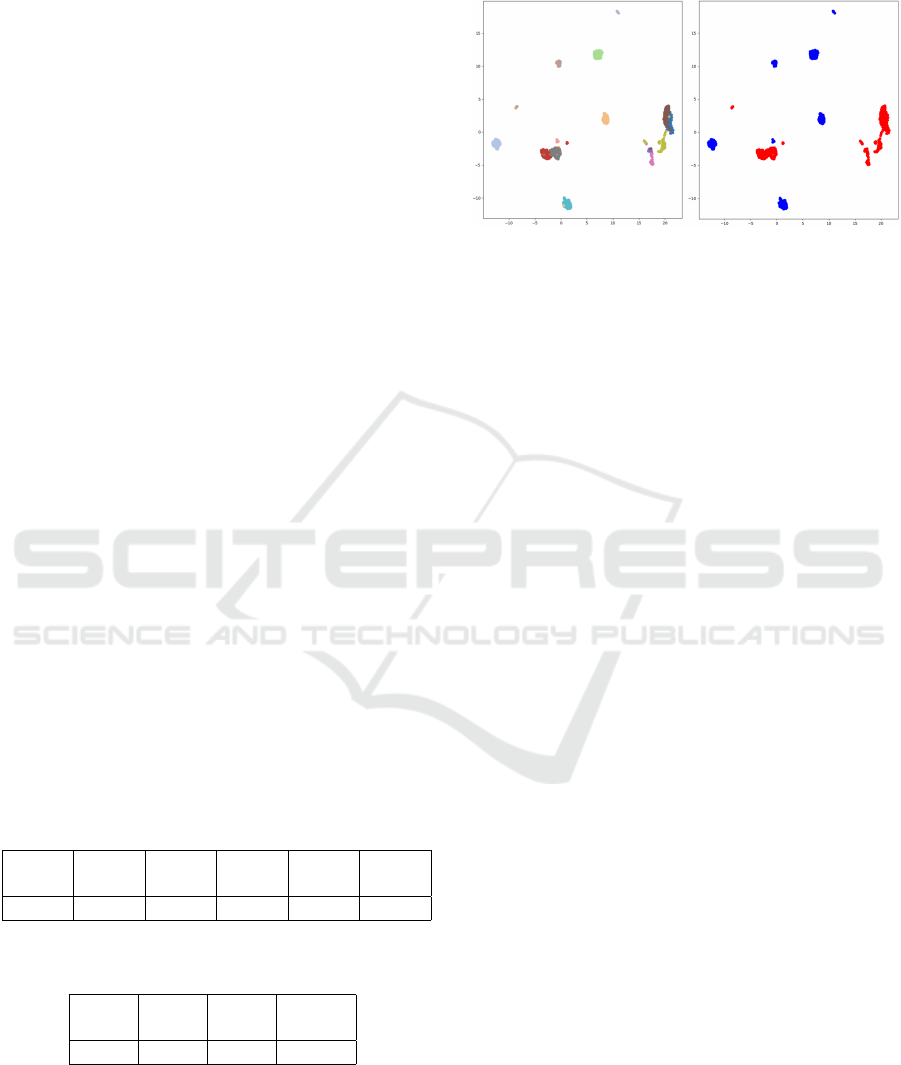
Figure 2: 2D UMAP visualization of EV S
384
i
. Left - Em-
bedding vectors / aggregate source: Each aggregate source
is represented with a different color. Right - embedding
vectors / aggregate type: Natural aggregates are in blue and
recycled aggregates are in red.
Figure 2, shows the 2D UMAP visualization of
the multi-set {EV S
384
i
,i = 1..10}. On the left, the em-
bedding vectors are colored according to their source
origin, while the right the same embedding vectors
are colored according to their type (recycled, natu-
ral). These visualisations, show that clusters corre-
sponding to different aggregate origins and types were
distinguishable in both cases. This confirms, that the
embedding vectors carry relevant information on ag-
gregates. However, two questions remain: Are these
embedding vectors effective for estimating PSD, and
can they help in predicting the properties of concrete?
The two following sections answers these two ques-
tions.
4 PARTICLE SIZE
DISTRIBUTION ESTIMATION
Aggregate particle size distribution, is a critical fac-
tor influencing the mechanical properties of con-
crete. Accurate estimation of PSD is essential for
optimizing concrete mix designs. This section, ex-
plores the effectiveness of using embedding vectors
extracted from aggregate images for PSD estimation
and compare the presented approach with state-of-
the-art methods, particularly focusing on the ViT-16
model as evaluated in (Pasquier and Drissi, 2024).
4.1 Evaluation Dataset
To ensure a fair and direct comparison with the ViT-
16 model presented in (Pasquier and Drissi, 2024),
the same publicly available datasets: the Visual Gran-
ulometry dataset (Coenen, 2022) and the Deep Gran-
ulometry dataset (Coenen, 2023) are used:
ICAART 2025 - 17th International Conference on Agents and Artificial Intelligence
114
• The Visual Granulometry dataset is designed for a
classification task and contains 900 images of ag-
gregates, each labeled with its corresponding DIN
1045-2 standard granulometric class. There are
nine classes in total, representing different grad-
ing curves or size distributions of the aggregates.
Each class includes 100 images, ensuring a bal-
anced dataset for classification.
• The Deep Granulometry dataset is intended for a
regression task and consists of 1,650 images of
coarse aggregate samples with particle sizes rang-
ing from 0.1 mm to 32 mm. Each image is ac-
companied by the mass percentage of each parti-
cle size considered, following 33 different PSD.
These datasets provide a standardized benchmark
for evaluating PSD estimation models. By using
them, we ensure that our evaluation is consistent with
previous studies and that any improvements or differ-
ences in performance can be attributed to the models
themselves rather than discrepancies in the data.
4.2 Neural Networks
In our approach, we developped Multi-Layer Per-
ceptron (MLP) models for the PSD estimation task.
Each of the model maps the high-dimensional em-
bedding vectors obtained from the DinoV2 model to
respectively the granulometric classes (classification
task: MLP C 384/768) or particle size distributions
(regression task: MLP R 384/768).
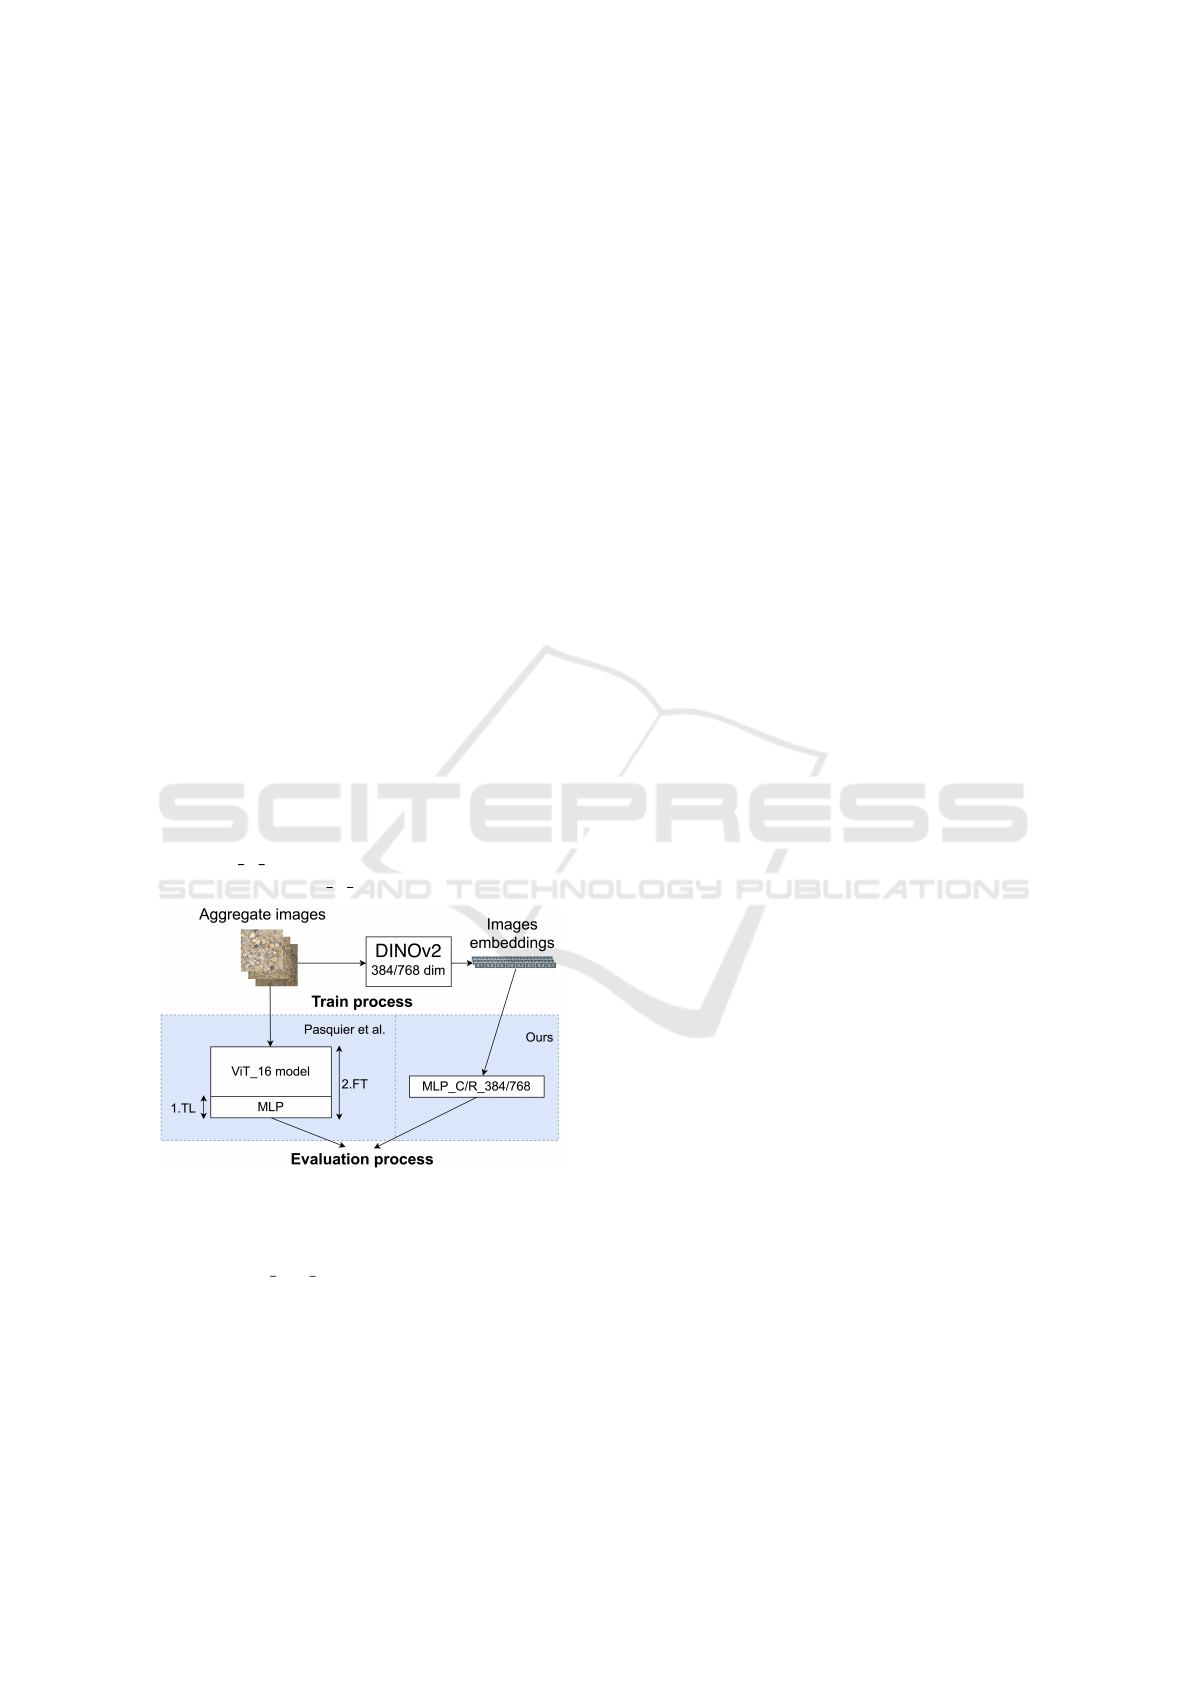
Figure 3: Illustrating the proposed approach compared to
the existing one. TL = transfer learning, FT = fine tuning.
As illustrated in figure 3, the architecture of the
proposed MLP C/R 384/768 models varies depend-
ing on the dimensional of the embedding vectors. In
each case we developed a model with four layers.
For embeddings of dimension 384 extracted using the
facebook/dinov2-small mode (resp. 768 extracted
using the facebook/dinov2-base model), the MLP
consists of:
• An input layer of size 384 (resp. 768)
• A hidden layer with 256 neurons (resp. 512) and
ReLU activation.
• A second hidden layer with 128 neurons (resp.
256) and ReLU activation.
• An output layer corresponding to the number of
granulometry classes (classification) or size bins
(regression), with appropriate activation functions
(softmax for classification, linear for regression).
The MLP models are trained using the Adam op-
timizer. For the classification task, we use the cross-
entropy loss function; for the regression task, we use
the mean squared error loss function. Early stopping
is employed based on validation set performance to
prevent overfitting.
4.2.1 Comparison with the Fine-Tuned ViT-16
Model
In the study conducted in (Pasquier and Drissi, 2024),
the Vision Transformer model ViT-16 was evaluated
for the task of PSD estimation and achieved state-
of-the-art performance. They used transfer learning,
freezing the feature extraction layers and training new
fully connected layers on top. Extensive hyperparam-
eter tuning, data augmentation, and fine-tuning were
performed to optimize performance.
In comparison, our approach leverages the embed-
ding vectors from DinoV2, allowing us to train rel-
atively small MLP models directly on these embed-
dings. This simplifies the training process and re-
duces computational requirements, enabling rapid it-
eration and experimentation. Despite the simplicity
of the proposed models, we achieve competitive per-
formance in PSD estimation, as demonstrated in our
experiments.
4.3 Experimental Setup
To ensure a fair and direct comparison with the ViT-
16 model presented in (Pasquier and Drissi, 2024), we
adopt the same experimental setup, using the same
datasets and data splitting strategies. By mirroring
the experimental setup described in this paper, we
ensure that any differences in performance are due
to the models themselves rather than experimental
variations. Both studies use the same datasets, data
splits, and evaluation metrics. While the authors
performed extensive hyperparameter tuning and data
augmentation, particularly for ViT-16, the proposed
approach benefits from the efficiency of training on
pre-extracted embedding vectors. The simplicity of
the proposed MLP models allows for rapid experi-
mentation without the need for extensive computa-
Leveraging Embedding Vectors of Aggregate Images for Particle Size Distribution Estimation and Concrete Compressive Strength
Prediction
115
tional resources. Therefore the experimental proce-
dure involves the following steps:
1. Data Preparation:
• Datasets: for the classification task, the Visual
Granulometry dataset (Coenen, 2022) is used;
while the Deep Granulometry dataset (Coenen,
2023) is used for the regression task.
• Embedding extraction: embedding vectors are
extracted from each image using the DinoV2
model, as described in Section 4.2. To investi-
gate the influence of dimensionality on perfor-
mance, experiments were conducted with two
different embedding vector sizes.
• Data splitting: each dataset is split into training
and test sets with an 80/20 ratio, identical to
(Pasquier and Drissi, 2024). The training set is
further split into training and validation subsets
(80/20 split).
2. Model Training and Evaluation:
• The fours MLP models (two classification
models MLP C 384/768 and two regression
models MLP R 384/768, each tailored to a spe-
cific embedding vector dimensionality) were
trained as described in Section 4.2 on the train-
ing data, using the validation set with early
stopping.
• To account for variability due to random data
splitting, the training process was repeated 10
times with different random seeds. This pro-
vides a more robust estimate of model perfor-
mance.
• Evaluation metrics: for classification, accuracy,
precision, recall, and F1-score are used. For re-
gression, mean absolute error (MAE) and root
mean squared error (RMSE) are the two used
metrics. The mean and standard deviation of
these metrics are computed over 10 iterations.
4.4 Results and Discussion
The experimental results demonstrate that models
trained on embedding vectors achieve competitive
performance in classification and PSD estimation.
4.4.1 Classification Task
For the classification task on the Visual Granulome-
try dataset, the proposed MLP models (MLP C 384
and MLP C 768) achieved an accuracy of up to 93%,
which is comparable to the 97% accuracy reported in
(Pasquier and Drissi, 2024) using a fine-tuned ViT-16
model.
Table 3: Comparison of classification model accuracies.
Model ViT 16 MLP C 384 MLP C 768
Accuracy 0.97 0.92 0.93
From the results presented in Table 3, we observe
that using the 768-dimensional embeddings provides
a slight improvement in accuracy compared to the
384-dimensional embeddings. Although the ViT-
16 model achieves higher accuracy, our MLP mod-
els trained on DinoV2 embeddings perform com-
petitively with significantly reduced complexity and
training time.
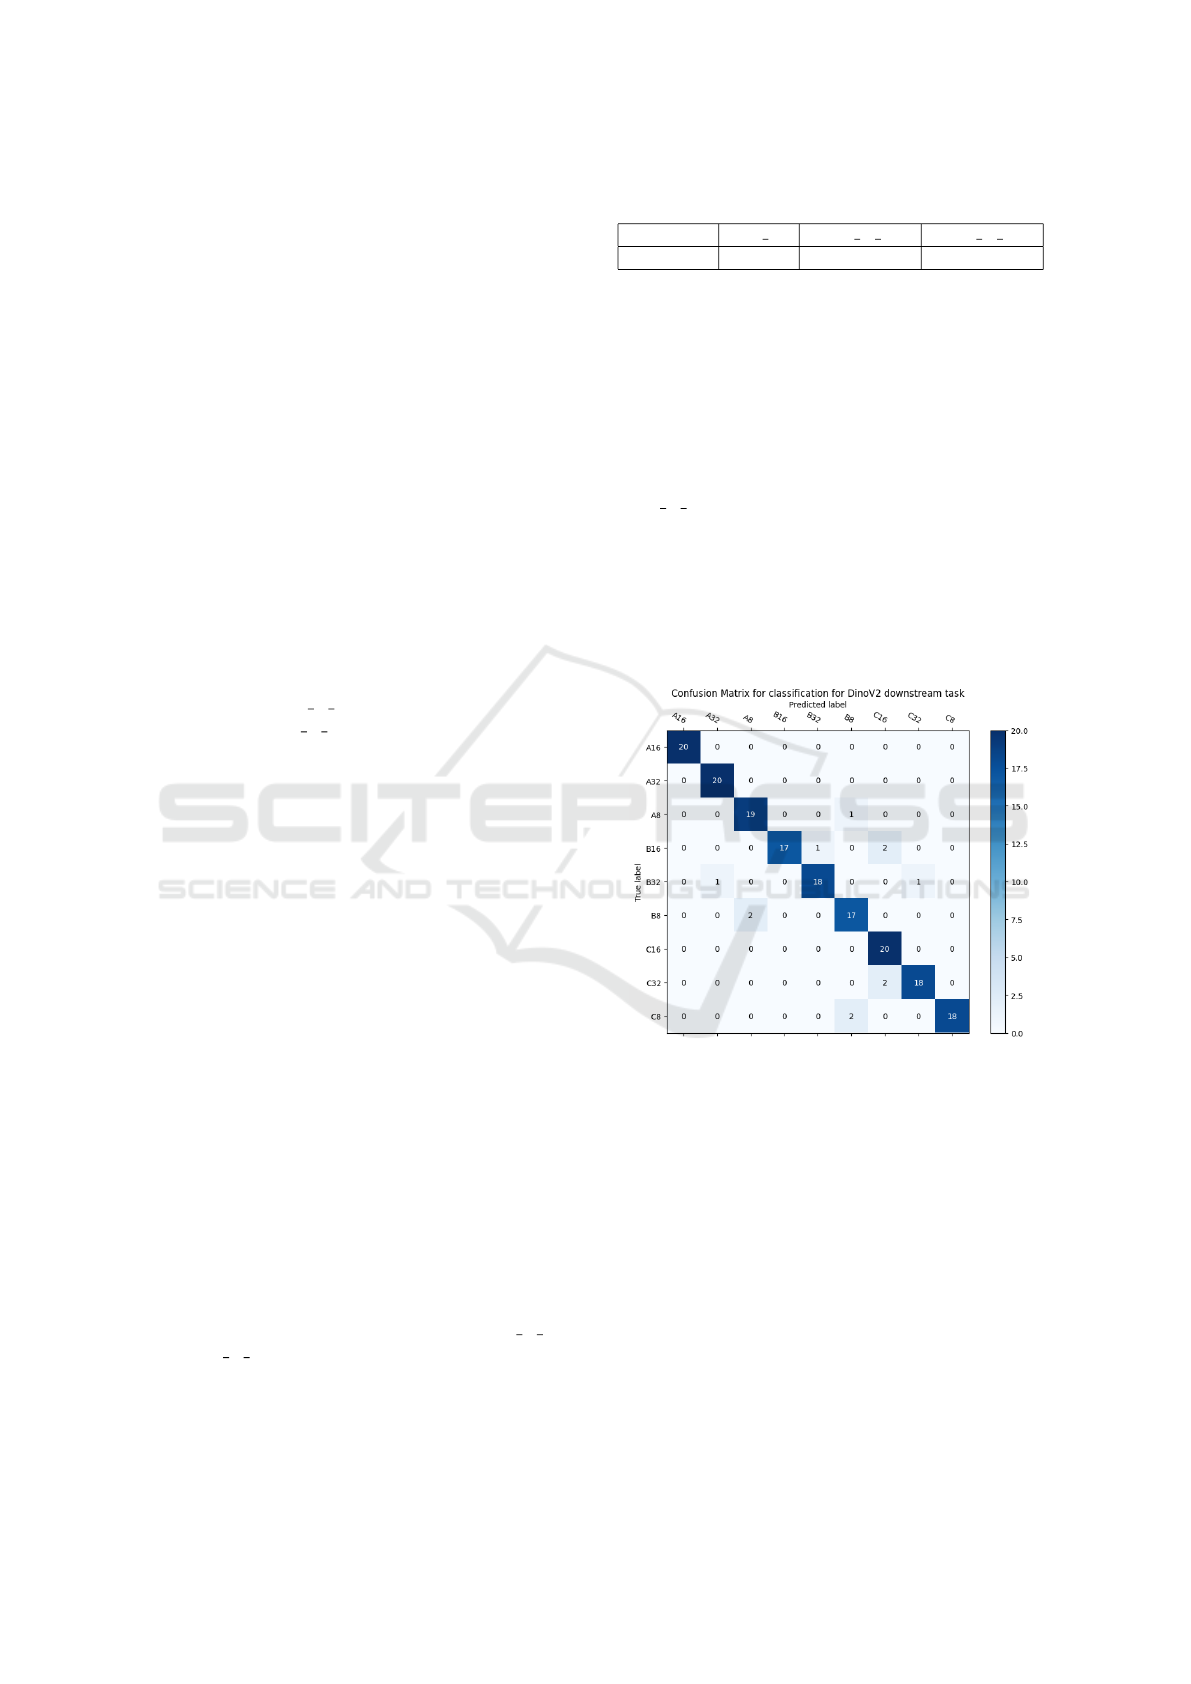
Figure 4 shows the confusion matrix for the
MLP C 384 model trained on 384-dimensional em-
beddings. The confusion matrix indicates that the
model performs well across most classes, with minor
misclassifications occurring between similar granu-
lometry classes. This suggests that the embedding
vectors effectively capture the visual features neces-
sary for distinguishing between different aggregate
sizes.
Figure 4: Confusion matrix for the MLP model trained on
384-dimensional embedding vectors.
4.4.2 Regression Task
For the regression task on the Deep Granulometry
dataset, the models were evaluated using MAE and
RMSE metrics. The MLP models trained on em-
bedding vectors achieved an MAE of 1.06% and an
RMSE of 1.51%, while the ViT-16 model achieved
an MAE of 0.59% and an RMSE of 0.93%. These
results are summarized in Table 4.
While the ViT-16 model demonstrates better per-
formance in terms of MAE and RMSE, our MLP
models still achieve respectable results, especially
considering the simplicity of the model and reduced
computational requirements. The regression results
compare favorably with other models evaluated in
ICAART 2025 - 17th International Conference on Agents and Artificial Intelligence
116
Table 4: Regression model performance comparison.
Model MAE (%) RMSE (%)
ViT 16 0.59 0.93
AGGNet 1.15 1.62
MLP R 384 1.18 1.62
MLP R 768 1.06 1.51
(Pasquier and Drissi, 2024), such as AggNet and other
CNN-based architectures, which reported higher er-
rors than ViT-16. The AggNet model achieved an
average MAE of 0.73% and an RMSE of 1.15% on
the Deep Granulometry dataset, which is close to our
MLP models’ performance. This indicates that our
approach is still competitive with specialized models
designed for PSD estimation.
Moreover, (Pasquier and Drissi, 2024) highlighted
that averaging predictions over multiple images of the
same aggregate mixture can significantly improve the
accuracy of PSD estimation. By averaging, even the
worst individual predictions become much closer to
the ground truth. This suggests that our approach
could similarly benefit from such averaging tech-
niques, potentially narrowing the performance gap
with ViT-16.
5 COMPRESSIVE STRENGTH
ESTIMATION
While the previous section demonstrated that embed-
ding vectors capture information about aggregates, it
remains to be determined whether this information
can be effectively used to estimate concrete proper-
ties.
5.1 Custom Dataset of Concrete Mix
Usually cement, water and aggregates proportions are
used as input data to the ML models to predict the
compressive strength as in the public dataset (Yuan
et al., 2022) . As we focus our research on the im-
pact of incorporating embedding vector of aggregate
images while predicting compressive strength of a
concrete, pre-existing datasets are unsuitable for our
study. Therefore, we build a custom dataset.
First, we designed a reference concrete mix able
to reach the C30/37 compressive strength class, con-
taining a minimal amount of 5% by weight of each
of the aggregate sources and a total of 55% of RA
in the aggregate fraction. The adequate effective
water-to-binder ratio was set to 0.49. The subsequent
mixes contained between 40% and 70% of recycled
aggregate, coming from different RA sources. In all
recipes, the granulometric curve of aggregates mix
followed the distribution of a F
¨
uller curve, with Dmax
= 32 mm. In addition, the water absorption WA24 of
each of the aggregate sources was measured accord-
ing to SN EN 1097-6:2014. This allowed us to take
into account the water that would be absorbed by the
aggregates during mixing. Therefore, extra water was
used in the mix to aim for the established effective
water-to-cement ratio. Only the superplasticizing ad-
mixture dosage was slightly adapted to the total RA
content to reach a workability similar to the reference
mix. For each mix design, we cast three 150 mm
cubes and four 150/300 mm cylinders to be tested at
28 days for compressive strength.
Given the time-intensive process of concrete pro-
duction and testing, only 23 unique concrete mix
recipes were generated. We fixed the quantities of ce-
ment and water in all the mix designs, allowing us
to study isolated effects of aggregate properties (type,
PSD and amount) on compressive strength. The com-
pressive strength (CS) of each mix was subsequently
measured at 28 days. The measured compressive
strength values fall within the range of 35.2 to 46.5
MPa, with an average of 39.2 MPa, a median of 39,
and a standard deviation of 3 MPa.
The variability in our dataset is due to the different
aggregate sources employed, all other elements being
held constant. These sources are selected from the set
of 10 distinct aggregates presented in section 3. The
main uncertainty on the CS prediction, comes from
the use of recycled concrete aggregates which change
the properties of the recipe in an unpredictable way.
This is why we used the same 4 sources of natural ag-
gregates in practically all recipes, changing only their
proportion in each mix design, and thus measure the
impact of recycled aggregates. On the other hand, mix
designs use different combination of the 6 sources of
recycled aggregates as illustrated in figure 5. Each
of these 6 sources is used in approximately the same
number of recipes as it is shown in figure 6.
Data collected for each of the 23 recipes is com-
posed of two main variable components R
we
and R
CS
(Figure 7 left side):
• R
we
is a vector of 10 values indicating the weight
of aggregates (kg/m
3
) for each of the 10 sources
used in the recipe. A value is set to 0, for the
unused sources.
• R
CS
is a vector of 7 values of the measured com-
pressive strength on a cylinder (MPa) at 28 days.
For each mix recipe, the mean value of the 7
compressive strength is taken as the compressive
strength.
Besides, constant information directly related to
the 10 used aggregates sources are available (Figure 7
right side):
Leveraging Embedding Vectors of Aggregate Images for Particle Size Distribution Estimation and Concrete Compressive Strength
Prediction
117
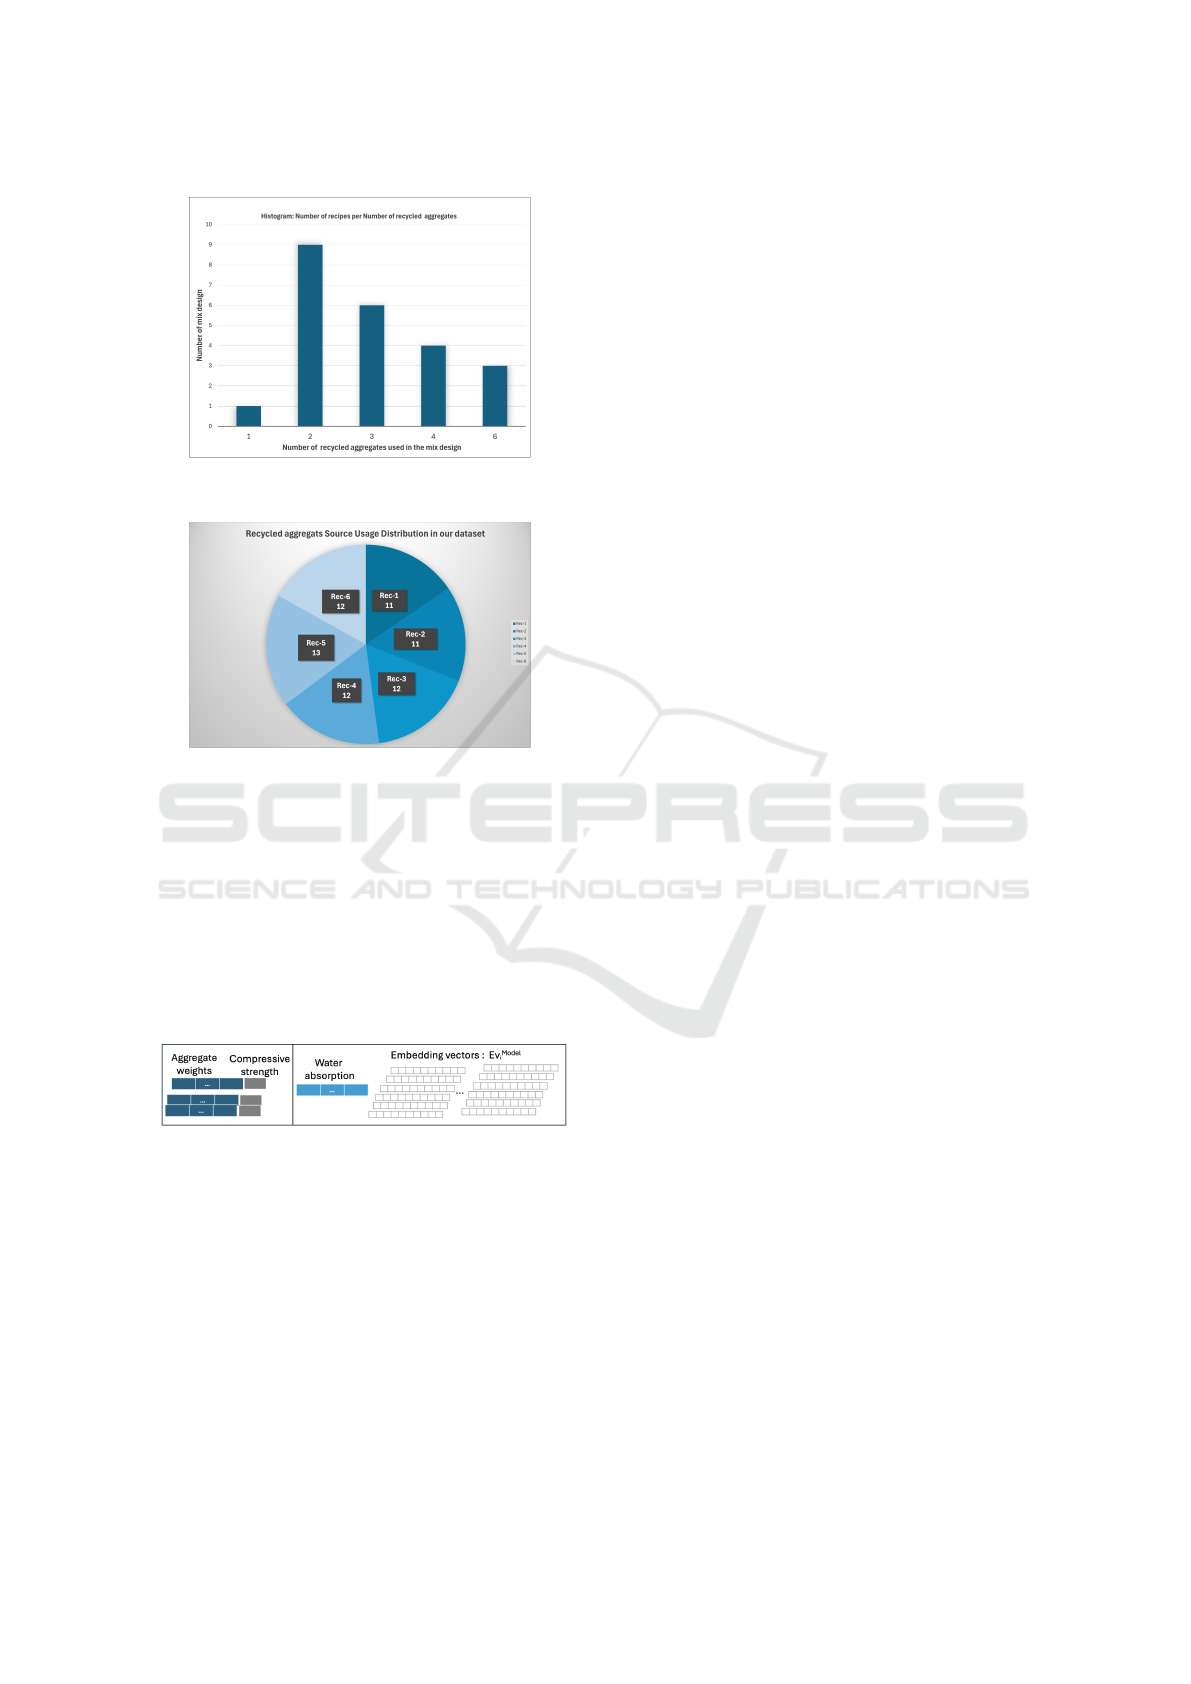
Figure 5: Histograms of number of recipes per number of
used aggregates.
Figure 6: Recycled aggregates source usage distribution
over the 23 mix design of the dataset.
• R
WA24
is a constant vector of 10 values related to
the Water absorption WA24 (l/m
3
) of each aggre-
gate source.
• EV S
384
i
, EV S
768
i
, EV S
384PCA
i
, EV S
768PCA
i
: the 4
sets of embedding vectors extracted for the i-th
aggregate sources. The two last ones are gen-
erated by applying Principal Component Analy-
sis (PCA) with a 5-dimensional projection to the
EV S
384
i
and EV S
768
i
respectively.
Figure 7: Left: Aggregate weights and compressive
strengths for each of the 23 mixes design. Right: Data
shared by all mixes.
5.2 Dataset Configurations
We prepared various dataset configurations for our
study. The baseline configuration used only the 23
starting data points. The accuracy of ML models
is directly related to the size of the training dataset.
(Ouyang et al., 2020) demonstrated that a minimum
of thousands data points is required to achieve max-
imum accuracy with the Random Forest technique
(RF). Recognizing the limited size of our dataset,
we proposed a novel data augmentation approach to
expand it to a reasonable size. The AUG dataset
is the dataset obtained by applying the data aug-
mentation techniques. We also explored configura-
tions with added water absorption data (WA datasets)
and configurations incorporating embedding vectors
(ENR datasets).
5.2.1 Baseline Configuration
This is the smallest dataset, as it is composed of 23
vectors of 10 values indicating the weight of the used
aggregates and the mean of the measured CS.
5.2.2 Augmented Data Configuration
To expand our small initial dataset, we propose a
data augmentation techniques to generate additional,
realistic mix design, similar to approaches employed
in image processing (Shorten, 2019).
Weight Augmentation. The goal of this augmenta-
tion is to slightly change the value of each R
we,i
=
(w
1,i
,...w
10,i
) where w
j,i
is the weight of aggregates
used from the j-th source, under the three following
constraints:
• The overall weights of aggregates W
T,i
is constant
between the original data and the augmented one.
• Only the weights of the used sources in a recipe is
changed (not adding new sources).
• Uncertainty in weight measure is about ± 10%
of the weight, corresponding to ± 100g for 1 kg
which is translated to add to each used j − th ag-
gregates an ε
j
= random.uni f orm(−0.1,0.1).
This leads to obtain R
aug
we,i
= (w
1,i
+ δ
1
∗
ε
1
,...,w
10,i
+ δ
10
∗ (ε
10
)) where δ
i
= 0 if the i-th
aggregate source is not used and 1 otherwise and to
ensure the three constraints,the equation 1 must be
respected:
10
∑
i=1
δ
i
∗ ε
i
= 0 (1)
Using this approach , several different R
aug
we,i
can
be generated from an initial R
we,i
.
Compressive Strength Augmentation. The goal of
this augmentation is to create more realistic compres-
sive strength values based on the existing ones. This
augmentation is based on the following assumption:
the compressive strength of the concrete follows a
log-normal distribution (Matthews et al., 2023).
Each raw data, has 7 values : R
CS
of the 7
measured compressive strengths. To augment the
ICAART 2025 - 17th International Conference on Agents and Artificial Intelligence
118

compressive strength value, we then generate Cs
′
=
logNormal(µ,σ) where
(µ =
1
7
7
∑
i=1
log(s
i
),σ =
s
∑
7
i=1
(log(s
i
) − µ)
2
7
) (2)
5.2.3 Enriched Configuration with Water
Absorption
Our interest is to analyze the impact of using wa-
ter absorption information while computing the
compressive strength. Therefore, we prepared con-
figurations where the data are enriched with the water
absorption data. To avoid adding 10 constant water
absorption values to all the rows of our input data,
variability is introduced by applying water absorption
augmentation defined as follow.
Water Absorption Augmentation. The goal of this
augmentation is to create more realistic water absorp-
tion values based on the existing ones. This augmen-
tation is based on the following assumption : the mea-
sure of the water absorption for each aggregate source
is precise at +/- 10%.
Thus, given the Water absorption value A
i
for the
i-th aggregate source, we simple generate A
i
(1 + ε
i
)
where each ε
i
= random.uni f orm(−0.1,0.1).
5.2.4 Enriched Configuration with Embedding
Data
Another important configuration in our study, is to
enrich the raw data with visual embedding vectors.
The parameter for this configuration is the model M j
used to create the embedding sets model: EV S
M j
i
,
with M j in [Dummy, 384, 768, 384 PCA, 768 PCA]
and i=1..10 for the 10 used aggregate sources.
The Dummy vectors in EV S
Dummy
i
were created
with randomly generated values within the min-max
range of real 384-dimensional embedding vectors.
This dataset, having values similar to that of real em-
bedding vectors, is used to assess the impact of real
embedding vectors on the compressive strength pre-
diction.
To enrich a raw data according to a model M j,
with the visual embedding vectors, 10 embedding
vectors are added, randomly selected from the 10 sets:
EV S
M j
i
. The variability in the embedding vectors di-
rectly comes from the variability in the images of each
of the aggregate sources.
5.3 Experimental Setup
5.3.1 Metrics
To evaluate our pipeline, we propose two metrics
which provide complementary information about the
model’s performance. We compute the RMSE along
with the MAE because the RMSE penalizes more the
large errors than the MAE. It is sensitive to outliers
which is less the case of the MAE measure. We use
the RMSE instead of the MSE because it is more in-
terpretable as it is in the same unit as the ground truth
mass percentage vector.
5.3.2 Models
We are interested in evaluating the benefit of using
embedding vectors for the compressive strength eval-
uation. We first choose a basic model for this regres-
sion task: ”Simple Linear Regression”. Then, and as
presented is section 2, we used ”XGBoost” (eXtreme
Gradient Boosting). This is a non linear model. It
creates a series of decision trees, each of which learns
from the errors of its predecessors. The final predic-
tion is an ensemble of the predictions from all the
trees. Scikit-learn (Pedregosa et al., 2011) provided
the implementations for the models used in this study.
5.4 Experimental Design
To evaluate the performances of the different mod-
els, we use an identical experimental setup for all of
them except for the baseline where all the original
raw data were used without augmentation or enrich-
ment of data. A K-Fold with 5 folds is used for the
prediction on the original 23 inputs. The training set
contains 80% of the data (18 recipes) and the test set
20% (5 recipes). The training set is used for the train-
ing and the cross-validation and the test set is used to
evaluate the model.
For all the others experiments, 5 different seeds
are used to split the data into train/test set using scikit-
learn’s train
test split function. This simulates
the 5-fold cross-validation and guarantees that we test
our model on different test sets. We then report the av-
erage and standard deviation of the test errors across
the five iterations.
Figure 8 illustrates the methodology used for the
evaluation. For each of the five experiments, we first
split the dataset into a training and test set with a
ratio of 50% (11 recipes) and 50% respectively (12
recipes), the latter being only used for the final evalu-
ation of each model in each ablation configuration of
the inputs. Before training, a step of dataset prepa-
ration is done to create the different configuration of
Leveraging Embedding Vectors of Aggregate Images for Particle Size Distribution Estimation and Concrete Compressive Strength
Prediction
119
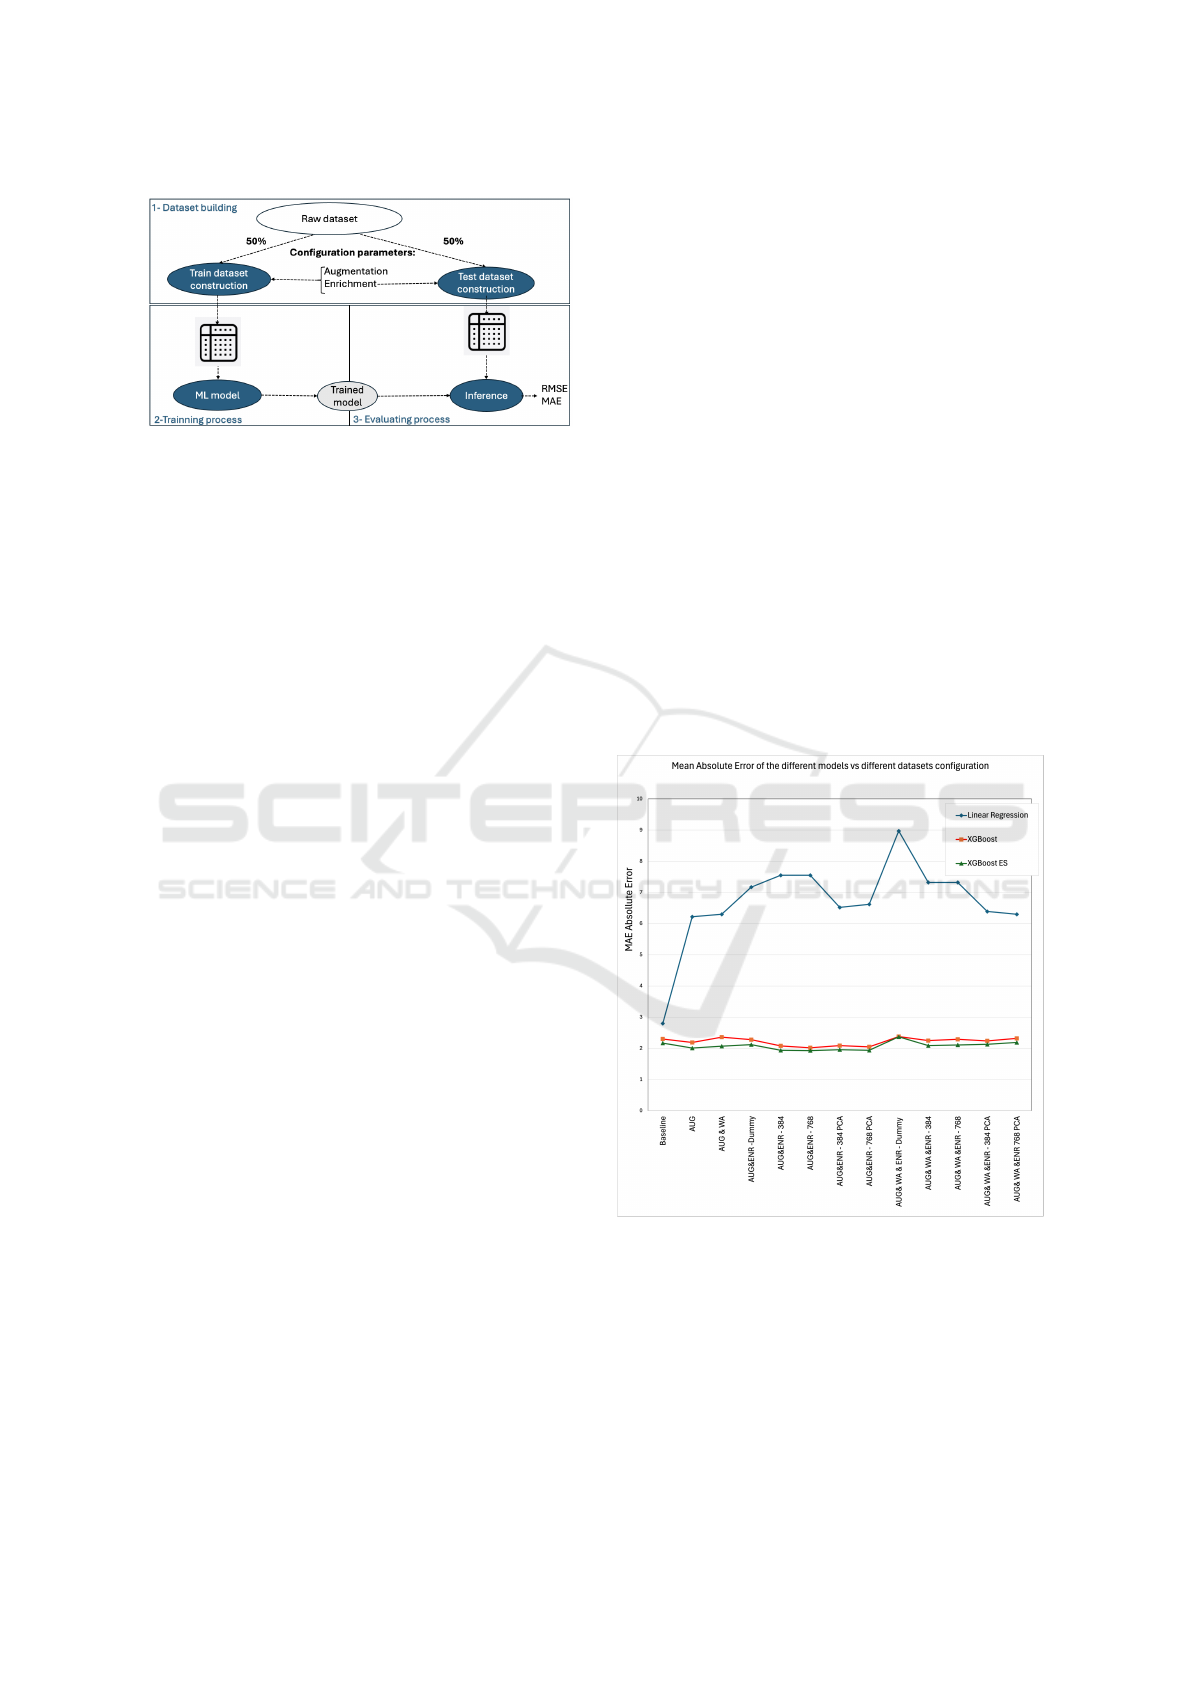
Figure 8: Train and test sets preparation giving the raw data
and the description of the needed configuration: with or
without embedding vectors etc.
input data. Here are the details on the 13 datasets that
are created to conduct our study:
• Baseline: 23 original input raw data each with 10
features.
• AUG: each original input of the train set is aug-
mented by 100 copies (The number 100 was cho-
sen based on our experiments) using our weight
and cs augmentation approach. This resulted in a
total of 11 * 100 = 1100 input rows. Each input
row has 10 features.
• AUG & WA : water absorption information is
added to the AUG data set. The water augmen-
tation function is used to avoid adding a constant
vector. Each input row has 20 features.
• AUG & ENR - [Dummy, 384, 768, 384 PCA,
768 PCA] : each original train data is augmented
by 100 copies and ten embedding vectors are
added, each one corresponding for each aggregate
sources. Each input row has (10 + 10*embedding
dimension) features.
• AUG & WA & ENR - [Dummy, 384, 768, 384
PCA, 768 PCA] : which combines augmentation
with enrichment of water and visual embeddings.
Each input row has (20 + 10*embedding dimen-
sion) features.
All the experiments were conducted with the 3
proposed models: the Linear Regression with the de-
fault parameters from scikit-learn (Pedregosa et al.,
2011) , a XGBoost and a XGBoost with early stop-
ping. The XGBoost model is used with a maximum
depth of 2 and 100 estimators. The early stopping is
based on the MAE with a patience of 5 rounds and the
same other hyperparameters as the XGBoost model.
5.5 Results and Discussion
Experiments were conducted following the method-
ology presented in section 5.4. We were interested in
answering the following questions:
Q1. Do we need to employ a more complex model
than linear regression, given that we only var-
ied aggregate sources while maintaining con-
stant water and cement quantities?
Q2. Does the implementation of data augmentation
as suggested in this study make sense and is it
beneficial?
Q3. Do embedding vectors enhance prediction re-
sults?
Q4. Does the dimensional of embedding vectors
impact the outcomes?
Figure 9 illustrates the Mean Absolute Error
(MAE) achieved by the three used models across the
different dataset configurations. The results show that
the linear regression model (blue curve) underper-
forms with a big error value compared to XGBoost
models which consistently enhance predictions, pro-
viding an affirmative answer A1, to Q1. Moreover,
the figure highlights that the XGBoost model with
early stopping (green curve) is the best model among
the three tested models.
Figure 9: Visualization of the MAE of the predicted values
on the different test datasets. The green curve is the result
of the XGBoost early stop. It has the best results.
To address the remaining three questions, we fo-
cus on the results presented in Figure 10 for Mean
Absolute Error (MAE) and Figure 11 for Root Mean
Squared Error (RMSE), specifically considering the
best model: XGBoost model with early stopping.
In these figures, we not only consider the mean
ICAART 2025 - 17th International Conference on Agents and Artificial Intelligence
120
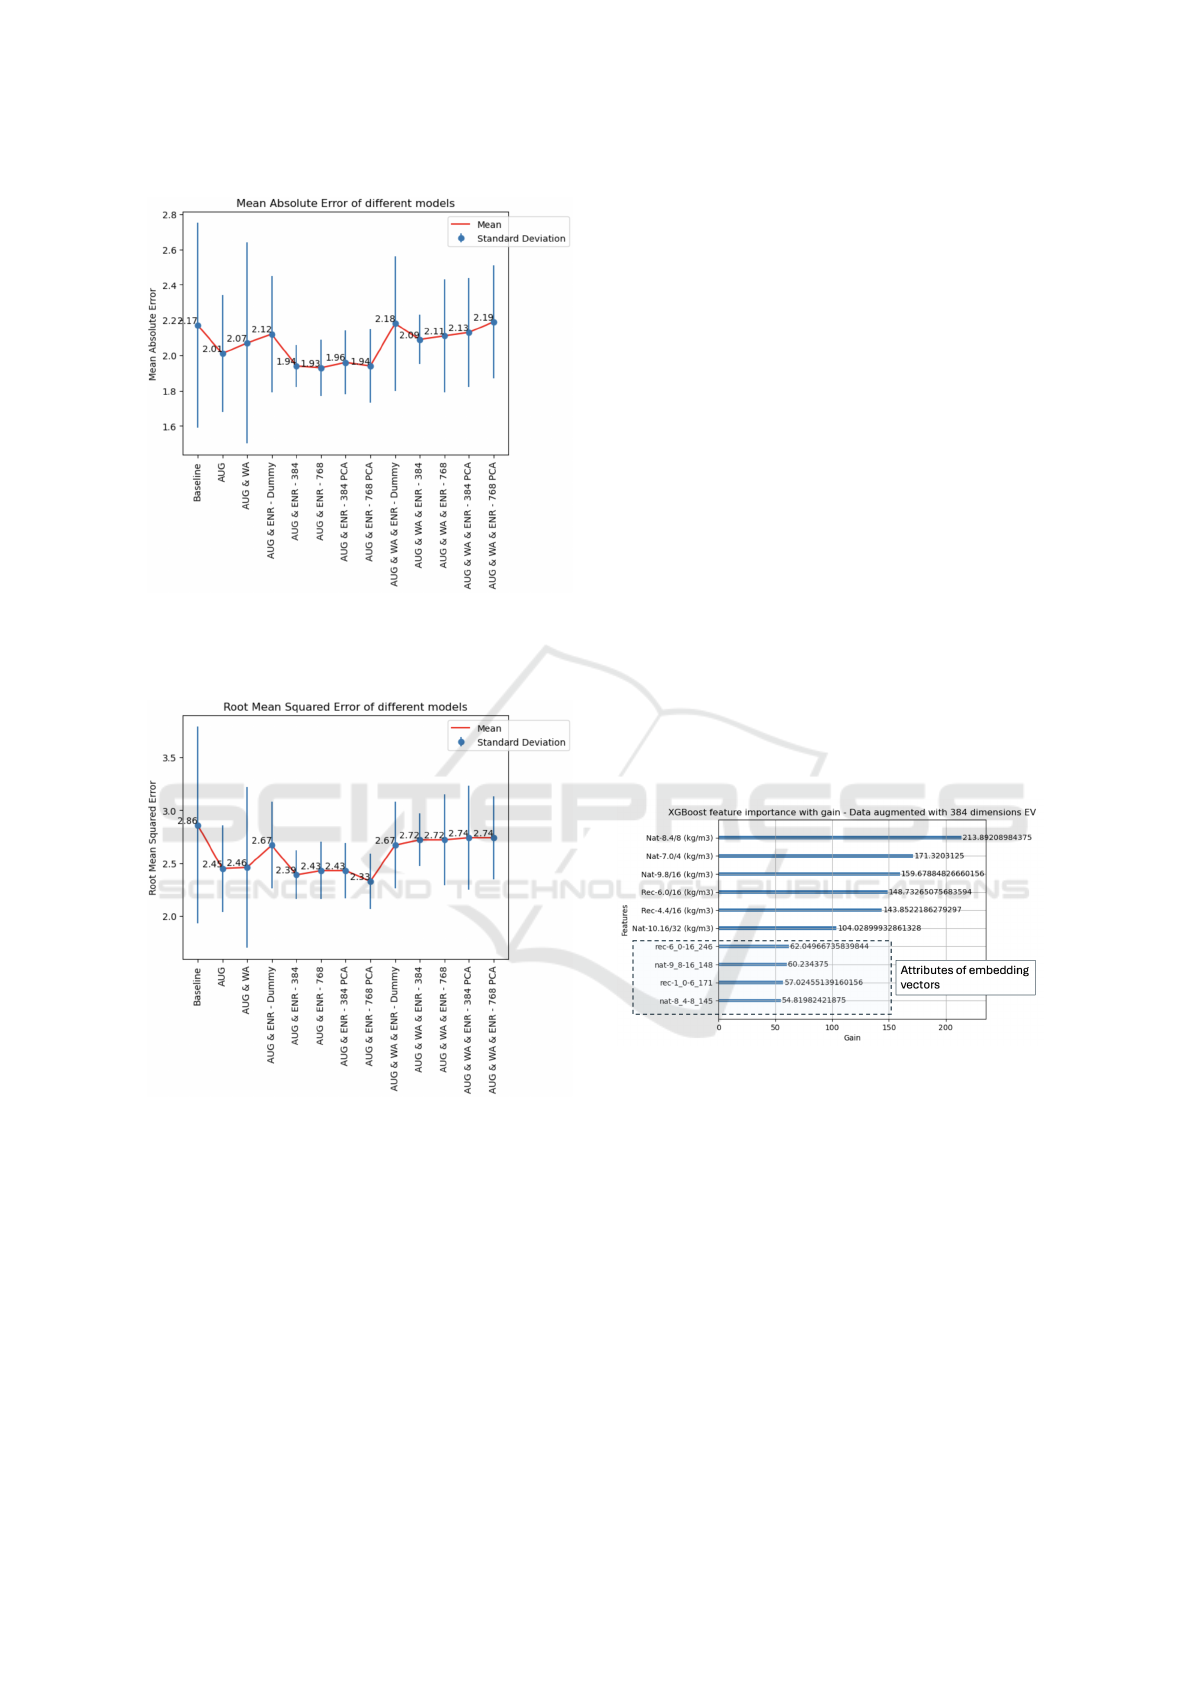
Figure 10: Visualization of the results on the test set for all
the different experiments for the XGBoost with early stop-
ping on the MAE. The best results are obtained by the 4
configurations including AUG and ENR.
Figure 11: Visualization of the results on the test set for all
the different experiments for the XGBoost with early stop-
ping on the RMSE. The best results are obtained by the 4
configurations including AUG and ENR.
values of the error but also the standard deviation, in-
dicating the model’s reliability. Analysing the results,
we draw the following answers:
A2. The augmentation strategy for weights and com-
pressive strength, as proposed in this study is
beneficial and improved the results on the mean
error and on the standard deviation.
In contrast, augmenting the data with water ab-
sorption data, using the proposed function, has
a negative impact on performance in all dataset
configuration with WA. Therefore, it is advis-
able to exclude this feature from the input vari-
ables.
A3. The incorporation of embedding vectors en-
hances the prediction results (an improvement
of 4% between AUG and AUG&ENR-768 on
the avergae MAE), this is seen in the results
of all the configurations including ENR in their
label (excluding configuration with WA and
Dummy). In addition, we can clearly see an im-
provement of the standard deviation which sug-
gests that the models are more reliable than the
one using only the AUG dataset.
To further validate the beneficial impact of us-
ing embedding vectors, we created configura-
tion with the use of the EV S
Dummy
i
instead of the
real embeddings vectors. This resulted in degra-
dation of performance, confirming the positive
impact of using visual embedding vectors.
A4. The choice of the embedding dimension, 384
or 768, has little impact with a minimal ef-
fect on performance. More over, using either
384-dimensional embeddings and even its 5-
dimensional PCA reduction still yields compa-
rable performance.
Figure 12: XGBoost feature importance with gain on the
AUG & ENR 384 configuration dataset. The final four fea-
tures are vector embedding attributes.
A final key observation is that embedding vec-
tors are not the primary factors influencing the XG-
Boost model’s ability to predict concrete compressive
strength. As illustrated in Figure 12, the proportion
of aggregates in the concrete mix is the more sig-
nificant determinant for compressive strength, which
aligns with expectations. Still, visual embedding vec-
tors improves the prediction, and the four last influ-
encing factors are particular attributes of embedding
vectors.
Leveraging Embedding Vectors of Aggregate Images for Particle Size Distribution Estimation and Concrete Compressive Strength
Prediction
121

6 CONCLUSIONS
The effectiveness of visual embedding vectors for
predicting both aggregate particle size distribution
and concrete properties was investigated. Our find-
ings demonstrate that embedding vectors, when used
to train simple MLP (Multi-Layer Perceptron) mod-
els, can accurately classify aggregates. The achieved
accuracy is comparable to that obtained with more
specialized or complex models. Therefore, when
dealing with new aggregate sources, only their im-
ages need to be taken, the corresponding embedding
vectors generated, and the model retrained with these
new vectors.
In addition to aggregate classification, the poten-
tial of embedding vectors to help predict one of the
key properties of concrete was explored. To evalu-
ate this, we contructed a custom dataset and a novel
estimation approach was developed. Due to the high
cost and time investment associated with each con-
crete formulation, a limited dataset was built, focus-
ing solely on the variability of aggregate proportions
while keeping water and cement quantities constant.
To ensure the validity of the findings, the limited
dataset was intentionally split in half, training the
models on one portion and reserving the other for
evaluation on unseen data. This choice led to a very
small training set size, so data augmentation tech-
niques were proposed and implemented to expand the
training dataset with realistic synthetic new samples.
Through extensive experimentation, we validated
the effectiveness of the proposed approach. The re-
sults showed that embedding vectors are useful in
predicting concrete compressive strength. The pro-
posed augmentation techniques were also validated.
The best results were obtained when embedding vec-
tors were added to the input raw data and the train-
ing dataset was augmented using the weight and com-
pressive strength augmentation techniques. The best
model can predict concrete compressive strength with
an MAE error of 1.94 MPa and an RMSE of 2.39
MPa. Considering that this is less than half of the
5 MPa standard deviation assigned to compressive
strength when statistical data is missing (Matthews
et al., 2023), it can be stated that the approach shows
promising results despite the limited dataset. Further
exploration of hyperparameter tuning for both particle
size and compressive strength prediction processes is
now feasible to obtain the best parameters for each
model.
A limitation of our study is the size and scope of
the dataset, which included a limited number of col-
lected data points and variations in mix recipes. Ex-
panding the dataset to include other key ingredients
such as water content and cement content and its type,
would be an interesting future direction.
As future work, and to further confirm our find-
ings, we propose to expand our study to the other
properties of concrete e.g. workability, early strength,
carbonation resistance, etc. It would also be benefi-
cial to evaluate the proposed data augmentation tech-
niques on conventional datasets from the literature to
validate their contribution. Finally, we also intend to
explore the use of the visual embedding vectors to
classify mixed aggregates and again use them in the
process of estimating the properties of concrete, that
has been manufactured using these mixed aggregates.
ACKNOWLEDGEMENTS
This research was supported by a grant of the HES-
SO / Appel
`
a projets
`
a th
`
eme (AGP 123165, fils de
AGP 123164).
REFERENCES
Abdelgader, S., Kurpinska, M., Khatib, J., and Abdelgader,
H. (2022). Concrete mix design using abrams and
bolomey methods. BAU Journal - Science and Tech-
nology, 4(1).
Coenen, M. (2022). Dataset: Visual granulometry: Image-
based granulometry of concrete aggregate.
Coenen, M. (2023). Dataset: Deep granulometry.
Coenen, M., Beyer, D., Heipke, C., and Haist, M. (2022).
Learning to sieve: Prediction of grading curves from
images of concrete aggregate. ISPRS Annals of the
Photogrammetry, Remote Sensing and Spatial Infor-
mation Sciences, V-2-2022:227–235.
Hosseinzadeh, M., Dehestani, M., and Hosseinzadeh, A.
(2023). Prediction of mechanical properties of re-
cycled aggregate fly ash concrete employing machine
learning algorithms. Journal of Building Engineering,
76:107006.
Matthews, S., Bigaj-van Vliet, A., and Dieteren, G. (2023).
Outlook upon fib model code for concrete structures
(2020). Structural Concrete, 24(4):4334–4335.
Nithurshan, M. and Elakneswaran, Y. (2023). A system-
atic review and assessment of concrete strength pre-
diction models. Case Studies in Construction Materi-
als, 18:e01830.
Oquab, M., Darcet, T., Moutakanni, T., Vo, H., Szafraniec,
M., Khalidov, V., Fernandez, P., Haziza, D., Massa,
F., El-Nouby, A., Assran, M., Ballas, N., Galuba, W.,
R.Howes, Huang, P.-Y., Li, S.-W., Misra, I., Rabbat,
M., Sharma, V., Synnaeve, G., Xu, H., Jegou, H.,
Mairal, J., Labatut, P., Joulin, A., and Bojanowski, P.
(2024). Dinov2: Learning robust visual features with-
out supervision.
ICAART 2025 - 17th International Conference on Agents and Artificial Intelligence
122

Ouyang, B., Li, Y., Song, Y., Wu, F., Yu, H., Wang, Y.,
Bauchy, M., and Sant, G. (2020). Learning from
sparse datasets: Predicting concrete’s strength by ma-
chine learning.
Pasquier, B. and Drissi, H. C. (2024). A comparative
study of deep learning models for granulometry image
based estimation of concrete aggregate. In EC3-2024.
Pedregosa, F., Varoquaux, G., Gramfort, A., Michel, V.,
Thirion, B., Grisel, O., Blondel, M., Prettenhofer,
P., Weiss, R., Dubourg, V., Vanderplas, J., Passos,
A., Cournapeau, D., Brucher, M., Perrot, M., and
Duchesnay, E. (2011). Scikit-learn: Machine learning
in Python. Journal of Machine Learning Research,
12:2825–2830.
Shorten, C., K. T. (2019). A survey on image data augmen-
tation for deep learning. J Big Data, 6.
Wang, W., Zhong, Y., Liao, G., Ding, Q., Zhang, T., and Li,
X. (2024). Prediction of compressive strength of con-
crete specimens based on interpretable machine learn-
ing. Materials, 17(15).
Yuan, X., Tian, Y., Ahmad, W., Ahmad, A., Usanova, K. I.,
Mohamed, A. M., and Khallaf, R. (2022). Machine
learning prediction models to evaluate the strength of
recycled aggregate concrete. Materials, 15(8).
Zhang, X., Dai, C., Li, W., and Chen, Y. (2023). Prediction
of compressive strength of recycled aggregate con-
crete using machine learning and bayesian optimiza-
tion methods. Frontiers in Earth Science, 11.
Leveraging Embedding Vectors of Aggregate Images for Particle Size Distribution Estimation and Concrete Compressive Strength
Prediction
123
