
Optimum-Path Forest Ensembles to Estimate the Internal Decay in
Urban Trees
Giovani Candido
1 a
, Luis Henrique Morelli
1 b
, Danilo Samuel Jodas
1 c
,
Giuliana Del Nero Velasco
2 d
, Reinaldo Ara
´
ujo de Lima
2 e
, Kelton Augusto Pontara da Costa
1 f
and Jo
˜
ao Paulo Papa
1 g
1
S
˜
ao Paulo State University (UNESP), School of Sciences, Bauru, Brazil
2
Institute for Technological Research, University of S
˜
ao Paulo, S
˜
ao Paulo, Brazil
{giovani.candido, luis.morelli, danilo.jodas, kelton.costa, joao.papa}@unesp.br,
Keywords:
Urban Tree Risk Management, Internal Trunk Decay, Machine Learning, Metaheuristics, Ensemble Learning.
Abstract:
Research on urban tree management has recently grown to include various studies using machine learning to
address the tree’s risk of falling. One significant challenge is to assess the extent of internal decay, a crucial
factor contributing to tree breakage. This paper uses machine and ensemble learning algorithms to determine
internal trunk decay levels. Notably, it introduces a novel variation of the Optimum-Path Forest (OPF) ensem-
ble pruning method, OPFsemble, which incorporates a “count class” strategy and performs weighted majority
voting for ensemble predictions. To optimize the models’ hyperparameters, we employ a slime mold-inspired
metaheuristic, and the optimized models are then applied to the classification task. The optimized hyperpa-
rameters are used to randomly select distinct configurations for each model across ensemble techniques such
as voting, stacking, and OPFsemble. Our OPFsemble variant is compared to the original one, which serves
as a baseline. Moreover, the estimated levels of internal decay are used to predict the tree’s risk of falling
and evaluate the proposed approach’s reliability. Experimental results demonstrate the effectiveness of the
proposed method in determining internal trunk decay. Furthermore, the findings reveal the potential of the
proposed ensemble pruning in reducing ensemble models while attaining competitive performance.
1 INTRODUCTION
Urban trees can pose significant risks, as failures
of trees or their constituent parts, like branches and
trunks, have caused damage to cities’ infrastructures,
private properties, and other assets, leading to physi-
cal injuries or fatalities (Roman et al., 2021). To miti-
gate these risks, many European and North American
cities have implemented tree risk management pro-
grams, which focus on the level of risk prediction by
analyzing a range of tree features (van Haaften et al.,
2021), including dendrometric measurements, indica-
tors of wood decay, such as the presence of fungi and
a
https://orcid.org/0000-0002-8139-5491
b
https://orcid.org/0000-0003-4404-9765
c
https://orcid.org/0000-0002-0370-1211
d
https://orcid.org/0000-0002-7316-196X
e
https://orcid.org/0000-0002-0193-2518
f
https://orcid.org/0000-0001-5458-3908
g
https://orcid.org/0000-0002-6494-7514
termites, and mechanical injuries. Usually, these fea-
tures are collected through fieldwork campaigns with
visual inspections and measurements. Nonetheless,
computer vision has emerged as a feasible alternative
to avoid time-consuming tasks and the usage of costly
devices in tree inventory (Nielsen et al., 2014).
A key challenge, though, is determining the ex-
tent of internal decay. Non-invasive techniques, such
as acoustic tomography, have addressed this issue. In
this method, sensors are strategically installed around
the tree trunk. Each sensor is subjected to a controlled
beat with a hammer, allowing for the measurement of
sound propagation speed in various directions. This
approach enables the detection of decayed areas char-
acterized by lower propagation speeds. However, this
method can be imprecise due to wood’s anisotropic
properties (Espinosa et al., 2017) and requires sub-
stantial fieldwork, limiting its scalability. While ear-
lier studies, such as (Lavall
´
ee and Lortie, 1968), have
noted a correlation between external tree characteris-
tics and internal decay, this study is the first to esti-
Candido, G., Morelli, L. H., Jodas, D. S., Velasco, G. N., Lima, R. A., Costa, K. A. P. and Papa, J. P.
Optimum-Path Forest Ensembles to Estimate the Internal Decay in Urban Trees.
DOI: 10.5220/0013113600003912
Paper published under CC license (CC BY-NC-ND 4.0)
In Proceedings of the 20th International Joint Conference on Computer Vision, Imaging and Computer Graphics Theory and Applications (VISIGRAPP 2025) - Volume 2: VISAPP, pages
895-902
ISBN: 978-989-758-728-3; ISSN: 2184-4321
Proceedings Copyright © 2025 by SCITEPRESS – Science and Technology Publications, Lda.
895

mate decay levels in a tree trunk’s cross-section using
ML models trained on tree attributes like dendromet-
ric measurements and health indicators.
This paper proposes estimating the level of inter-
nal trunk decay using ML models trained on attributes
typically used to predict the tree risk of falling, such
as dendrometric measurements, the presence of fungi
and termites, and mechanical injuries. This study uses
a promising metaheuristic based on slime mold forag-
ing behavior to optimize the models’ hyperparameters
for satisfactory performance. Furthermore, it seeks to
enhance performance by employing ensemble strate-
gies to combine the outputs of the various algorithms.
To create a heterogeneous ensemble, hyperparame-
ter configurations from different models are randomly
selected from the final population generated by the
slime mold algorithm in the tuning process.
One of the strategies adopted in this work is
OPFsemble, along with a novel variation of this en-
semble pruning technique. OPFsemble has demon-
strated competitive performance compared to other
clustering-based pruning methods and has outper-
formed the stacking generalization ensemble (Jodas
et al., 2023). The proposed variation generates meta-
data from the models’ outputs using the “count class”
method, which calculates the total number of predic-
tions for each class on the training set for each model.
This approach is more memory-efficient than the de-
fault meta-data strategy used by OPFsemble, as dis-
cussed in Subsection 2.2, which makes it more suit-
able for larger datasets. After applying this strategy,
the variant feeds the meta-data into the unsupervised
OPF to cluster similar models. The pruning strategy
then uses the mode method, which combines the pre-
dictions from the prototypes of each cluster using ma-
jority voting. However, in the proposed variant, the
final prediction is determined through a novel mecha-
nism: a weighted majority voting scheme, where the
models’ scores on the validation set are used to weigh
the contributions of each prototype.
This paper offers four major contributions:
• It introduces an ML-based method for inferring
the internal trunk decay and the risk of falling;
• It employs a metaheuristic technique to populate
ensembles with distinct hyperparameter setups;
• It proposes a variation of the OPFsemble, which
incorporates the “count class” method and uses
weighted voting for the final output; and
• It promotes access to an urban tree dataset.
This work is structured as follows: Section 2 elu-
cidates the proposed model. Section 3 describes the
methodology, including the dataset and experimental
setup. Results are shown and discussed in Section 4,
and conclusions are outlined in Section 5.
2 PROPOSED METHOD
This section outlines the three-stage strategy used to
validate the proposed approach fully, assessing the
impact of internal decay predictions on the accuracy
of tree risk predictions. It then briefly overviews the
vanilla OPFsemble and the proposed variation.
2.1 Overview
The proposed method consists of three major steps:
Prediction of the Level of Internal Decay. In the
first phase, the Hyperparameter Optimization (HPO)
is performed for a wide range of diverse ML models
using Slime Mold Algorithm (SMA), as detailed in
Subsection 3.3. Following that, the best hyperparam-
eters are selected to train the models. Subsequently,
these models are evaluated on test samples.
Prediction of the Tree Risk with Actual Internal
Decay. The previously selected best hyperparameters
are then used to initialize and train the models to
predict the tree’s risk of falling by considering the
actual internal decay and additional tree-related den-
drometric aspects. Following the training procedure,
the models are evaluated on the test samples.
Prediction of the Tree Risk with Estimates for In-
ternal Decay. At the concluding stage, the models
trained in the preceding phase are employed to fore-
cast the tree risk of falling on the test samples by con-
sidering estimates for internal decay rather than rely-
ing on the actual values. This step allows the assess-
ment of the approach’s reliability.
2.2 OPFsemble
OPFsemble (Jodas et al., 2023) is an ensemble prun-
ing technique based on unsupervised OPF (Rocha
et al., 2009), designed to select the most relevant clas-
sifiers. It leverages the clustering space to identify
prototypes from the most representative clusters, aim-
ing to enhance diversity by combining different clas-
sifiers with comparable performance.
Starting with an ensemble of n classifiers, k-fold
cross-validation on the training set T generates pre-
dictions from each classifier. In each iteration, k − 1
folds compose the training set T
1
, and the remaining
VISAPP 2025 - 20th International Conference on Computer Vision Theory and Applications
896

fold serves as a validation set T
2
for baseline clas-
sifiers. The hits and misses from the predictions on
T
2
across the k iterations are aggregated into a set S ,
which contains n entries — one for each classifier —
and t meta-features, where t represents the number
of samples in T . This process, called the “oracle”
strategy, creates the meta-data for clustering the clas-
sifiers. Correctly classified instances are denoted by
one, and misclassified ones are denoted by zero. Ad-
ditionally, the average F1-Score is computed for each
classifier. The meta-data set S is then clustered using
unsupervised OPF, grouping classifiers with similar
predictions and representing each group with a proto-
type classifier. For combining the forecasts in the final
ensemble, various strategies can be employed, such as
the mode strategy, which selects the most frequently
predicted class among the prototypes.
2.3 Modifications on OPFsemble
The proposed OPFsemble variation introduces two
significant changes. The first difference lies in the
data provided for the clustering step. Using the cross-
validation procedure, the first-level models undergo
evaluation on distinct validation sets V
2
. Subse-
quently, their predictions are aggregated and stacked
together. Rather than directly feeding the models’
estimates S to the unsupervised OPF, this study in-
troduces the “count class” strategy for generating the
meta-data, which differs from the standard OPFsem-
ble “oracle” strategy, which records hits and misses
for each model’s predictions on the training set.
This method counts the occurrences of each class
within the predictions of every classifier forming the
ensemble model, resulting in a matrix C = [c
i j
]
n×l
,
where n represents the number of classifiers in the en-
semble, l denotes the number of classes, and c
i j
is
the number of validation samples the i-th classifier
assigned to the j-th class. This approach is helpful in
further reducing the meta-data representation in terms
of the feature dimension, thus promoting a dynamic
approach to fit the data distribution
1
. Compared to
the “oracle” strategy, this method is more memory-
efficient. While the “oracle” approach tracks hits and
misses with a structure of dimension n ×t, where t is
the number of samples in T , the “class count” method
requires a structure of dimension n × l, where l is the
number of classes in the problem. Since typically
l ≪ t — the number of classes is much smaller than
the number of training samples — the proposed ap-
proach is far more scalable for larger datasets.
In this version of the ensemble pruning technique,
1
Matrix C considers the cumulative class counting con-
sidering all iterations of the k-fold procedure
weighted majority voting is employed to predict the
final result. This approach involves assigning weights
to the votes based on the models’ scores. These scores
are the F1-Score values averaged across the validation
rounds of the cross-validation process. This voting
scheme is defined as follows:
y
k
= argmax
i
(p
i
), ∀i ∈ Y , (1)
where y
k
is the predicted class for the instance k, Y
denotes the set of class labels, and p
i
is the aggregated
weight for the i-th class label, which is computed as:
p
i
=
s
∑
j=1
w
j
p
i j
, (2)
in which s represents the number of selected classi-
fiers resulting from the pruning procedure, w
j
denotes
the F1-score assigned to the j-th classifier, and p
i j
equals one if the j-th classifier predicts the i-th class
label, or zero otherwise.
3 METHODOLOGY
This section provides an overview of the methodol-
ogy considered for this work. It briefly describes the
dataset employed, the data preprocessing and HPO
steps, and the ensemble learning module. Then, it ex-
plains the experimental setup.
3.1 Dataset
The dataset, provided by the Institute for Technologi-
cal Research (IPT), comprises data collected through
fieldwork conducted in S
˜
ao Paulo, Brazil. Available
in the authors’ GitHub repository
2
, it encompasses
39 attributes and two target variables obtained from
2,878 trees from seven species, distributed as follows:
Libidibia ferrea (135 samples), Cenostigma pluvio-
sum (1,049 samples), Holocalyx balansae (190 sam-
ples), Jacaranda mimosifolia (147 samples), Ligus-
trum lucidum (140 samples), Pleroma granulosum
(140 samples), and Tipuana tipu (1,077 samples).
Among the attributes are seven continuous vari-
ables: tree dendrometric measures, including the Di-
ameter at Breast Height (DBH), canopy diameter and
width, tree height, and trunk angle. The dataset also
provides 32 categorical features, such as tree species,
wood density, presence of cracks, and attack levels of
fungus and termites. Furthermore, it includes two tar-
gets: (i) the level of internal decay at the tree’s base
2
https://github.com/giovcandido/urban-tree-dataset/
Optimum-Path Forest Ensembles to Estimate the Internal Decay in Urban Trees
897
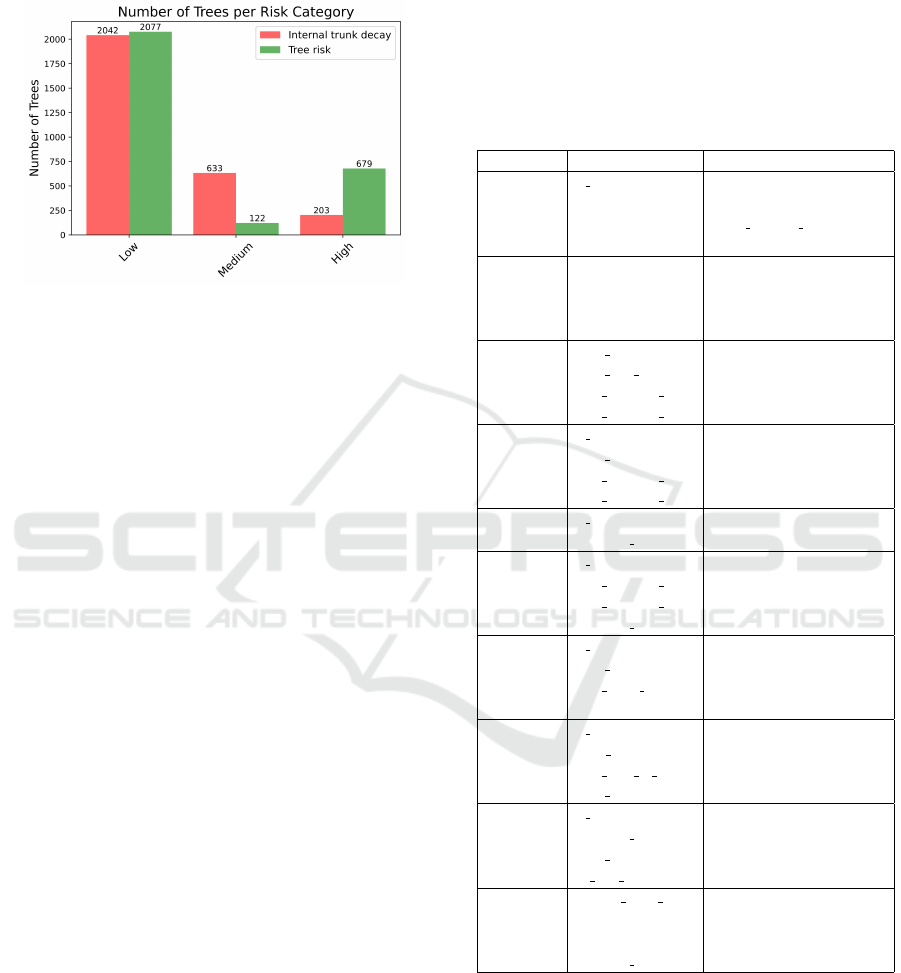
and (ii) the tree risk. Figure 1 depicts the class dis-
tributions of the targets, which shows the imbalanced
trend towards low levels of decay and risk.
Figure 1: Class distribution of target variables.
3.2 Data Splitting and Preprocessing
The dataset was divided into three subsets: training,
validation, and test, following the 80/10/10 scheme.
After the split, the features were standardized to zero
mean and unitary variance to prevent models from be-
ing disproportionately influenced by the inputs and
to speed up convergence (Zheng and Casari, 2018).
Then, the features were ranked by relevance, con-
sidering their Mutual Information (MI) with the tar-
get variable, and the top 80% were selected. In ad-
dition, to address the class imbalance in the train-
ing data, the Synthetic Minority Over-sampling Tech-
nique for Nominal and Continuous (SMOTENC)
(Chawla et al., 2002) was employed to generate ad-
ditional data samples by interpolating randomly se-
lected training instances and their 5 nearest neighbors.
3.3 Hyperparameter Optimization
In this work, SMA was employed for the optimiza-
tion process. Inspired by slime molds’ foraging
mechanism, SMA mimics the gradual movement of
fungi toward areas with higher food concentrations.
This technique was chosen due to its relative novelty
and promising results compared to traditional meta-
heuristics on various benchmark functions (Li et al.,
2020). Moreover, slime molds have successfully tack-
led complex problems, such as the Traveling Sales-
man Problem (TSP) (Zhu et al., 2018).
The hyperparameter optimization (HPO) step op-
timized nearly four hyperparameters per model, as
detailed in Table 1. Essentially, SMA iterated for a
maximum of 50 epochs, employing an early stopping
mechanism with a patience threshold of 10 epochs.
Within the optimization loop, a population of poten-
tial hyperparameter configurations underwent modifi-
cation following the algorithm’s rules. Subsequently,
each candidate solution was utilized to train a model,
with its fitness assessed on a validation set using bal-
anced accuracy. Then, the best solution was chosen to
train the final model using the combined training and
validation sets. Finally, this model underwent evalua-
tion on the test set.
Table 1: Search spaces for the hyperparameter tuning step.
Model Hyperparameter Search Space
k-NN
n neighbors [5, 100]
weights {uniform, distance}
algorithm {ball tree, kd tree, brute}
p [1, 2]
SVM
C [0.001, 30.0)
gamma [0.0, 1.0)
kernel {linear, poly, rbf, sigmoid}
degree [1, 5]
DT
max depth [2, 10]
max leaf nodes [2, 10]
min samples leaf [2, 10]
min samples split [2, 10]
RF
n estimators [5, 1000]
max depth [2, 10]
min samples split [2, 10]
min samples leaf [2, 10]
AdaBoost
n estimators [5, 1000]
learning rate [0.001, 1.]
GBM
n estimators [5, 1000 ]
min samples split [2, 10]
min samples leaf [2, 10]
learning rate [0.001, 1.0]
XGBoost
n estimators [5, 1000]
max depth [3, 10]
min child weight [3, 10]
gamma [0.0, 2.0)
LightGBM
n estimators [5, 1000]
num leaves [2, 1024]
min data in leaf [1, 100]
max depth [3, 10]
CatBoost
n estimators [5, 1000]
learning rate [0.001, 1.0)
max depth [3, 10]
l2 leaf reg [0.0, 1.0)
MLP
hidden layer sizes {10,20,30}
activation {relu, logistic, tanh}
alpha [0.0001, 1.0)
learning rate {constant, adaptive}
*DT=Decision Tree; RF=Random Forest.
3.4 Ensemble Learning
After executing SMA, we randomly selected 10, 30,
50, and 100 distinct classifiers with different hyper-
parameter settings from the final population to com-
pose four heterogeneous ensemble approaches: vot-
ing, stacking, the original OPFsemble, and the pro-
VISAPP 2025 - 20th International Conference on Computer Vision Theory and Applications
898

Table 2: Model performance in estimating the level of decay on the test set.
Model Bal. Accuracy
Recall
HPO Time Training Time
Low Medium High
k-NN 0.4972 ± 0.0163 0.6427 ± 0.0212 0.3770 ± 0.0262 0.4720 ± 0.0615 278.3870 ± 39.2907 0.0148 ± 0.0023
SVM 0.5162 ± 0.0150 0.7780 ± 0.0201 0.3528 ± 0.0312 0.4180 ±0.0606 752.5042 ± 84.0820 1.4117 ± 0.2958
DT 0.5144 ± 0.0124 0.6472 ± 0.0183 0.3179 ±0.0747 0.5780 ± 0.0895 226.9895 ± 24.5634 0.0210 ± 0.0023
RF 0.4618 ± 0.0236 0.7840 ± 0.0321 0.1795 ±0.0470 0.4220 ± 0.0984 366.4776 ± 33.1794 0.7691 ± 0.6114
AdaBoost 0.4803 ± 0.0220 0.7125 ± 0.0423 0.3204 ±0.0817 0.4080 ± 0.1283 353.7023 ± 28.7658 2.0660 ± 1.1693
GBM 0.4652 ± 0.0199 0.6945 ± 0.0400 0.2830 ±0.0559 0.4180 ± 0.0785 982.3318 ± 82.0159 1.6919 ± 1.7386
XGBoost 0.5001 ± 0.0210 0.7670 ± 0.0220 0.2814 ±0.0530 0.4520 ± 0.0682 348.8647 ± 52.0001 0.1306 ± 0.1041
LightGBM 0.4947 ± 0.0218 0.7373 ± 0.0371 0.2609 ±0.0802 0.4860 ± 0.1157 320.9031 ± 32.3549 0.1034 ± 0.1204
CatBoost 0.5083 ± 0.0135 0.6849 ±0.0165 0.3019 ± 0.0499 0.5380 ± 0.0676 407.0626 ± 33.5992 0.2174 ± 0.1953
MLP 0.4492 ± 0.0207 0.8481 ± 0.0308 0.2615 ±0.0478 0.2380 ± 0.0727 1200.0089 ± 162.0339 4.5127 ± 1.4510
10 Classifiers
VE 0.5123 ± 0.0151 0.7420 ± 0.0246 0.2587 ±0.0507 0.5360 ± 0.0760 - 9.7203 ± 2.4668
Stacking 0.4337 ± 0.0215 0.8155 ± 0.0321 0.2955 ±0.0484 0.1900 ± 0.0673 - 49.4630 ± 11.5285
O-OPFsemble 0.4595 ± 0.0246 0.8003 ± 0.0437 0.2403 ±0.0873 0.3380 ± 0.1022 - 70.2391 ± 16.0751
C-OPFSemble 0.5013 ± 0.0181 0.7119 ± 0.0345 0.2399 ± 0.0742 0.5520 ±0.1180 - 67.5236 ±15.1093
30 Classifiers
VE 0.5208 ± 0.0118 0.7379 ± 0.0167 0.2305 ±0.0551 0.5940 ± 0.0632 - 30.2786 ± 5.5683
Stacking 0.4211 ± 0.0161 0.8806 ± 0.0159 0.2368 ±0.0345 0.1460 ± 0.0325 - 150.8811 ± 27.4457
O-OPFsemble 0.5170 ± 0.0181 0.7805 ± 0.0211 0.2384 ±0.0521 0.5320 ± 0.0717 - 224.1642 ± 32.4723
C-OPFSemble 0.5164 ± 0.0180 0.7399 ± 0.0209 0.2415 ± 0.0499 0.5680 ±0.0731 - 222.7723 ± 32.1129
50 Classifiers
VE 0.5217 ± 0.0125 0.7498 ± 0.0170 0.2032 ±0.0380 0.6120 ± 0.0651 - 48.4298 ± 9.0419
Stacking 0.4204 ± 0.0159 0.8777 ± 0.0173 0.2196 ±0.0260 0.1640 ± 0.0381 - 241.4728 ± 45.4116
O-OPFsemble 0.5074 ± 0.0143 0.7822 ± 0.0190 0.2241 ±0.0451 0.5160 ± 0.0641 - 356.3486 ± 45.6728
C-OPFSemble 0.5109 ± 0.0127 0.7563 ± 0.0190 0.2545 ± 0.0467 0.5220 ±0.0575 - 356.9003 ± 46.1672
100 Classifiers
VE 0.5217 ± 0.0151 0.7490 ± 0.0153 0.2420 ±0.0408 0.5740 ± 0.0658 - 104.2654 ± 10.3520
Stacking 0.4173 ± 0.0145 0.8806 ± 0.0157 0.2494 ±0.0270 0.1220 ± 0.0365 - 498.9999 ± 49.9775
O-OPFsemble 0.5138 ± 0.0142 0.7643 ± 0.0199 0.2451 ±0.0428 0.5320 ± 0.0705 - 736.2518 ± 56.6651
C-OPFSemble 0.5169 ± 0.0189 0.7659 ± 0.0246 0.2427 ± 0.0447 0.5420 ±0.0731 - 739.0874 ± 55.8667
posed OPFsemble variant. It is important to note that
the majority voting scheme (VE) was adopted here,
while logistic regression served as the meta-learner
for the stacking approach. Both stacking and the
OPFsemble models underwent a cross-validation pro-
cedure with k = 5 folds to assemble the meta-data
structure. For both OPFsemble models, the mode
strategy was employed to prune the ensemble, retain-
ing only the prototypes of each identified cluster. In
the original OPFsemble, majority voting is performed
as initially done, while the proposed variation utilizes
the weighted majority voting scheme.
3.5 Experimental Setup
Three evaluation measures were selected to assess the
problem addressed in this study: overall accuracy, re-
call, and balanced accuracy. Notably, the latter is par-
ticularly informative for imbalanced data (Brodersen
et al., 2010). These measures were averaged across
25 repetitions with a confidence interval of 95%.
All experiments were conducted on a computer
running Ubuntu 23.10, with an Intel i5-6200U pro-
cessor operating at 2.30 GHz and 8 GB of RAM. For
the implementation, Python 3.11.5 programming lan-
guage was used along with Scikit-Learn 1.2.2 (Buit-
inck et al., 2013). The models XGBoost, LightGBM,
and CatBoost were employed through their respec-
tive libraries, which are available on GitHub. As for
the HPO process, SMA was executed using Mealpy
(Van Thieu and Mirjalili, 2023). Moreover, the orig-
inal OPFsemble implementation
3
, introduced by (Jo-
das et al., 2023), was utilized for running the original
model and also served as the foundation for imple-
menting the proposed variation in this work.
4 RESULTS AND DISCUSSION
Table 2 presents the performance in estimating the in-
ternal decay, and Table 3 depicts the performance in
assessing the risk of falling with the actual internal
decay. In contrast, Table 4 shows the performance
of the tree risk prediction using the predicted decay
categories. Underscored bold values indicate the best
results, while bold values highlight those statistically
equivalent to the best, as determined by the Wilcoxon
signed-rank test at a 5% significance level. Addition-
3
https://github.com/danilojodas/OpfSemble
Optimum-Path Forest Ensembles to Estimate the Internal Decay in Urban Trees
899

Table 3: Model performance in estimating tree risk on the test set.
Model Bal. Accuracy
Recall
HPO Time Training Time
Low Medium High
k-NN 0.4807 ± 0.0169 0.7204 ± 0.0459 0.1757 ± 0.0595 0.5460 ± 0.0239 326.1727 ± 35.7991 0.0161 ± 0.0017
SVM 0.5500 ± 0.0124 0.8371 ± 0.0267 0.0781 ± 0.0410 0.7348 ±0.0260 565.7384 ± 57.6658 1.9611 ± 0.5690
DT 0.5334 ± 0.0183 0.6971 ± 0.0974 0.1915 ±0.1030 0.7117 ± 0.0596 216.7087 ± 15.1173 0.0241 ± 0.0027
RF 0.5047 ± 0.0244 0.7839 ± 0.0453 0.0814 ±0.0365 0.6489 ± 0.0581 388.3234 ± 61.3743 0.3772 ± 0.4499
AdaBoost 0.5614 ± 0.0141 0.8512 ± 0.0335 0.0933 ±0.0571 0.7398 ± 0.0315 351.2116 ± 33.8007 3.1293 ± 1.3173
GBM 0.5336 ± 0.0229 0.7077 ± 0.1135 0.1912 ±0.1119 0.7080 ± 0.0499 974.2177 ± 120.2076 1.5458 ± 1.5962
XGBoost 0.5597 ± 0.0123 0.8668 ± 0.0196 0.0451 ±0.0282 0.7674 ± 0.0253 348.1115 ± 38.7441 0.1804 ± 0.1287
LightGBM 0.5567 ± 0.0112 0.8546 ± 0.0262 0.0693 ±0.0323 0.7461 ± 0.0284 300.6830 ± 30.6808 0.1737 ± 0.1374
CatBoost 0.5471 ± 0.0140 0.8645 ±0.0184 0.0293 ± 0.0278 0.7475 ± 0.0267 407.3290 ± 48.1940 0.6299 ± 0.4430
MLP 0.4969 ± 0.0331 0.7837 ± 0.1214 0.1573 ±0.1160 0.5496 ± 0.0913 1294.3518 ± 172.6889 4.1867 ± 0.7848
10 Classifiers
VE 0.5597 ± 0.0086 0.8881 ± 0.0063 0.0149 ±0.0142 0.7762 ± 0.0199 - 8.5101 ± 1.9049
Stacking 0.5433 ± 0.0170 0.8809 ± 0.0217 0.0819 ±0.0514 0.6670 ± 0.0341 - 46.4687 ± 10.0774
O-OPFsemble 0.5347 ± 0.0177 0.8862 ± 0.0207 0.0747 ±0.0398 0.6432 ± 0.0612 - 70.1944 ± 16.1748
C-OPFSemble 0.5442 ± 0.0167 0.8491 ± 0.0263 0.0780 ± 0.0432 0.7053 ±0.0488 - 67.7508 ± 15.1826
30 Classifiers
VE 0.5633 ± 0.0057 0.8881 ± 0.0067 0.0071 ±0.0100 0.7946 ± 0.0127 - 31.4094 ± 9.1614
Stacking 0.5127 ± 0.0106 0.9067 ± 0.0104 0.0324 ±0.0232 0.5991 ± 0.0247 - 169.9614 ± 47.1210
O-OPFsemble 0.5461 ± 0.0140 0.8745 ± 0.0223 0.0375 ±0.0382 0.7263 ± 0.0238 - 244.7217 ± 51.4847
C-OPFSemble 0.5484 ± 0.0124 0.8631 ± 0.0319 0.0418 ± 0.0349 0.7405 ±0.0213 - 244.3527 ±51.7635
50 Classifiers
VE 0.5662 ± 0.0059 0.8862 ± 0.0059 0.0040 ±0.0081 0.7964 ± 0.0129 - 48.3412 ± 10.7082
Stacking 0.5135 ± 0.0131 0.9170 ± 0.0136 0.0312 ±0.0222 0.5924 ± 0.0317 - 345.5123 ± 170.2362
O-OPFsemble 0.5551 ± 0.0087 0.8737 ± 0.0164 0.0430 ±0.0256 0.7486 ± 0.0217 - 384.3247 ± 56.1124
C-OPFSemble 0.5530 ± 0.0101 0.8722 ± 0.0171 0.0243 ± 0.0217 0.7624 ±0.0203 - 384.6352 ±55.8231
100 Classifiers
VE 0.5630 ± 0.0066 0.8864 ± 0.0055 0.0073 ±0.0103 0.7952 ± 0.0123 - 101.1644 ± 13.8905
Stacking 0.5073 ± 0.0124 0.9201 ± 0.0103 0.0260 ±0.0200 0.5760 ± 0.0352 - 531.5638 ± 68.4328
O-OPFsemble 0.5521 ± 0.0099 0.8748 ± 0.0250 0.0218 ±0.0219 0.7597 ± 0.0178 - 769.9797 ± 60.6182
C-OPFSemble 0.5553 ± 0.0081 0.8798 ± 0.0166 0.0247 ± 0.0224 0.7613 ±0.0192 - 771.4406 ±61.0997
ally, O-OPFsemble refers to OPFsemble with the “or-
acle” strategy, and C-OPFsemble represents OPFsem-
ble with the proposed “count class” strategy. “Bal.”
stands for balanced.
Among the base models, SVM demonstrated the
most balanced performance in estimating internal
trunk decay, while MLP achieved the highest standard
accuracy. Regarding Table 3, AdaBoost showed the
best-balanced accuracy when predicting tree risk with
the actual internal trunk decay category, whereas XG-
Boost exhibited the highest overall accuracy. Finally,
as shown in Table 4, SVM revealed the best balance
in predicting the tree risk using predictions for trunk
decay, while XGBoost yielded the highest accuracy.
Regarding the ensembles, VE achieved the highest
balanced accuracy in predicting internal trunk decay
and the tree risk based on actual internal decay (Ta-
bles 2 and 3). On the other hand, for tree risk predic-
tion using estimated internal decay categories (Table
4), OPFsemble showed the best-balanced accuracy in
ensembles with 30, 50, and 100 classifiers, with our
variant, C-OPFsemble, achieving the highest results
in ensembles with 50 and 100 classifiers.
Despite having fewer models due to pruning,
OPFsemble achieves statistically equivalent balanced
accuracy to VE in specific configurations. However,
OPFsemble outperforms stacking across all cases.
Regarding the OPFsemble variations, C-OPFsemble
delivers results comparable to, or slightly better than,
O-OPFsemble in terms of balanced accuracy across
experiments. Additionally, OPFsemble shows a slight
performance improvement as the number of classi-
fiers increases. Regarding training time, OPFsemble
consistently outperforms stacking but falls short of
VE, likely due to the clustering of ensemble models.
Both variants exhibit similar training times.
Overall, recall for the “medium” class lags signifi-
cantly behind the performance observed for the “low”
and “high” categories, reducing the balanced accu-
racy of both base models and ensemble strategies.
Interestingly, base models perform relatively better
for the “medium” class than ensembles. Among the
ensemble strategies, recall values for the “medium”
class are consistently poorer. Across other metrics,
base models generally produce results comparable to
those of the ensembles, though slightly lower in some
cases. However, base models outperform ensembles
for the “high” class when predicting tree risk using
estimates of internal decay.
The estimates for internal trunk decay are gener-
VISAPP 2025 - 20th International Conference on Computer Vision Theory and Applications
900

Table 4: Model performance in estimating tree risk on the test set using the estimated levels of decay.
Model Balanced Accuracy
Recall
Low Medium High
k-NN 0.4319 ± 0.0221 0.5707 ± 0.0379 0.1766 ± 0.0608 0.5484 ± 0.0505
SVM 0.4629 ± 0.0142 0.7256 ± 0.0304 0.0676 ± 0.0429 0.5957 ± 0.0302
DT 0.4420 ± 0.0140 0.4991 ± 0.0674 0.1265 ± 0.0769 0.7005 ± 0.0383
RF 0.4341 ± 0.0208 0.6899 ± 0.0645 0.0888 ± 0.0486 0.5237 ± 0.0620
AdaBoost 0.4463 ± 0.0196 0.6593 ± 0.0414 0.0550 ± 0.0465 0.6246 ± 0.0700
GBM 0.4046 ± 0.0208 0.5346 ± 0.0891 0.1659 ± 0.0842 0.5131 ± 0.0779
XGBoost 0.4545 ± 0.0123 0.7365 ± 0.0254 0.0341 ± 0.0217 0.5928 ± 0.0502
LightGBM 0.4515 ± 0.0143 0.7014 ± 0.0451 0.0360 ± 0.0329 0.6171 ± 0.0653
CatBoost 0.4527 ± 0.0087 0.6447 ± 0.0194 0.0202 ± 0.0178 0.6932 ± 0.0224
MLP 0.4127 ± 0.0215 0.7227 ± 0.1152 0.1649 ± 0.1138 0.3505 ± 0.0908
10 Classifiers
VE 0.4506 ± 0.0146 0.7304 ± 0.0288 0.0102 ± 0.0146 0.6113 ± 0.0584
Stacking 0.4071 ± 0.0186 0.8103 ± 0.0354 0.0377 ± 0.0350 0.3731 ± 0.0727
O-OPFsemble 0.4170 ± 0.0223 0.7870 ± 0.0429 0.0208 ± 0.0178 0.4432 ± 0.0930
C-OPFSemble 0.4458 ± 0.0212 0.6571 ± 0.0521 0.0533 ± 0.0614 0.6269 ± 0.0582
30 Classifiers
VE 0.4599 ± 0.0080 0.7160 ± 0.0188 0.0071 ± 0.0100 0.6565 ± 0.0243
Stacking 0.3912 ± 0.0163 0.8888 ± 0.0195 0.0400 ± 0.0448 0.2449 ± 0.0416
O-OPFsemble 0.4608 ± 0.0128 0.7422 ± 0.0269 0.0464 ± 0.0340 0.5937 ± 0.0370
C-OPFSemble 0.4570 ± 0.0198 0.6854 ± 0.0404 0.0616 ± 0.0376 0.6241 ± 0.0445
50 Classifiers
VE 0.4531 ± 0.0110 0.7342 ± 0.0240 0.0071 ± 0.0100 0.6180 ± 0.0495
Stacking 0.3934 ± 0.0186 0.8810 ± 0.0220 0.0450 ± 0.0366 0.2541 ± 0.0427
O-OPFsemble 0.4551 ± 0.0141 0.7613 ± 0.0244 0.0240 ± 0.0232 0.5799 ± 0.0464
C-OPFSemble 0.4615 ± 0.0111 0.7282 ± 0.0206 0.0343 ± 0.0261 0.6220 ± 0.0303
100 Classifiers
VE 0.4569 ± 0.0108 0.7237 ± 0.0177 0.0040 ± 0.0081 0.6429 ± 0.0308
Stacking 0.3879 ± 0.0135 0.8832 ± 0.0252 0.0333 ± 0.0277 0.2474 ± 0.0396
O-OPFsemble 0.4614 ± 0.0126 0.7363 ± 0.0237 0.0243 ± 0.0234 0.6234 ± 0.0319
C-OPFSemble 0.4617 ± 0.0118 0.7370 ± 0.0273 0.0383 ± 0.0293 0.6097 ± 0.0379
ally reasonable, given the imbalanced nature of the
dataset. However, upon analysis of Tables 3 and 4, it
becomes evident that the estimated decay categories
lack sufficient reliability to replace the real ones with-
out compromising the tree risk prediction. In addi-
tion, the results of the proposed OPFsemble variation,
C-OPFsemble, were generally similar to or slightly
better than the original O-OPFsemble. Moreover, our
variant offers the advantage of reduced space require-
ments, making it more scalable and, therefore, suit-
able for problems with more extensive training sets.
5 CONCLUSION
The experiments yielded reasonable results in predict-
ing the decay and the tree risk, as measured by the
evaluation metrics. However, the techniques strug-
gled with the “medium” class in all tasks. Gener-
ally, albeit slightly, ensemble strategies outperformed
base models across all classification tasks. Based on
balanced accuracy, SVM and AdaBoost stand out in
the three classification tasks. Among ensemble strate-
gies, VE stands out from other methods in most cases.
Meanwhile, OPFsemble excelled in predicting risk
using estimated decays and showed statistical equiva-
lence to VE in other tasks despite using fewer models
due to pruning. Additionally, OPFsemble consistently
outperformed stacking regarding balanced accuracy
and executed faster in all cases. The proposed vari-
ant, C-OPFsemble, delivered results comparable to or
slightly better than O-OPFsemble across experiments
while maintaining a similar execution speed.
The experiments yielded reasonable results in pre-
dicting the decay and the tree risk, as measured by the
evaluation metrics. However, the techniques strug-
gled with the “medium” class in all tasks. Gener-
ally, albeit slightly, ensemble strategies outperformed
base models across all classification tasks. Based on
balanced accuracy, SVM and AdaBoost stand out in
the three classification tasks. Among ensemble strate-
gies, VE stands out from other methods in most cases.
Optimum-Path Forest Ensembles to Estimate the Internal Decay in Urban Trees
901

Meanwhile, OPFsemble excelled in predicting risk
using estimated decays and showed statistical equiva-
lence to VE in other tasks despite using fewer models
due to pruning. Additionally, OPFsemble consistently
outperformed stacking regarding balanced accuracy
and executed faster in all cases. The proposed vari-
ant, C-OPFsemble, delivered results comparable to or
slightly better than O-OPFsemble across experiments
while maintaining a similar execution speed.
Regardless, the estimates of internal decay proved
unreliable for practical use in estimating tree risk, re-
sulting in lower balanced accuracies. Enhancing the
quality of these estimates is crucial to effectively de-
ploying the proposed method in real-world scenarios.
Future research will focus on refining the strategy by:
i) incorporating additional attributes, which could en-
hance tree representation and help models identify
new patterns related to internal trunk decay; and ii)
adding new samples to address data imbalances and
improve class representation, as current models tend
to learn more from the majority class (low decay).
ACKNOWLEDGEMENTS
This study was financed, in part, by the S
˜
ao Paulo Re-
search Foundation (FAPESP), Brasil, under process
numbers #2022/16562-7 and #2023/12830-0, and by
the Coordenac¸
˜
ao de Aperfeic¸oamento de Pessoal de
N
´
ıvel Superior - Brasil (CAPES). The authors also ac-
knowledge support from the FUNDUNESP/Petrobras
grant 3070/2019. Lastly, the authors thank IPT for
providing the urban tree data used in this study.
REFERENCES
Brodersen, K. H., Ong, C. S., Stephan, K. E., and Buhmann,
J. M. (2010). The balanced accuracy and its posterior
distribution. In Proceedings of the 2010 20th Interna-
tional Conference on Pattern Recognition, ICPR ’10,
page 3121–3124, USA. IEEE Computer Society.
Buitinck, L., Louppe, G., Blondel, M., Pedregosa, F.,
Mueller, A., Grisel, O., Niculae, V., Prettenhofer, P.,
Gramfort, A., Grobler, J., Layton, R., VanderPlas, J.,
Joly, A., Holt, B., and Varoquaux, G. (2013). API de-
sign for machine learning software: experiences from
the scikit-learn project. In ECML PKDD Workshop:
Languages for Data Mining and Machine Learning,
pages 108–122.
Chawla, N. V., Bowyer, K. W., Hall, L. O., and Kegelmeyer,
W. P. (2002). Smote: Synthetic minority over-
sampling technique. J. Artif. Int. Res., 16(1):321–357.
Espinosa, L., Arciniegas, A., Cortes, Y., Prieto, F., and
Brancheriau, L. (2017). Automatic segmentation of
acoustic tomography images for the measurement of
wood decay. Wood Science and Technology, 51(1):69–
84.
Jodas, D. S., Passos, L. A., Rodrigues, D., Lucas, T. J.,
Da Costa, K. A. P., and Papa, J. P. (2023). Opfsem-
ble: An ensemble pruning approach via optimum-path
forest. In 2023 30th International Conference on Sys-
tems, Signals and Image Processing (IWSSIP), pages
1–5.
Lavall
´
ee, A. and Lortie, M. (1968). Relationships between
external features and trunk rot in living yellow birch.
The Forestry Chronicle, 44(2):5–10.
Li, S., Chen, H., Wang, M., Heidari, A. A., and Mirjalili,
S. (2020). Slime mould algorithm: A new method for
stochastic optimization. Future Generation Computer
Systems, 111:300–323.
Nielsen, A. B.,
¨
Ostberg, J., and Delshammar, T. (2014).
Review of urban tree inventory methods used to col-
lect data at single-tree level. Arboriculture & Urban
Forestry, 40(2).
Rocha, L. M., Cappabianco, F. A. M., and Falc
˜
ao, A. X.
(2009). Data clustering as an optimum-path forest
problem with applications in image analysis. Inter-
national Journal of Imaging Systems and Technology,
19(2):50–68.
Roman, L. A., Conway, T. M., Eisenman, T. S., Koeser,
A. K., Ord
´
o
˜
nez Barona, C., Locke, D. H., Jenerette,
G. D.,
¨
Ostberg, J., and Vogt, J. (2021). Beyond ‘trees
are good’: Disservices, management costs, and trade-
offs in urban forestry. Ambio, 50(3):615–630.
van Haaften, M., Liu, Y., Wang, Y., Zhang, Y., Gardebroek,
C., Heijman, W., and Meuwissen, M. (2021). Under-
standing tree failure—a systematic review and meta-
analysis. PLOS ONE, 16(2):1–23.
Van Thieu, N. and Mirjalili, S. (2023). Mealpy: An open-
source library for latest meta-heuristic algorithms in
python. Journal of Systems Architecture, 139:102871.
Zheng, A. and Casari, A. (2018). Feature Engineering for
Machine Learning. O’Reilly Media, Sebastopol, CA.
Zhu, L., Kim, S.-J., Hara, M., and Aono, M. (2018). Re-
markable problem-solving ability of unicellular amoe-
boid organism and its mechanism. Royal Society Open
Science, 5(12):180396.
VISAPP 2025 - 20th International Conference on Computer Vision Theory and Applications
902
