
Enhancing Image Quality to Improve Medical Image Classification:
Application to Nuclear Medicine Planar Images
Ouassim Boukhennoufa
1 a
, Laurent Comas
2,3 b
, Jean-Marc Nicod
1 c
,
Noureddine Zerhouni
1 d
and Hatem Boulahdour
2,3 e
1
SUPMICROTECH, CNRS, Institut FEMTO-ST, F-25000, Besanc¸on, France
2
CHU Besanc¸on, M
´
edecine Nucl
´
eaire, F-25000, Besanc¸on, France
3
Universit
´
e de Franche-Comt
´
e, SINERGIES, F-25000, Besanc¸on, France
ouassim.boukhennoufa@univ-fcomte.fr, lcomas@chu-besancon.fr, {jean-marc.nicod, Noureddine.Zerhouni}@ens2m.fr,
Keywords:
Image Quality Enhancement, Artificial Intelligence, Nuclear Medicine, Medical Imaging, Parathyroid Glands.
Abstract:
Nuclear Medicine images are obtained by injecting small amounts of radio-tracers into the body to track
specific organs. Particular cameras detect radiations emitted from the radio-tracers resulting in images that
visualize the function of the organs rather than their structure. The association of the cameras and radio-
tracers causes low resolution and low signal-to-noise ratio, therefore, the images are often of poor quality.
Image Quality Enhancement (IQE) is one possible solution to this problem as it improves the clarity of the
images by removing noise and correcting distortions. In this paper, we propose a methodology based on
artificial intelligence (AI) with the integration of an IQE step for the detection of normal/abnormal parathyroid
glands. Two different IQE techniques are employed, one based on a statistical filter and the other on AI.
The enhanced images are processed with a Convolutional Neural Network (CNN), and Lasso regression for
features extraction and selection. Finally, several AI models are used for binary image classification. The
obtained results achieved an accuracy of 83% in distinguishing normal/abnormal parathyroid glands. IQE step
significantly improves the accuracy of the AI model by 16.9% over the initial accuracy of 71%, demonstrating
the importance of IQE in assessing image classification performance.
1 INTRODUCTION
HyperParaThyroidism (HPT), is a prevalent en-
docrine disorder typified by elevated or anoma-
lous parathyroid hormone levels and hypercal-
cemia (Walker and Silverberg, 2018). HPT
can impact one or more Parathyroid Glands
(PGs) (Bilezikian et al., 2016). PGs are typi-
cally 3-5 mm in size, and conventional imaging
methods are unable to detect them (Sung, 2015). To
give an accurate diagnosis, physicians refer to clinical
data, Nuclear Medicine (NM) images, but also other
image modalities such as ultrasonography (Khan
et al., 2017). There are limitations in some image
modalities such as ultrasound to locate very small
a
https://orcid.org/0000-0002-9193-9552
b
https://orcid.org/0009-0008-9338-7529
c
https://orcid.org/0000-0001-9521-6215
d
https://orcid.org/0000-0002-8847-3202
e
https://orcid.org/0000-0001-5834-5720
PGs (Lee et al., 2021).
Nuclear medicine (NM) is one remedy to this is-
sue and improve the accuracy of physicians’ diag-
noses. NM is a field of medicine that uses radio-
pharmaceuticals to diagnose and evaluate the func-
tioning of the body (Nieciecki et al., 2015). In NM,
several image acquisition techniques exist for PGs
detection in NM, double isotope and double phase
are the most common. The first involves the injec-
tion of two isotopes, followed by image acquisition,
while the second implicates the injection of one iso-
tope followed by two time-domain acquisitions (Pe-
tranovi
´
c Ov
ˇ
cari
ˇ
cek et al., 2021). In the case of double
isotope, physicians proceed with image subtraction
after normalization to obtain an image with only PGs
for diagnosis (Tlili et al., 2023) (Petranovi
´
c Ov
ˇ
cari
ˇ
cek
et al., 2021).
The problem with NM images is the limitation
of the information as they are very weak in signal,
therefore, the images are highly noisy (Kim et al.,
2020). Researchers developed different medical as-
Boukhennoufa, O., Comas, L., Nicod, J.-M., Zerhouni, N. and Boulahdour, H.
Enhancing Image Quality to Improve Medical Image Classification: Application to Nuclear Medicine Planar Images.
DOI: 10.5220/0013113800003911
Paper published under CC license (CC BY-NC-ND 4.0)
In Proceedings of the 18th International Joint Conference on Biomedical Engineering Systems and Technologies (BIOSTEC 2025) - Volume 1, pages 303-310
ISBN: 978-989-758-731-3; ISSN: 2184-4305
Proceedings Copyright © 2025 by SCITEPRESS – Science and Technology Publications, Lda.
303

sistance tools based on Deep Learning (DL) to assist
physicians in their diagnosis even if the related works
remain limited. The study in (Yoshida et al., 2022)
proposed a transfer learning methodology by apply-
ing a pre-trained RetinaNet (Lin et al., 2017) model
to dual-phase
99m
Tc-sestamibi images. The work in-
cluded 281 patients with confirmed HPT, distributed
as 92 for training, 45 for validation, and 44 for testing.
The model achieved a sensitivity of 82% and a mean
false positive indication of 0.44.
The authors in (Boukhennoufa et al., 2024) devel-
oped a medical assistance tool to automatically sub-
tract the dual isotope
99m
Tc-sestamibi and
123
I im-
ages. The methodology consisted of combining the
images with statistical features such as kurtosis and
entropy extracted from each image. The images were
normalized and processed with a CNN model for fea-
ture extraction, whereas the statistical features were
processed with a random forest model for the same
objective as with the images. The combination of the
extracted features was processed with a support vector
machine to predict a subtraction factor that was used
to compute a subtracted image. The results yielded to
a mean correlation of 0.95 with the reference images
(performed by physicians).
At the preoperative level with
99m
Tc-sestamibi
single-photon emission computed tomography, the
study (Sandqvist et al., 2022) proposed to predict
the presence of overlooked parathyroid hormone us-
ing six predictors such as calcium level and parathy-
roid hormone. The data were extracted from 349 pa-
tients with confirmed primary HPT or multi-glandular
disease, and a decision tree with Bayesian hyperpa-
rameter optimization methodology was employed for
the classification purpose. A 5-Fold cross-validation
technique was used, where it achieved a true-positive
prediction rate of 72% for multi-glandular cases and a
misclassification rate of 6% for primary HPT patients.
In another study using clinical data (Samaras
et al., 2024), the objective was to distinguish patients
with primary HPT and Multi-Glandular Disease with
an explainable machine learning methodology. The
data were extracted from 134 patients and were highly
imbalanced: 26 patients with MGD, and the rest with
primary HPT, this issue was solved randomly by over-
sampling the MGD class. The used data were gender,
age, size of the abnormal gland, number of affected
glands, and multiplication of the parathyroid hormone
with the calcium level in blood. A benchmarking of
several ML algorithms such as LightGBM and sup-
port vector machine was proposed with a SHAP ex-
plainability methodology. The reported results indi-
cated that the oversampling methodology contributed
to assessing the specificity from 66.67% to 81.48%.
The different works showed promising results in
HPT diagnosis using different types of data. Never-
theless, the problem of noisy images is still not yet
addressed. One remedy is to apply Image Quality En-
hancement (IQE): an important step to improve the
precision of DL models. IQE consists of removing
noise and improving the brightness of images to high-
light important features (Bhardwaj et al., 2018). To
the best of our knowledge, there is no other study in-
cluding an IQE step for PGs detection.
In this paper, we propose a new process for nor-
mal/abnormal PGs detection by applying two IQE
techniques on only dual-isotope static images. The
first employs a statistical filter approach, while the
second is based on AI. The filtered images are passed
into a DL model and a Lasso regression for feature ex-
traction and selection. Finally, AI models are bench-
marked for image classification.
The remainder of the paper is organized as fol-
lows: Section 2 details the used data and the proposed
methodology. Section 3 presents and discusses the
results of the proposed approach. The work is con-
cluded in Section 4.
2 MATERIALS AND METHODS
In this section, the patient’s demographics, the used
data, and the proposed methodology are explained.
2.1 Patients and Data Characteristics
Between June 2012 and December 2023, 923 pa-
tients underwent dual isotope (
99m
Tc-sestamibi/
123
I)
planar scintigraphy. The acquisitions were realized
on a Discovery NMCT 670 or an Infina GE Health-
care. First, 18.5 MBq +-10% of
123
I was adminis-
tered intravenously. 3h later, 740 MBq +/- 10% of
99m
Tc-sestamibi was injected. 5 min later, the acquisi-
tion started with planar imaging of the thyroid region
(PINHOLE) for 10 min and mediastinum Low Energy
High Resolution (LEHR) for 5 min (dual isotope set-
ting with photopeak’s centered over 140,5 keV +/-
7,5% and 159 keV -5% + 10% window for
99m
Tc-
sestamibi and
123
I, respectively). A subtraction of the
two PINHOLE images is performed using XELERIS
Software by the physicians. They begin by extract-
ing the thyroid from the
123
I image, which is merged
with the
99m
Tc-sestamibi image. Next, the images
are normalized according to the thyroid intensity in
both images. This ensures that both images are uni-
formly scaled. The subtraction is performed and ad-
justed then between the two normalized images (Tlili
et al., 2023). This results in a Subtracted Image (SI),
BIOIMAGING 2025 - 12th International Conference on Bioimaging
304
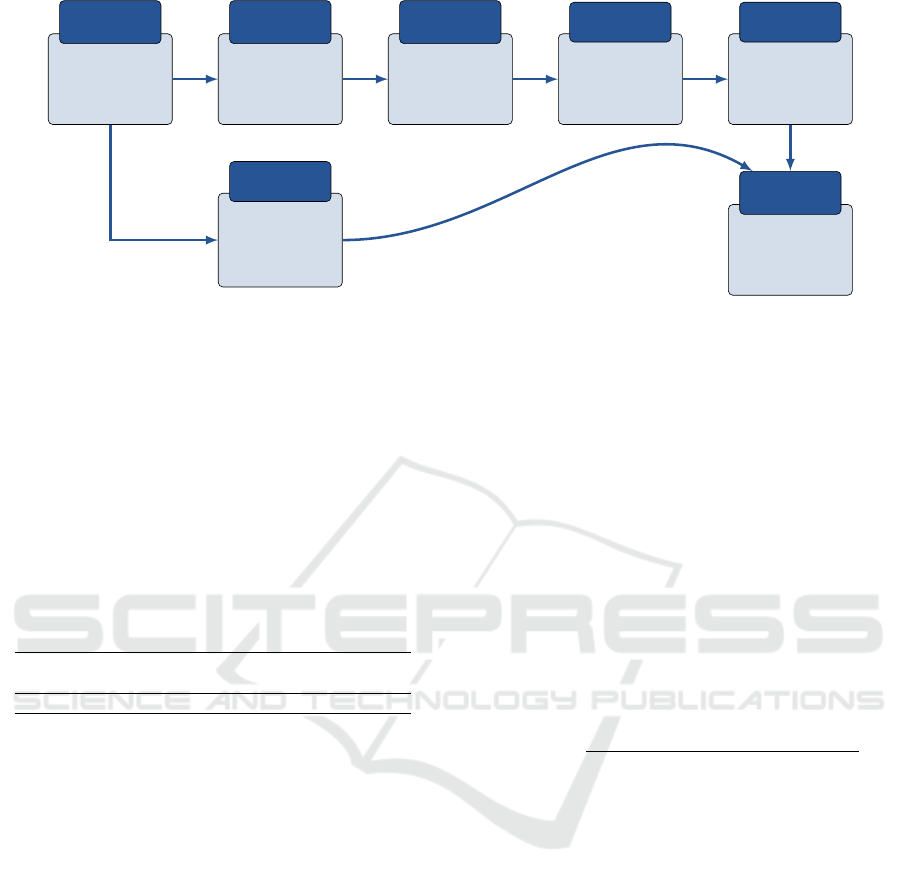
Raw Images
Input
Images
Image
normalization
Image pre-
processing
Image Quality
Enhancement
Image
processing
Convolutional
Neural Network
Feature
Extraction
Lasso regression
Feature
selection
Normal/abnormal
glands detection
AI
modeling
• Kurtosis
• Mean
• Std
• Entropy
Statistical
Features
Figure 1: Overview of the proposed methodology.
used by the physicians to identify abnormal PGs.
Due to the absence of images in the Picture
Archive and Communication Systems, scintigraphy
with no thyroid fixation in some cases, and cases
judged doubtful case by physicians, 215 patients were
removed. The characteristics are summarized in Ta-
ble 1. In this study, 5 images per patient are used:
LEHR of
99m
Tc-sestamibi and
123
I, PINHOLE of
99m
Tc-sestamibi and
123
I, and the Subtracted Image.
The image size is 128 × 128 pixels with a grayscale
channel.
Table 1: Patient’s characteristics summary.
Patients Age Gender Weight Height
number range F:M range range
708 [18 − 99] 601:222 [40 − 167] [143 − 189]
2.2 Proposed Methodology
Figure 1 highlights the overall process of the proposed
methodology, starting with raw images as inputs to
the AI modeling where the objective is to detect ab-
normal PGs.
From raw images, statistical features are extracted
and are used later in the process: kurtosis, mean pixel
value, standard deviation, and entropy. The objective
of these features is to help the AI model in PGs di-
agnosis. These characteristics can help the model un-
derstand extracting patterns between images of nor-
mal/abnormal PGs cases. For instance, in the im-
ages of abnormal glands, the mean pixel value may
be larger than in normal glands. Also, since the quan-
tity of used data is not very high, adding these features
means adding more data, hence, enlarging the popu-
lation. The next step of the methodology consists of
image normalization, as explained in Subsection 2.1,
the normalization performed by physicians is one im-
portant step in order to subtract the images. Also, in
the AI pipeline, image normalization is a very impor-
tant step to increase performance and speed up the
learning convergence. For these reasons, the images
in this study are normalized using the MinMax nor-
malization method (Zhang et al., 2024). Specifically,
each image type is normalized globally, meaning that
the images are scaled in function of the minimum and
maximum pixel values of the whole dataset. For ex-
ample, in LEHR
99m
Tc-sestamibi of each patient, the
images are normalized with the minimum and max-
imum pixel values of all the LEHR
99m
Tc-sestamibi
images. This ensures that the images are normalized
uniformly and the characteristics of all the data are
taken into account. Equation 1 represents the nor-
malization, where NI, RI, t, n represents Normalized
Image, Raw Image, one of the image types, and the
number of patients, respectively.
NI
MinMax
=
RI
t
− min(RI
1
, ...RI
n
)
max(RI
1
, ...RI
n
) − min(RI
1
, ...RI
n
)
(1)
The second step of the process is about enhancing
the quality of images, once the images are normal-
ized, they’re processed with two different techniques
and compared differently according to the diagnosis
results. The first is based on a statistical filter called
Non-Local Means Denoising (NLMD) (Buades et al.,
2011). The latter is an image processing technique for
IQE, it reduces the noise by averaging similar pixels
throughout the whole image. In opposition to other
statistical filters that consider only neighborhood pix-
els, NLMD locates patches of pixels with similar pat-
terns across all the images. These patterns are used to
remove noise more effectively, but also preserve the
details of the images. NLMD is a form of segmen-
tation as it merges the pixels with similar characteris-
tics into patches. NLMD computes the denoised pixel
value by using a weighted average of all the image
pixels as shown in Equation 2. Where i and j are po-
sitions of the pixel values.
ˆ
P, P are the denoised pixel
value at position i, original pixel value at position j,
Enhancing Image Quality to Improve Medical Image Classification: Application to Nuclear Medicine Planar Images
305
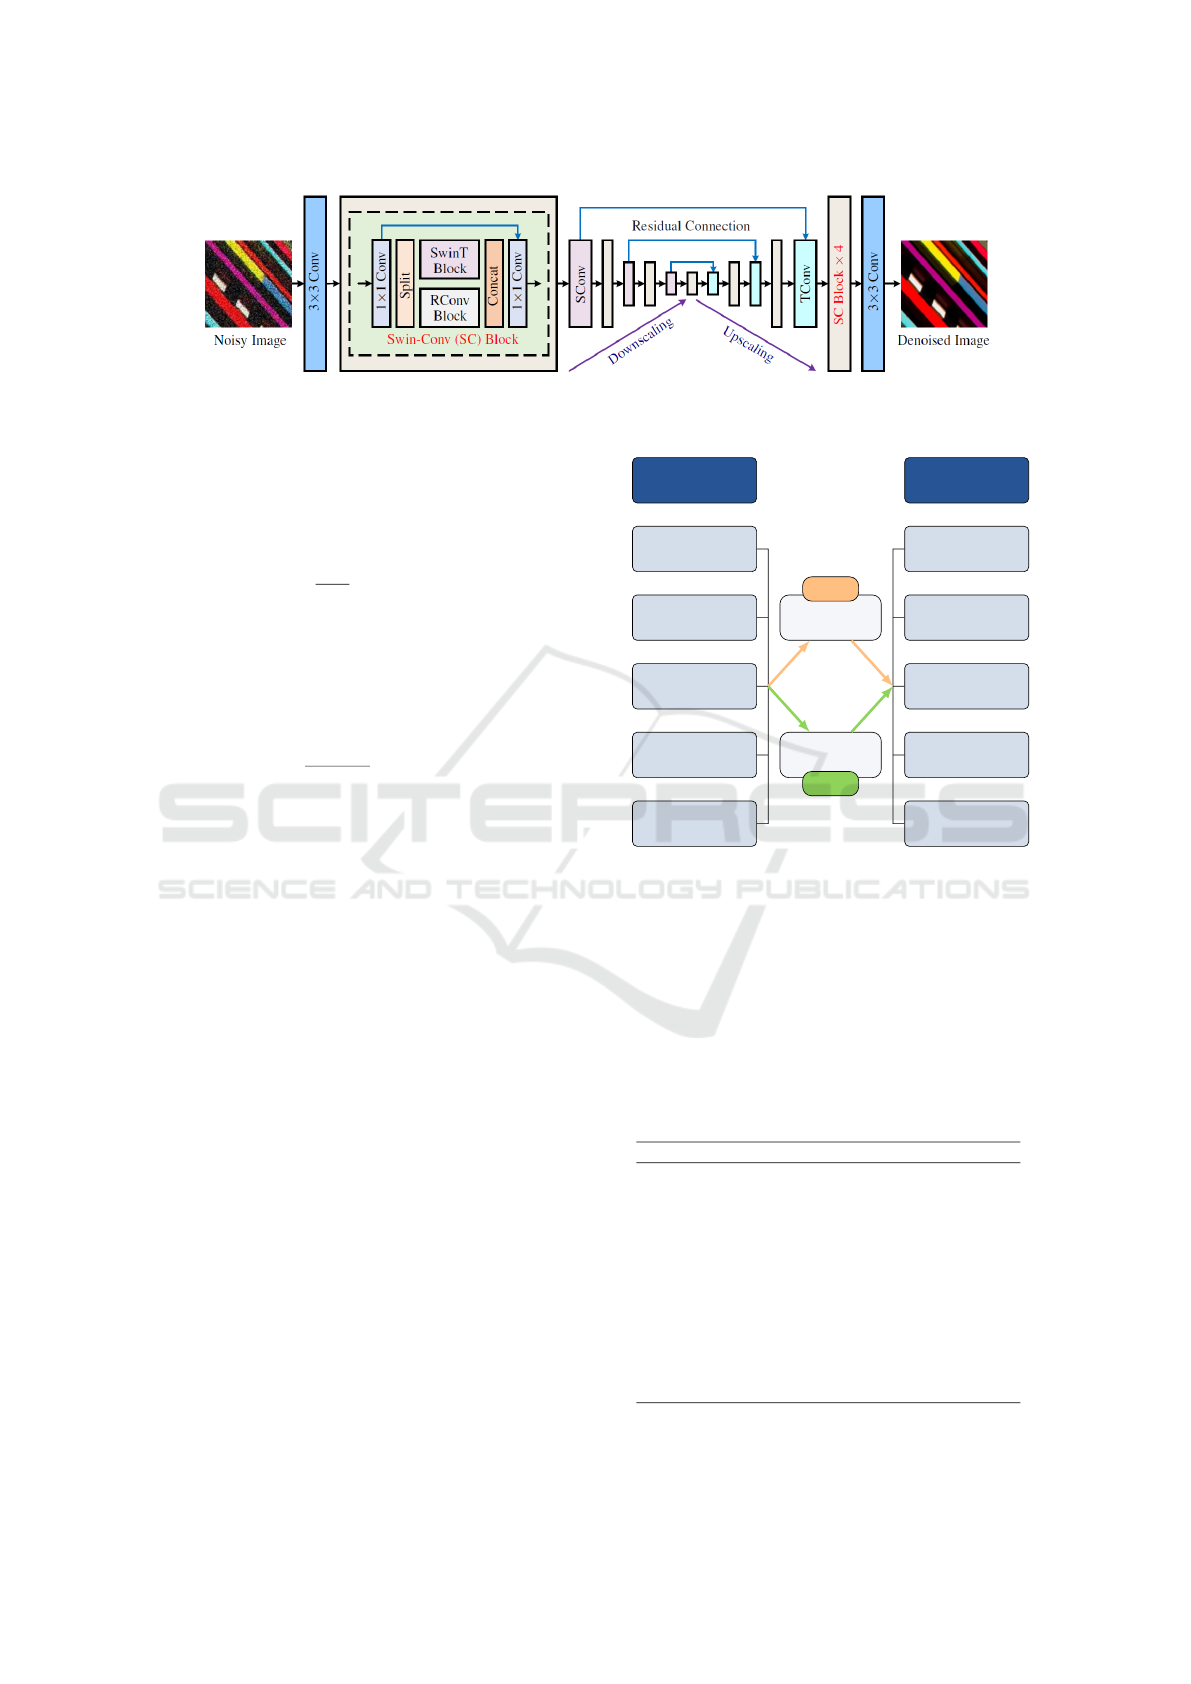
Figure 2: SCUNet architecture from (Zhang et al., 2023). Licensed under a Creative Commons Attribution 4.0 International
License (CC BY 4.0). No modifications were made.
respectively. w is the similarity weight between pixels
at position i and j. Finally, C represents a normaliza-
tion factor ensuring that weight sum to 1 shown in
Equation3.
ˆ
P(i) =
1
C(i)
∑
j
w(i, j)P( j) (2)
The weights are computed with an Euclidean distance
as represented in Equation 3, where I(i) and I( j) are
patches centered around i and j. A filtering parameter
h is used to control the degree of smoothing, defined
as 0.8 in this study.
w(i, j) = e
−
∥
I(i)−I( j)
∥
2
h
2
, C(i) =
∑
j
w(i, j) (3)
NLMD ensures that pixels similar to one in the posi-
tion i contribute more to its denoising value, reduc-
ing noise while preserving important details. For all
these reasons, NLMD is chosen in this work. The sec-
ond IQE technique is based on AI using a Swin-Conv-
UNet (SCUNet) denoising network. It is a combina-
tion of Swin transformers, Convolution Neural Net-
work (CNN), and U-NET model. A Swin-Conv (SC)
block is used as the main backbone of the U-NET
model (Zhang et al., 2023). SCUNet performs in a
segmentation way where it groups patches of similar
patterns. To the best of our knowledge, it is the state-
of-the-art image denoising model. For these reasons,
it is used in this study to provide a fair comparison
with NLMD as they both perform with the patch prin-
ciple. Figure 2 details the architecture of the SCUNet
model. The images are first passed to a convolution
filter of size 3, followed by the SC block, the U-NET
model with residual connections, and finally, another
SC block and a convolution filter of size 3 to recon-
struct the denoised image.
The IQE methodologies are summarized in Fig-
ure 3 where IQE1 and IQE2 represent the NLMD
and SCUNet techniques, respectively. The two IQEs
are used separately for the five different images
(PINHOLES
99m
Tc-sestamibi,
123
I, and subtracted),
(LEHR
99m
Tc-sestamibi and
123
I).
Input Images
Lehr
99m
Tc-sestamibi
Lehr
123
I
Pinhole
99m
Tc-sestamibi
Pinhole
123
I
Pinhole
Subtracted
Filtered Images
Lehr
99m
Tc-sestamibi
Lehr
123
I
Pinhole
99m
Tc-sestamibi
Pinhole
123
I
Pinhole
Subtracted
Statistical
filter
IQE 1
Artificial
intelligence
IQE 2
Figure 3: Image Quality Enhancement process.
In the third step of the process and once the im-
ages are processed for IQE, a CNN is used for fea-
ture extraction, to decrease the size of the images and
preserve only the important features for further pro-
cessing. After a series of trials, the architecture in
Table 2 was found to be the best performing one for
the diagnosis purpose. The input layer is of shape
128 × 128 × 1 = 16384 features.
Table 2: CNN architecture for feature extraction.
Layer Hyperparameters
Conv2D - 32 filters of size 3,
relu function
MaxPooling2D - filter size of 2
Conv2D - 64 filters of size 3,
relu function
Batch Normalization /
MaxPooling2D - filter size of 2
Conv2D - 128 filters of size 3,
relu function
MaxPooling2D - filter size of 2
GlobalAveragePooling2D /
Dense 128 nodes, relu function
The fourth step of the methodology consists of ap-
BIOIMAGING 2025 - 12th International Conference on Bioimaging
306

plying the Least Absolute Shrinkage and Selection
Operator (Lasso) regression (Tibshirani, 1996) for
feature selection before feeding them to AI models for
classification. Lasso is a form of linear regression that
aims to reduce and remove non-relevant/redundant
features to avoid over-fitting. This is achieved by
shrinking some features to zero, leaving only the most
important ones. Lasso prevents over-fitting problems
and can do both feature selection and regularization,
which leads to more generalized models. A pair
of features with corresponding labels (0 for normal
glands and 1 for abnormal). The objective is to min-
imize the function represented in Equation (4). y is
the label, X are the features, β a coefficient for each
feature, n the number of patients, f the total number
of features.
minimize
n
∑
k=1
y
i
−
f
∑
z=1
X
kz
β
j
!
2
+ λ
f
∑
z=1
|
β
z
|
(4)
Lasso is a modified version of linear regression by
the addition of the penalty term λ
∑
f
z=1
|
β
z
|
that helps
the model in the generalization process and avoids
over-fitting.
The last step of the process consists of concate-
nating the statistical features extracted at the begin-
ning from the raw images and the features resulting
from the Lasso regression into a single matrix that is
used for binary classification. The latter is achieved
by benchmarking several Machine Learning (ML) al-
gorithms. The training is consolidated with a 10-Fold
cross-validation technique. The data are divided into
10 folds, for 10 iterations, 9 folds are used for the
model training and 1 fold for validation. This ensures
that all the data are used at least one time for training
and once for testing, it also reduces the variance in the
performance providing trustful results, more reliable
model evaluation, and a robust model.
With this proposed methodology, it is ensured that
only important features from the enhanced images are
used with an addition of the statistical information to
enrich the training of the ML models with the objec-
tive of improving the diagnosis. Also, the quantity of
data is not very high, for these reasons, the choice of
ML models for image classification is evident.
3 RESULTS AND DISCUSSIONS
In this section, the results of the proposed methodolo-
gies are detailed with discussions.
3.1 Image Quality Enhancement
In order to evaluate the IQE techniques, the two most
common metrics for such tasks are employed: Peak
Signal-to-Noise Ratio (PSNR), and Structural Simi-
larity Index Measure(SSIM). Both metrics are used
to evaluate the image-denoising, PSNR measures the
quality of a denoised/reconstructed image compared
to the original. A value higher than 30dB indicates
a high image quality enhancement, whereas a lower
value expresses a lower IQE. SSIM measures the sim-
ilarity between two images by comparing the lumi-
nance, contrast, and structure. Its values range be-
tween [0 − 1], from poor quality to very high quality.
Table 3 shows the obtained results applying the two
metrics on the used data, the values are the mean
across the whole data with the 5 different image types.
Table 3: Performance evaluation of IQE techniques. P:
PINHOLE, L: LEHR.
Image type
IQE
technique
PSNR SSIM
P.
99m
Tc-sestamibi
IQE1 38.54 0.98
IQE2 32.65 0.91
P.
123
I
IQE1 37.46 0.97
IQE2 31.52 0.79
Subtracted P.
IQE1 37.85 0.97
IQE2 32.42 0.85
L.
99m
Tc-sestamibi
IQE1 39.44 0.98
IQE2 33.47 0.92
L.
123
I
IQE1 39.52 0.98
IQE2 30.65 0.75
The results report a dominance using IQE1 (sta-
tistical filter-based method), in comparison to IQE2
(AI-based method). The filter-based methodologies
are simpler and designed especially for special tasks,
image denoising in this context, making them highly
effective for IQE purposes. Another reason is that fil-
ters apply a fixed set of operations and treat the im-
ages individually according to their local characteris-
tics which leads to reliable results. On the other hand,
AI-based methodologies for IQE are more complex
and require a large amount of data, which leads to the
non-generalization of new data. Finally, the dataset is
very limited in terms of size which led to the SCUNet
model not performing well compared to NLMD. AI-
based techniques may capture information that isn’t
caught by traditional filters, but for this specific task
in this work, NLMD is more performant as the goal
is to enhance the image quality, while features (infor-
mation) are extracted later in the process.
An example application of the two IQEs (NLMD
and SCUNet) on two random subtracted PINHOLES
of two patients is shown in Figure 4. NLMD effec-
tively reduces the noise and enhances the key regions
Enhancing Image Quality to Improve Medical Image Classification: Application to Nuclear Medicine Planar Images
307
(indicated in circles) with arrows in the original im-
ages while maintaining the important structures such
as the edges of the images, also in terms of metrics
it achieved PSNR of 37.25, and 38.19, respectively in
the two cases. On the other hand, the application of
the SCUNet (IQE2) filter in the same two cases re-
ports a decrease in the PSNR and SSIM with 4.1 and
0.07, respectively. It results in partial noise removal
without completely reducing it. Important structures,
such as edges, were slightly modified, resulting in a
loss of information that could affect the performance
of ML models in terms of accurate image classifica-
tion.
In summary, with IQE1 the noise is removed from im-
ages without modifying the structures which is the ob-
jective of the use case in this study. NLMD (IQE1) is
selected over SCUNet (IQE2) for the next steps and
the rest of the process.
3.2 Image Classification
The images are processed with IQE1, and fed to the
CNN for feature extraction and Lasso regression for
feature selection. A benchmarking of ML models
for binary classification (normal/abnormal PGs de-
tection) is applied. The images are associated with
the extracted statistical features explained in Subsec-
tion 2.2. The corresponding labels are divided into
472 positive (abnormal), and 236 negative (normal).
The imbalanced data problem is solved by reducing
the number of positive cases to 250. As a result, 250
positive and 236 negative cases are used to benchmark
the ML models. The remaining positive cases aren’t
discarded as they’re used in the test phase.
Table 4 reports the results with different ML models
with various metrics: Accuracy, Area Under Curve,
and Recall. The best-performing model is presented
in each image type with the mean values reported by
10-Fold cross-validation. The results clearly show
that PINHOLE images outperform LEHR images.
This was expected since physicians primarily rely on
the PINHOLE images for the diagnosis.
Table 4: Classification results with IQE1. P: PINHOLE, L:
LEHR.
Image type Model Acc AUC Recall
P.
99m
Tc-sestamibi LGBM 77% 74% 73%
P.
123
I RF 75% 71% 71%
Subtracted P. LGBM 81% 80% 80%
L.
99m
Tc-sestamibi SVM 67% 66% 67%
L.
123
I SVM 65% 65% 63%
Combined P. LGBM 83% 83% 81%
The combination of the 3 PINHOLE images im-
proves the performance by 2.47%. This suggests that
using multiple images provides integral information,
which increases the model’s ability to make more ac-
curate classifications.
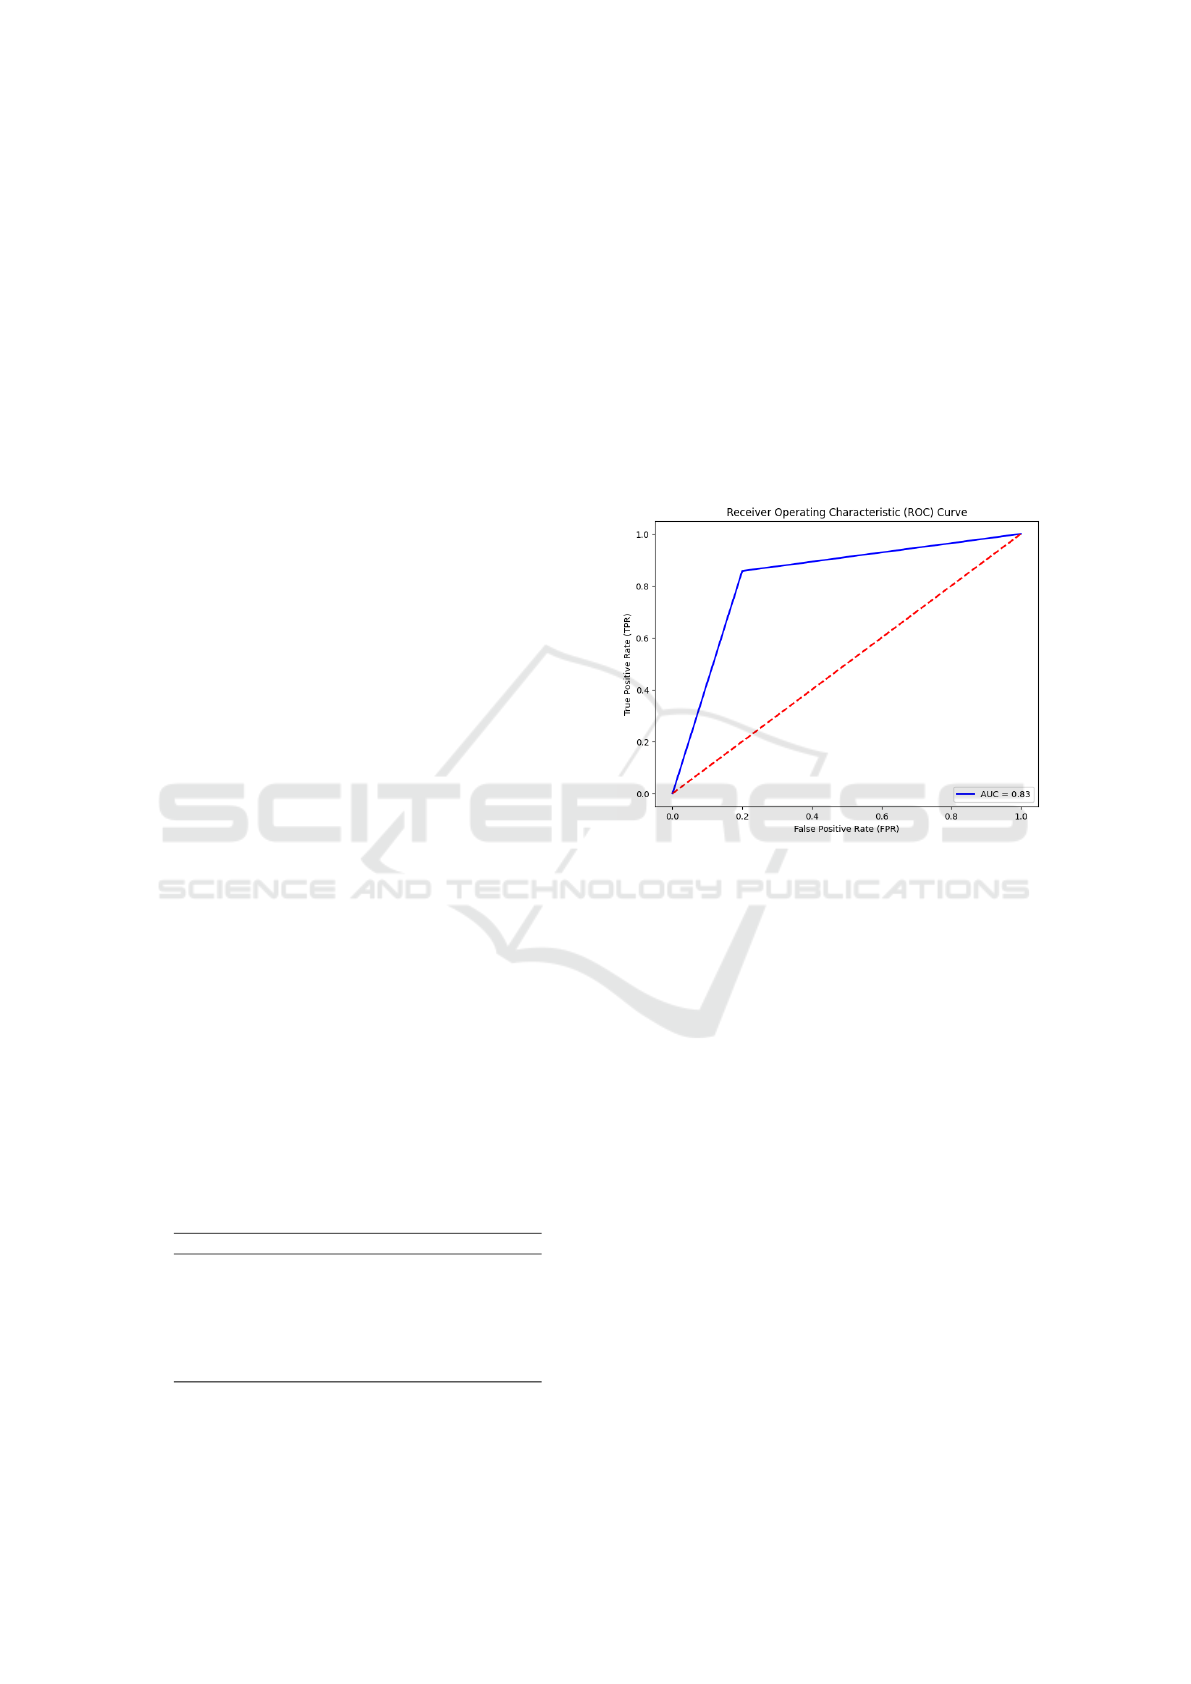
To study the ability of the model to distinguish
between the normal and abnormal classes, an AUC
metric was used that gave different results in Ta-
ble 4. A Receiver Operating Characteristic (ROC)
curve with the combination of the 3 PINHOLE im-
ages using LGBM is presented in Figure 5. The corre-
sponding AUC is 0.83 (83%) which expresses a good-
performing model indicating the high ability to dif-
ferentiate between the two classes, meaning that the
model does not tend to a particular class.
Figure 5: ROC curve with the test data.
The results are good, but there is still room for
improvement. A perfect AUC should be 1.0 (100%),
further future works needs to be oriented in a way to
improve this value by increasing the size of the dataset
if available, or AI model improvement.
3.3 Ablation Study
To study the impact of IQE1 on image classification
with the different ML models, an ablation study is
performed. To achieve this, the proposed approach
was repeated without the image processing (IQE1)
step. The aim is to evaluate the contribution of
IQE1 to the global methodology, and whether the per-
formance increases or not. The obtained results as
highlighted in Table 5 show a significant decrease in
the performance, for example, using combined PIN-
HOLES, the accuracy dropped by 14.4% compared to
the methodology with IQE1 application. This signif-
icant decrease in accuracy emphasizes the important
role of IQE1 in assessing image classification perfor-
mance. IQE1 improves image quality by removing
noise and highlighting darker regions, this improves
the relevance and details of images. By doing so, the
BIOIMAGING 2025 - 12th International Conference on Bioimaging
308
IQE1 (NLMD) IQE2 (SCUNet)Original
PSNR: 33.15
SSIM: 0,9
PSNR: 34.69
SSIM: 0,9
PSNR: 37,25
SSIM: 0,97
PSNR: 38.19
SSIM: 0,98
IQE1 (NLMD) IQE2 (SCUNet)Original
Figure 4: Example application of NLMD and SCUNet on subtracted PINHOLE.
ML models focus more on the key features in the im-
ages, resulting in improved performance.
Table 5: Classification results with IQE1. P: PINHOLE, L:
LEHR.
Image type Model Acc AUC Recall
P.
99m
Tc-sestamibi LGBM 67% 63% 62%
P.
123
I RF 69% 69% 68%
Subtracted P. LGBM 70% 69% 69%
L.
99m
Tc-sestamibi SVM 58% 57% 58%
L.
123
I SVM 61% 62% 63%
Combined P. LGBM 71% 70 70%
This study clearly demonstrates that IQE1 is cru-
cial to ensuring that AI models achieve optimal per-
formance by providing cleaner, more targeted input
images.
3.4 Performance Limitations
As mentioned in Section 1, physicians usually rely on
multiple data sources before giving the final diagno-
sis. The proposed methodology demonstrates good
performance even when relying on a single type of
data (static images). This highlights the effectiveness
of the proposed approach in providing reliable in-
sights with limited data, especially in scenarios where
access to multiple modalities is limited.
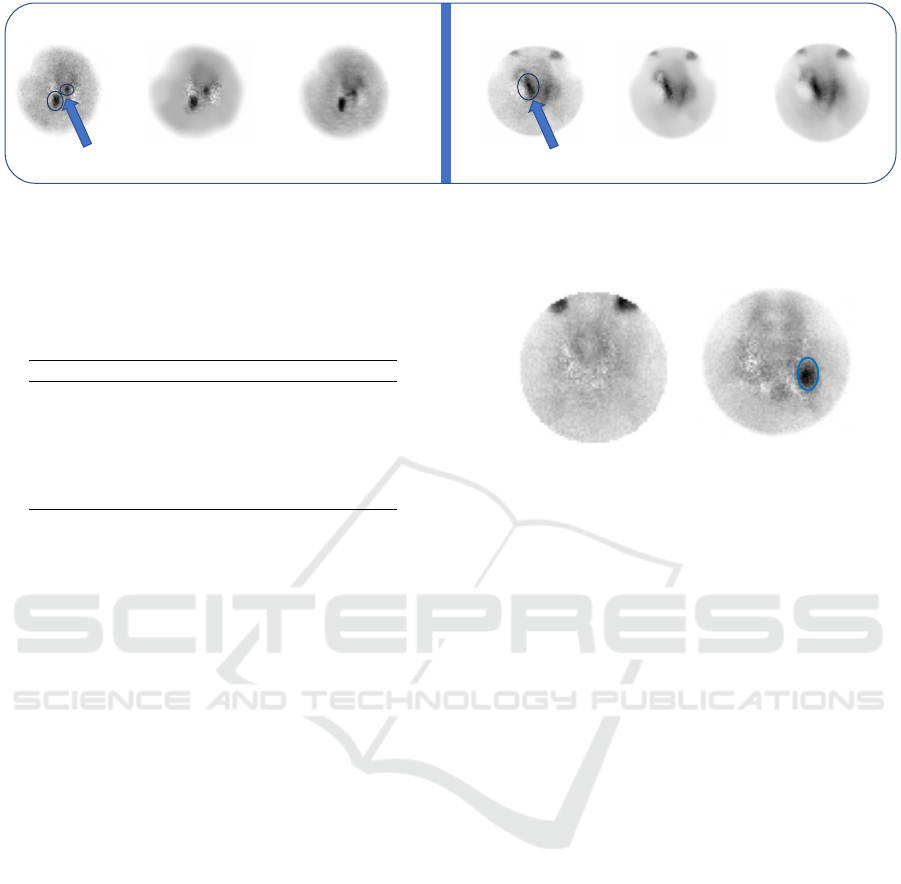
While the proposed methodology achieves an ac-
curacy of 83%, the remaining 17% represents cases
where the model couldn’t give the real class label (as
given and assigned by senior physicians). Figure 6
shows an example of misclassification, the predicted
labels are in red, whereas the real labels are below
each case. For the right case, the affected PG can’t
be observed in the image as it is in the posterior of
the thyroid, only its corresponding tomographic im-
ages could reveal the PG. On the other hand, in the
right case, the image reveals a gland in the blue cir-
cle, however, the diagnosis report revealed that it was
a thyroid gland and not a PG. The computed tomog-
raphy images were able to show this difference.
Suivi de thèse | Besançon | 11/03/2024 8
DIAGNOSTIQUE PAR CLASSIFICATION
Normal
Abnormal
Abnormal
Normal
Predicted
Real
Figure 6: Misclassification example.
For future works, including tomographic images
should be considered for an accurate diagnosis, as
it proved its efficiency (
¨
Oks
¨
uz et al., 2011) (Petra-
novi
´
c Ov
ˇ
cari
ˇ
cek et al., 2021). Also, medical object
detection and segmentation could be more accurate
as they only focus on specific regions of images.
4 CONCLUSIONS
This paper presented a methodology for abnor-
mal PGs detection using static dual-isotope
99m
Tc-
sestamibi and
123
I PINHOLE and LEHR images.
First, statistical features were extracted to be com-
bined with the images for classification. The im-
ages were normalized using the MinMax technique.
Then, an image processing approach for IQE was ap-
plied using the statistical filter-based technique IQE1
(NLMD) and AI-based approach IQE2 (SCUNet).
The obtained results showed that IQE1 outperformed
IQE2 for this task, therefore IQE1 was selected for
the rest of the process. Next, the filtered images were
fed to CNN for feature extraction and then to Lasso
for feature selection. Finally, the statistical features
were combined with the selected features for nor-
mal/abnormal PGs diagnosis. After extensive simu-
lations, the results showed that the proposed method-
ology achieved an accuracy of 83% by combining the
PINHOLE images. The results also showed that IQE1
improved the diagnosis results by 16.9%, boosting
image classification. The obtained performance in-
Enhancing Image Quality to Improve Medical Image Classification: Application to Nuclear Medicine Planar Images
309

dicates the potential of the proposed methodology to
be a reliable medical assistance tool by providing a
primary diagnosis using only one type of data.
COMPLIANCE WITH ETHICAL
STANDARDS
This study was registered by the Clinical Research
and Innovation Delegation of the University Hospital
Center of Besanc¸on under the number 2023/796.
ACKNOWLEDGMENT
This work has been achieved in the frame of the
EIPHI Graduate school (contract “ANR-17-EURE-
0002”).
REFERENCES
Bhardwaj, N., Kaur, G., and Singh, P. K. (2018). A system-
atic review on image enhancement techniques. Sen-
sors and Image Processing: Proceedings of CSI 2015,
pages 227–235.
Bilezikian, J., Cusano, N., Khan, A., Liu, J., Marcocci,
C., and Bandeira, F. (2016). Primary hyperparathy-
roidism. nature reviews disease primers. 2016; 2:
16033.
Boukhennoufa, O., Comas, L., Nicod, J.-M., Ungureanu,
C., Zerhouni, N., and Boulahdour, H. (2024). Au-
tomatic detection of parathyroid glands in nuclear
medicine. In 2024 IEEE International Symposium on
Biomedical Imaging (ISBI), pages 1–4. IEEE.
Buades, A., Coll, B., and Morel, J.-M. (2011). Non-local
means denoising. Image Processing On Line, 1:208–
212.
Khan, A., Hanley, D., Rizzoli, R., Bollerslev, J., Young,
J., Rejnmark, L., Thakker, R., D’amour, P., Paul, T.,
Van Uum, S., et al. (2017). Primary hyperparathy-
roidism: review and recommendations on evaluation,
diagnosis, and management. a canadian and interna-
tional consensus. Osteoporosis International, 28:1–
19.
Kim, K., Lee, M.-H., and Lee, Y. (2020). Investigation of a
blind-deconvolution framework after noise reduction
using a gamma camera in nuclear medicine imaging.
Nuclear Engineering and Technology, 52(11):2594–
2600.
Lee, S.-W., Shim, S. R., Jeong, S. Y., and Kim, S.-J. (2021).
Direct comparison of preoperative imaging modali-
ties for localization of primary hyperparathyroidism:
a systematic review and network meta-analysis. JAMA
Otolaryngology–Head & Neck Surgery, 147(8):692–
706.
Lin, T.-Y., Goyal, P., Girshick, R., He, K., and Doll
´
ar, P.
(2017). Focal loss for dense object detection. In
Proceedings of the IEEE international conference on
computer vision, pages 2980–2988.
Nieciecki, M., Cacko, M., and Kr
´
olicki, L. (2015). The
role of ultrasound and nuclear medicine methods in
the preoperative diagnostics of primary hyperparathy-
roidism. Journal of Ultrasonography, 15(63):398–
409.
¨
Oks
¨
uz, M.
¨
O., Dittmann, H., Wicke, C., M
¨
ussig, K., Bares,
R., Pfannenberg, C., and Eschmann, S. M. (2011). Ac-
curacy of parathyroid imaging: a comparison of pla-
nar scintigraphy, spect, spect-ct, and c-11 methion-
ine pet for the detection of parathyroid adenomas and
glandular hyperplasia. DIR, 17(4):297.
Petranovi
´
c Ov
ˇ
cari
ˇ
cek, P., Giovanella, L., Carri
´
o Gasset, I.,
Hindi
´
e, E., Huellner, M. W., Luster, M., Piccardo, A.,
Weber, T., Talbot, J.-N., and Verburg, F. A. (2021).
The eanm practice guidelines for parathyroid imaging.
EJNMMI, 48:2801–2822.
Samaras, A.-D., Tsimara, M., Voidila, S., Papandrianos, N.,
Zampakis, P., Moustakidis, S., Papageorgiou, E., and
Kalogeropoulou, C. (2024). Explainable classification
of patients with primary hyperparathyroidism using
highly imbalanced clinical data derived from imaging
and biochemical procedures. AS, 14(5):2171.
Sandqvist, P., Sundin, A., Nilsson, I.-L., Gryb
¨
ack, P., and
Sanchez-Crespo, A. (2022). Primary hyperparathy-
roidism, a machine learning approach to identify
multiglandular disease in patients with a single ade-
noma found at preoperative sestamibi-spect/ct. Euro-
pean Journal of Endocrinology, 187(2):257–263.
Sung, J. Y. (2015). Parathyroid ultrasonography: the
evolving role of the radiologist. Ultrasonography,
34(4):268.
Tibshirani, R. (1996). Regression shrinkage and selection
via the lasso. Journal of the Royal Statistical Society
Series B: Statistical Methodology, 58(1):267–288.
Tlili, G., Mesguich, C., Gaye, D., Tabarin, A., Haissa-
guerre, M., and Hindi
´
e, E. (2023). Dual-tracer 99mtc-
sestamibi/123i imaging in primary hyperparathy-
roidism. QJNMMI.
Walker, M. D. and Silverberg, S. J. (2018). Primary hy-
perparathyroidism. Nature Reviews Endocrinology,
14(2):115–125.
Yoshida, A., Ueda, D., Higashiyama, S., Katayama, Y.,
Matsumoto, T., Yamanaga, T., Miki, Y., and Kawabe,
J. (2022). Deep learning-based detection of parathy-
roid adenoma by 99mtc-mibi scintigraphy in patients
with primary hyperparathyroidism. Annals of Nuclear
Medicine, 36(5):468–478.
Zhang, K., Li, Y., Liang, J., Cao, J., Zhang, Y., Tang, H.,
Fan, D.-P., Timofte, R., and Gool, L. V. (2023). Practi-
cal blind image denoising via swin-conv-unet and data
synthesis. Machine Intelligence Research, 20(6):822–
836.
Zhang, Z., Zhang, Q., Gao, Z., Zhang, R., Shutova, E.,
Zhou, S., and Zhang, S. (2024). Gradient-based pa-
rameter selection for efficient fine-tuning. In Proceed-
ings of the IEEE/CVF Conference on Computer Vision
and Pattern Recognition, pages 28566–28577.
BIOIMAGING 2025 - 12th International Conference on Bioimaging
310
