
AI Models for Ultrasound Image Similarity Search:
A Performance Evaluation
Petra Takacs
1
, Richard Zsamboki
1
, Elod Kiss
1
and Ferdinand Dhombres
2
1
GE HealthCare Hungary, Budapest, Hungary
2
Sorbonne University, INSERM Limics, GRC26, Armand Trousseau Hospital, APHP Paris, France
Keywords: AI, Ultrasound, Image Similarity Search, Comparison, Vision Transformer, ResNet.
Abstract: Querying similar images from a database to a reference image is an important task with multiple possible use-
cases in healthcare industry, including improving labelling processes, and enhancing diagnostic support to
medical professionals. The aim of this work is to measure the performance of different artificial neural
networks, comparing their ability to identify clinically relevant similar images based on their generated feature
sets. To measure the clinical relevance, metrics using expert labels of organs and diagnoses on the images
were calculated, and image similarity was further confirmed by pixel metrics. Images with organ and
diagnosis labels were selected from a dataset of early-stage pregnancy and 2
nd
-3
rd
trimester pregnancy
ultrasound images respectively for the measurements. The networks were chosen from state-of-the-art
foundational models trained on natural images, DINO and DINOv2, SAM2, and DreamSim. The best
performing model based on our experiments is DreamSim for organ matches, and DINO for diagnosis matches.
A simple ResNet trained on the mentioned early pregnancy dataset for organ classification was also added to
the selection. ResNet performs best for early pregnancy organ matches, therefore finetuning a robust encoder
on our own dataset is a promising future step to further enhance medically relevant similar image search.
1 INTRODUCTION
Image similarity search is a method that is able to list
the top N most similar images from a reference
database to a query image. The image similarity
search methods are widely applicable for different
use-cases, for example, image acquisition support,
diagnostic support applications, annotation tools (in
medical device or during development to label dataset
for AI training). These can benefit from presenting a
clinically useful reference gallery of medical images
to a given query image.
The currently most popular image similarity
search methods require the image dataset to be
converted into a feature space representation where a
robust and fast search algorithm can be applied. This
method is also called content-based image retrieval
(CBIR), a popular area of research that focuses on
developing methods for efficient retrieval processes
in large image datasets. In CBIR systems, there are
two phases, the offline and online phase. During the
offline phase, features are being extracted from a set
of reference images, stored as local features, and used
to index the whole image database. During the online
phase, the features for the query image are generated
and compared with those in the database using a
similarity- or distance metric. Images that have the
lowest distances to the query image are considered as
the results of the similarity search (Agrawal, 2022),
(Qayyum, 2017).
CBIR systems for image similarity are currently
based on CNN, ResNet or Vision Transformer (ViT)
models. ViTs tend to be better encoders than ResNets
for tasks, where the input data is not structured, or has
a high variability in features. ResNets were designed
for image recognition, which assumes that images
have regularity and structure in their features while
ViTs are more flexible, able to encode information
from any type of data with less prior knowledge about
its structure.
ResNet layers have a limited capacity to process
large amounts of data, while ViTs can process longer
sequences and higher data dimensionality by using
their (self-) attention mechanisms. Self-attention
mechanism in ViTs allows them to capture long-
range dependencies, while CNNs only have local
receptive fields, and they cannot learn long-distance
relationships as adequately as ViTs (Vaswani, 2017).
414
Takacs, P., Zsamboki, R., Kiss, E. and Dhombres, F.
AI Models for Ultrasound Image Similarity Search: A Performance Evaluation.
DOI: 10.5220/0013114700003911
Paper published under CC license (CC BY-NC-ND 4.0)
In Proceedings of the 18th International Joint Conference on Biomedical Engineering Systems and Technologies (BIOSTEC 2025) - Volume 2: HEALTHINF, pages 414-424
ISBN: 978-989-758-731-3; ISSN: 2184-4305
Proceedings Copyright © 2025 by SCITEPRESS – Science and Technology Publications, Lda.

The ViTs are outstandingly effective for
generating high-quality global descriptors, without
requiring adjustments in the training data. The ViT-
method outperforms 36 existing state-of-the-art
descriptors, which were previously achieved by
CNN-based methods in image retrieval tasks.
Furthermore, its low computational complexity
makes it a promising candidate for replacing
traditional and widely used CNN-based approaches in
image retrieval techniques (Gkelios, 2021).
The second part of an image similarity task is the
search in the extracted feature space of reference
images. To be able to effectively and quickly search
for similar images in a relatively large dataset size
(from a few 1000 samples), structured search
methods are recommended. The most popular ones
are search trees and vector databases.
Vector databases provide efficient means for
storing, retrieving, and managing the high-
dimensional vector representations in large language
model (LLM) operations (Jing, 2024). However, for
a smaller dataset, KD Tree search method is quicker
to build and use.
Evaluating the similarity search algorithms can
happen pixel-wise and using extra information
(labels). Measuring how many matching labels
(organs with planes, findings, diagnoses) are present
compared to the query image can help getting
information about how useful the similarity search is
for diagnostic support or automatic, AI-based
labelling.
Another, novel evaluation method for similarity
techniques is DreamSim. The main issue with other
popular perceptual similarity metrics is that they
operate at the pixel or patch level, analyzing lower-
level attributes (colours, textures) without
considering mid-level similarities (image layout,
object poses). DreamSim, a novel perceptual
similarity metric fine-tuned to align with human
perception can outperform the old metrics by
emphasizing foreground objects and semantic
content, but also counting with colour and layout (Fu,
2023). Due to its robustness in finding similarities on
images, its ability to translate images into feature
vectors can also be utilized.
State-of-the-art comparison articles for CBIR
methods are available mainly from 1995-2015,
evaluating handcrafted techniques (Madugunki,
2011), (Kokare, 2003), (Deselaers, 2008), or
comparing text-based models (BERT, XLNet,
RoBERTa) only (Yang, 2020). Evaluating CBIR
techniques with and without deep learning can be
found in (Ahmed, 2024), showing the advantages of
using AI.
Based on the mentioned works, the encoders
chosen for evaluation are recent state-of-the-art ViTs,
DINO and DINOv2, SAM2, and DreamSim. A
simple ResNet trained on our dataset for organ
classification was also evaluated. The search
algorithms used in the CBIR offline stage are KD
Tree, Ball Tree and vector database.
The main goal of our experiments was to reach
the best possible performance considering clinically
relevant similar image search with as small network
size and parameter number as possible, remaining fast
and easy-to-use.
2 METHOD
Four recently published state-of-the-art encoders
trained on various image datasets, and a ResNet
trained specifically on early pregnancy ultrasound
images were evaluated and compared in their abilities
of extracting features for medically relevant
similarity search on the pregnancy ultrasound
database. The encoders chosen for evaluation are
detailed below.
2.1 Image Encoders
2.1.1 DINO
DINO was chosen as the first available, well-
performing pretrained ViT model. From all possible
DINO variations (see at Table 1.), ViT-S/8 was
chosen with its 21M parameters. The model extracts
feature vectors with length of 384. (Vaswani, 2017),
(Caron, 2021).
Table 1: Pretrained DINO weights and parameter numbers.
Model Params
ViT-S/16 21M
ViT-S/8 21M
ViT-B/16 85M
ViT-B/8 85M
2.1.2 DINOv2
DINOv2 is considered to be an improvement over
DINO, offering better performance on downstream
tasks. The difference between the two models is in
their processing details. During training DINO uses
cross-entropy loss with soft labels, while DINOv2
uses KL divergence to measure the similarity of two
images. The cross-entropy loss in DINO is less
efficient computationally and more sensitive to noise
AI Models for Ultrasound Image Similarity Search: A Performance Evaluation
415
than the one used in DINOv2, but it can capture long-
range dependencies between pixels better. On the
other hand, DINOv2's KL divergence has a lower
variance and works well with larger batch sizes.
DINOv2 training process incorporates a multi-crop
augmentation strategy to improve generalization
performance, where multiple views of the same
image are used in contrastive learning.
From the available DINOv2 variations, ViT-S/14
distilled was chosen (see at Table 2.), because of the
smaller size but comparable performance with the
first version of DINO. The model extracts feature
vectors with length of 384 (Oquab, 2023), (Darcet,
2023).
Table 2: Pre-trained DINOv2 weights and parameter
numbers.
Model Params (M)
ViT-S/14 21
ViT-B/14 86
ViT-L/14 300
ViT-g/14 1,100
2.1.3 SAM2
While DINO and DINOv2 were trained for general
reconstruction tasks, SAM2 is a foundation model
built for solving visual segmentation in images and
videos, thus working with matrices instead of vector
representations in its feature space. In order to get
comparable results with DINO models, the extracted
matrix had to be flattened and shortened with
averaging. The final feature vector length is 256.
From the available pretrained SAM2 weights
(Table 3.), the smallest available network was chosen,
similarly to DINO and DINOv2 (Ravi, 2024).
Table 3: Pre-trained SAM2 weights and parameter numbers.
Model Size (M)
sam2_hiera_tiny 38.9
sam2_hiera_small 46
sam2_hiera_base_plus 80.8
sam2_hiera_large 224.4
2.1.4 DreamSim
As mentioned in the introduction, DreamSim has
outstanding capabilities measuring similarities
among a set of images. Their model was trained by
concatenating CLIP (Radford, 2021), Open CLIP
(Cherti, 2023), and DINO (Vaswani, 2017)
embeddings, and then finetuning it based on human
perceptual judgements. This ensembled method
outperformed the individual encoders in
performance, therefore, its feature extraction abilities
were exploited and used besides the final similarity
evaluation scores it calculates (Fu, 2023).
The length of a feature vector generated with
DreamSim is 1792.
2.1.5 ResNet
A ResNet- based network was trained on the early
pregnancy ultrasound images for organ classification.
The image features extracted with its encoder are also
added to the comparative evaluation, to check the
possible effects of using the same ultrasound domain,
compared to larger models trained on completely
different datasets.
The parameter number of the ResNet trained on
early pregnancy is around 1 000 000. The accuracy of
the model measured on the same dataset using a
completely separated test set (containing 600 images)
is 84.81%.
The length of a feature vector generated with
ResNet encoder is 256.
2.2 Search Methods
To search among the generated feature vectors
effectively, tree-based methods and vector database
solutions were applied. The current dataset consists
of 4800 early pregnancy and 3300 fetal labelled
images, and for this scale KD Tree is the fastest and
most efficient method. However, when the size of the
labelled dataset scales up, vector database could
outperform KD Tree.
2.2.1 Vector Databases (Vector DB)
Vector databases are indexing- and retrieval systems
designed for higher dimensional spaces. They use
binary search trees for storing vectors in a
compressed format allowing efficient querying.
Unlike KD Tree or Ball Tree, Vector DB does not
divide the dataset into smaller regions, it partitions the
data points using a hierarchical clustering algorithm,
then stores them as a tree of centroids. The search is
performed by finding the closest centroid to the query
point, then executing binary searches on its children.
The currently used Vector DB is a Pythonic
vector database offering a comprehensive suite
of create, read, update, and delete operations and
robust scalability options, including sharding and
replication. It's easy to deploy in a variety of
environments, from local to cloud applications.
HEALTHINF 2025 - 18th International Conference on Health Informatics
416
2.2.2 KD Tree
Tree-based search algorithms work by dividing the
dataset into smaller parts, enabling faster access and
retrieval of data features in a region of interest. The
most common tree-based search algorithm is KD
Tree. It divides the dataset along each dimension
recursively until it reaches the leaf nodes that contain
the data points. KD Tree spatial algorithm was used
in our experiments from SciPy library in Python.
2.2.3 Ball Tree
Ball Tree is a tree structure designed for K-nearest
neighbour search in low dimensional spaces
(typically less than 10). It works by partitioning the
dataset into hyperspheres of equal size and radius.
Each of these balls contain several data points, with
the center being the midpoint of the given ball. The
algorithm builds a set of overlapping balls, so ball is
as large as possible while containing all the nearest
neighbours to any point within it. Ball Tree was
implemented using scikit- learn Python library.
2.3 Experiments and Results
NVIDIA Quadro RTX 5000 was used for the
experiments. Generating feature vectors for 10000
images took below 70 minutes in all cases and took
around 20 minutes with feature vector length under
400. Inference time of the search algorithms
(including building the search structure and querying
top 10 images) is below 0.5 seconds.
2.3.1 Dataset
Data collection was part of the SUOG research
project, conducted by multiple hospitals in Europe.
Images were de-identified and managed by
Assistance Publique – Hôpitaux de Paris. The data
was collected prospectively for SUOG and the image
similarity search is a part of this project as well.
The dataset consists of 18000 early pregnancy
images from which 4800 is labelled with organs (and
planes: axial, coronal, sagittal) and diagnosis
(including normal pregnancy), and the other had
130000 fetal images from which 3300 is labelled with
organs (and planes) and diagnoses. In this work only
the labelled part of the two datasets were used to
measure clinical relevance of the methods.
2.3.2 Search Algorithms
To choose between KD Tree, Ball Tree and Vector
DB, experiments were made on different data sizes
(5000, 15000 images), comparing the time demand of
building the structure and vector querying. For
building the tree, the results can be seen in Table 4.
For querying the dataset with a vector with length (L)
of 10, 20 and 50 the times required are summarized
in Table 5.
Table 4: Building times of each structure.
Buildin
g
time (s)
Data size KD Tree Ball Tree Vector DB
5000 0.011 0.120 0.042
15000 0.050 0.540 0.127
Table 5: Querying times of KD Tree, Ball Tree and Vector
DB (in sec).
Data size L=10 L=20 L=50
KD Tree
5000 0.005 0.005 0.004
15000 0.016 0.016 0.015
Ball Tree
5000 0.001 0.001 0.001
15000 0.004 0.005 0.005
Vector DB
5000 0.015 0.007 0.007
15000 0.043 0.019 0.019
Considering building times KD Tree performed
the best. For querying in a tree Ball Tree seems the
quickest by a factor of 2-3, but due to its slower
building process, the final chosen algorithm for the
dataset is KD Tree.
2.3.3 Pixel Metrics
The main goal is to evaluate the similarity methods
based on clinical relevance. To further support this
we also compared different pixel-level metrics to
assess their ability to distinguish semantically similar
and different images. To have an idea of the
network’s performance on pixel-level similarity
different metrics were evaluated and the most
distinguishable, quickest, and simplest were
selected.
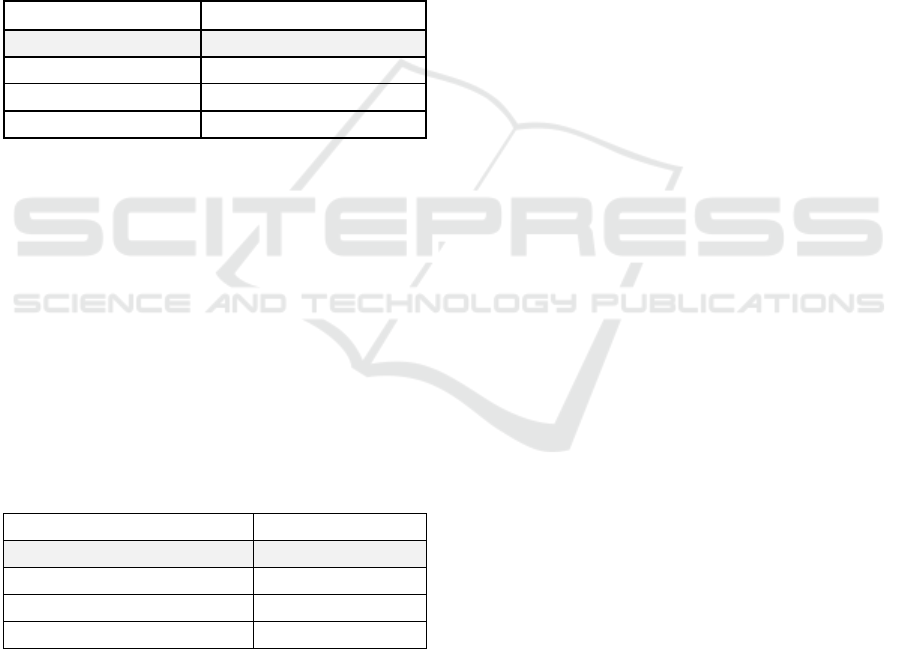
For the pixel- metric evaluation 5-5 visually
similar and not- similar images were chosen from our
ultrasound dataset. Also 4 non-ultrasound, natural
images were chosen to imitate out-of-scope scenarios.
This can be seen on Figure 1. with the reference
image on the top, the visually similar images from the
same ultrasound dataset are in the second row, the
visually not-similar images from the same ultrasound
dataset are in the third row, and randomly chosen
natural images are in the fourth row.
As the number of selected images is limited, if the
pixel-metrics would be planned to use for evaluation
besides additional confirmation, extended image sets
with detailed pixel-metric statistics were needed.
AI Models for Ultrasound Image Similarity Search: A Performance Evaluation
417
The evaluation of histogram- based image
similarity and MSE compared to DreamSim score can
be seen in Table 6., 7. and 8. For histogram-based
score the range is [0,1], where 1 means the exact same
image. For the selected natural images (not similar to
ultrasound) the value range is [0.2, 0.6], for
ultrasound images it is [0.3, 0.8], for visually similar
ultrasound images it is above 0.9. For MSE 0 means
the exact same match. For natural images the value
range is [5500, 17000], for ultrasound images it is
[5000, 7500], for similar ultrasound images it is
below 5500. For DreamSim [0,1] is the value range
and 0 is the exact same match. For natural images the
values are above 0.6, for ultrasound images the value
range is [0.25, 0.4], for similar ultrasound images it is
below 0.2. AI- based scores performed more robustly
and consistently, separating different types of
similarities better than pixel-based metrics.
Other traditional CBIR methods were also
evaluated (SSIM, SIFT, RMSE, PSNR, UQI, MSSIM,
ERGAS, SCC, SAM, VIF) but their results showed
high overlaps between similar and not similar cases.
Table 6: Similarity scores of pixel-based metrics for the
same reference image and for other natural images.
Metric Same Natural ima
g
es
Hist. base
d
1 0.41 0.29 0.68 0.67
MSE 0 16748 10517 7405 5698
DreamSi
m
0 0.69 0.81 0.8 0.76
Table 7: Similarity scores of pixel-based metrics for not-
similar images from same database.
Metric
Not similar images from same
database
Hist. base
d
0.59 0.79 0.73 0.38 0.65
MSE 5097 5898 6190 6452 7106
DreamSi
m
0.32 0.28 0.36 0.35 0.3
Table 8: Similarity scores of pixel-based metrics for similar
images from same database.
Metric Similar images from same database
Hist. base
d
0.95 0.95 0.99 0.98 0.87
MSE 1808 3653 4281 5492 4055
DreamSi
m
0.04 0.07 0.11 0.13 0.16
2.3.4 Image Similarity Search
To evaluate the similarity search methods, a random
selection of 10 images were chosen from SUOG
dataset for comparison. Since the fetal image dataset
has significantly more possible organ and diagnosis
labels, it was chosen to present the results in detail.
The same measurements were done also on the early
pregnancy dataset.
Figure 1: Test images for pixel-based similarity metrics.
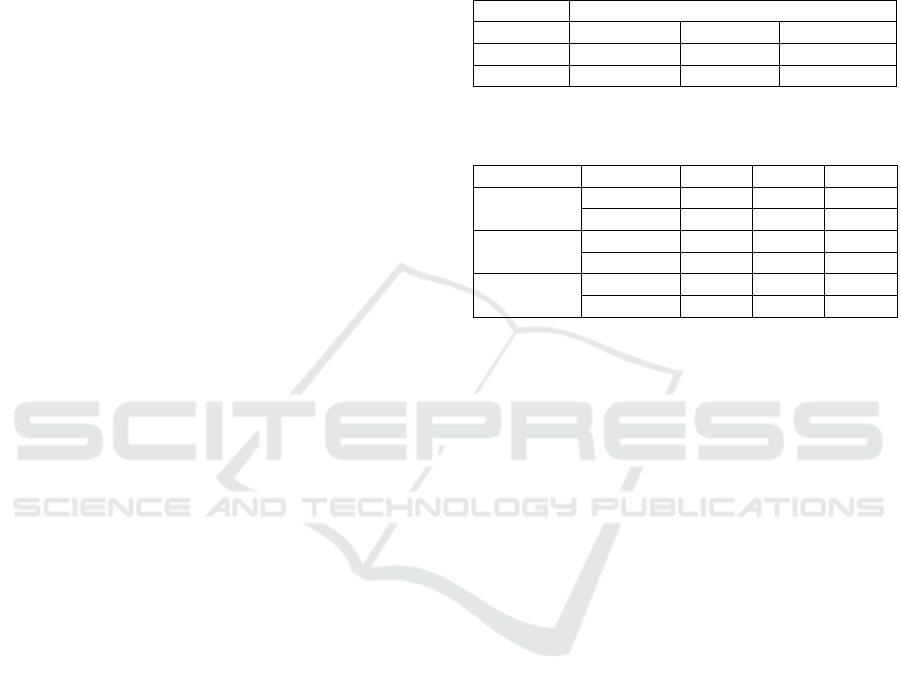
Figure 2: Image of sagittal cervical fetal spine, in fetal spine
group.
Figure 3: 10 Most similar images for reference image in
Figure 2., 8 out of 10 belongs to fetal spine group.
2.3.5 Results on Fetal Dataset
To compare the methods, as a first step the top 10
retrieved similar image results were evaluated
iterating through all images in our dataset. We
measure the relevance of the retrieved similar images
by checking how many organ, diagnosis and finding
labels match with the original (reference) image. For
example, for a reference image labelled as ‘sagittal
cervical fetal spine’ (presented in Figure 2.), the most
similar 10 images (based on DreamSim features and
HEALTHINF 2025 - 18th International Conference on Health Informatics
418
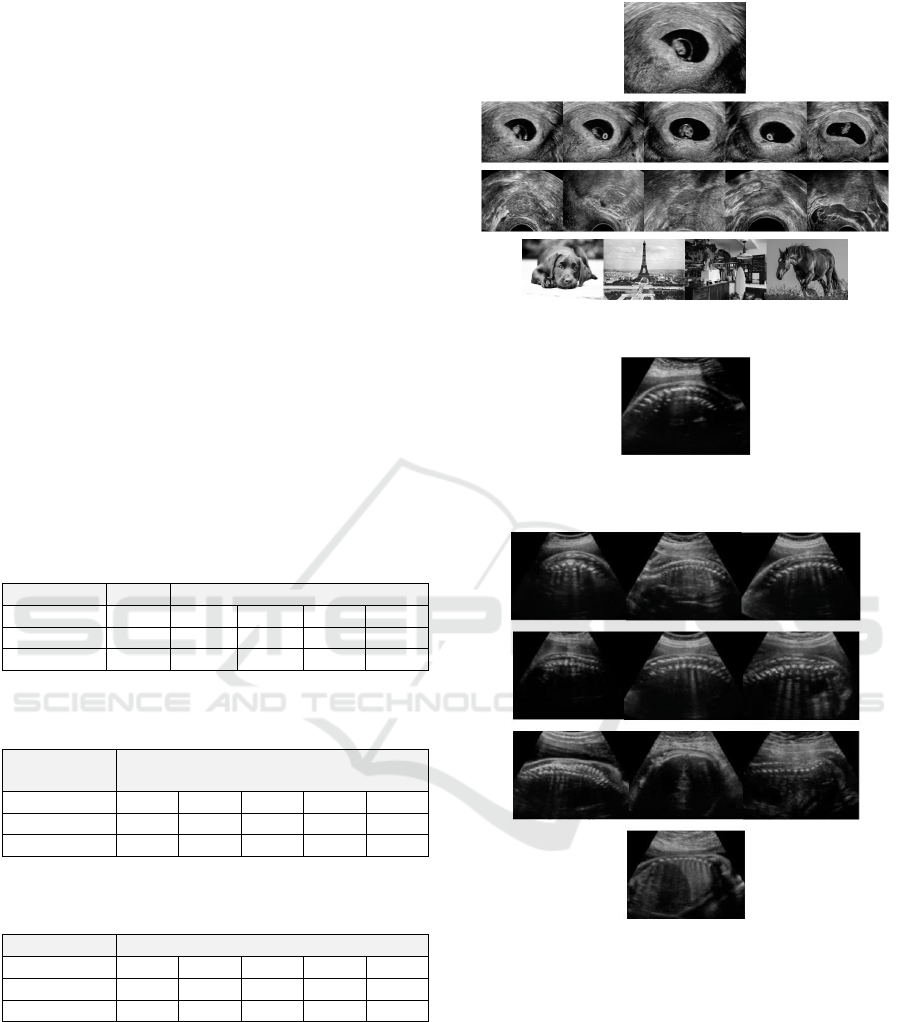
Figure 4: 10 Randomly selected images from the database
for comparison to the top 10 images retrieved with
similarity search, 0 out of 10 belongs to fetal spine group.
KD Tree search) can be seen on Figure 3., and a
random selection of 10 images can be seen on Figure
4. Evaluating the organ labels of the images in both
selection of images (Figure 2., 3. and 4.) the
superiority of similarity sampling is visible. In the
similar selection 8 out of 10 images belongs to the
same organ group as the query image (fetal spine),
while in the random selection, no image belongs to
the same organ group.
Apart from visual similarity, label matches have
also been counted to measure clinical relevance of the
retrieved similar images. Exact label matches and
label group matches are measured separately for
organs and for diagnoses. The groups were formed
based on consultations with medical experts. Organ
groups are created to fuse together organs that
belongs together biologically (e.g. different parts of
the spine – lumbar, cervical, thoracic), or are very
close to each other in space, or are visually similar
(left and right part of the same organ).
The following values were measured for the top
10 similar retrieved image for a reference image (note
that ‘#’ is used to abbreviate ‘number count’ in the
following tables):
• The organs and organ group match counts in a
reference image’s top 10 similar image set, with each
encoder’s features. Table 9. shows an example,
measured with DreamSim features.
• Diagnosis match counts in a reference image’s
top 10 similar image set, with each encoder’s
features. Table 10. shows an example, measured with
DreamSim features.
• Histogram-based pixel similarity, MSE and
DreamSim score for each of a reference image’s top
10 similar image set, measured with each encoder’s
features. (Summarized results are presented later.)
• The summarized and averaged label match
values for each organ and for each diagnosis, with the
total number of labelled images marked for each
organ or diagnosis class, and the expected values to
get similar images calculated with random sampling
for comparison. The summary tables have been
generated for each encoder. Table 11., 12., 13., and
14. show an example of a subset of the measured label
match values, with 6 organs presented (out of 102
available ones) for simpler visualization.
• The summarized label match values for each
organ and diagnosis, calculated with weighted
average (with the number of labelled images for each
class) to have a final, single value for method
comparison (see in Table 15- 17).
Table 9: Organ and organ group label match counts for a
reference image’s top 10 similar images (using DreamSim
features and KD Tree search). Higher counts in the same
organ class or organ group class are considered as better
results. Reference organ label is ‘sagittal cervical fetal
spine’ in ‘fetal spine’ group.
Or
g
an # Grou
p
#
Sagittal conus
medullaris
3 Fetal spine
8
Sagittal thoracic fetal
spine
3 Fetal spine
Sagittal lumbar fetal
s
p
ine
2 Fetal spine
Axial middle cerebral
arter
y
1
Fetal brain and
skull
1
Sagittal right
diaphragmatic dome
1 Fetal abdomen 1
For every labelled image in the dataset with every
mentioned encoder (and KD Tree search), the top 10
similar images statistics are calculated to measure
organ, organ group, diagnosis, and diagnosis label
matches. Not found labels (that are being present in
the reference image but not on any of the top 10
similar ones), and extra organ classes/ diagnoses (that
are not present among the reference image labels, but
present on one or more of the retrieved top 10 similar
ones) are also counted and stored.
AI Models for Ultrasound Image Similarity Search: A Performance Evaluation
419
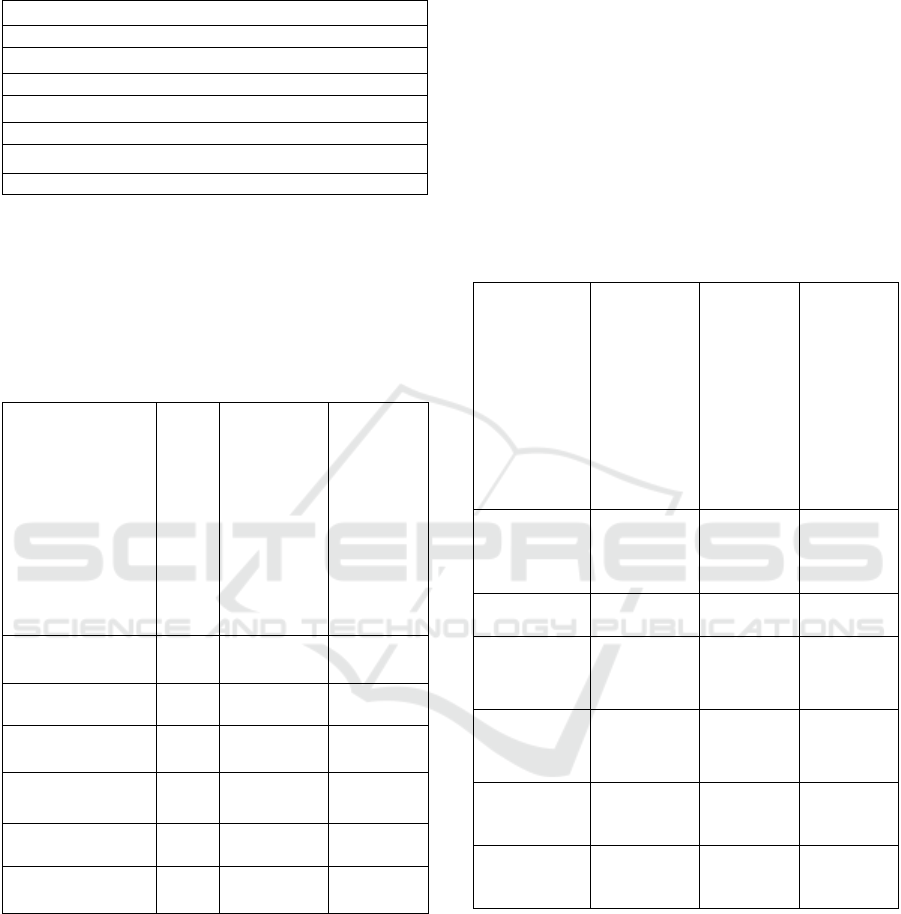
Table 10: Diagnosis label match counts for a reference
image's top 10 similar image set (using DreamSim
features).
Reference diagnoses:
Left con
g
enital dia
p
hra
g
matic hernia
# common diagnoses (reference- top 10 similar):
0
# not found diagnoses (at all on top 10 similar):
1
# extra diagnoses (besides reference diagnose(s)):
8
The statistics from Table 9. and 10 are further
summarized for image examples belonging to the
same organ class and diagnosis, organ group and
diagnosis group. As a final step, label match statistics
are weighted averaged together based on the amount
of image examples belonging to each organ class.
Table 11: Label match statistics for organ classes.
Organ
Image count
Expected number of images
with the same organ label in
10 images with random
sampling (mean)
Number of images with the
same organ label in top 10
images, with similarity
search (mean)
Cerebral posterior
fossa mid sagittal
24 0.11 0.38
Longitudinal
cervix
3 0.01 0.33
Trans-cerebellar
axial oblique
74 0.32 3.45
Lateral ventricule
para sagittal
29 0.13 2.86
Sylvian fissure
para sagittal
15 0.07 1.60
Sagittal cervical
fetal spine
20 0.09 1.45
In Table 11. statistics are summarized from single
images’ top 10 statistics belonging to the same organ
class. The ‘image count’ column is the number of
image examples belonging to the given organ class.
The next column is the expected label match count
with random sampling (the image count in an organ
class divided by all labelled images). The last column
presents the label match count with similarity search
(using DreamSim). The third row in Table 11. shows
that with randomly sampling 10 images, we get 0.32
image examples with the same label in average, and
querying top 10 similar images, we get 3.45 image
examples with the same label (for an organ class
having a total number of 74 image examples. With
less image examples in an organ class (total of 3 for
example – like ‘Longitudinal cervix’) the expected
number of images is 0.01 in average with random
sampling, and 0.33 with image similarity. That means
if we randomly select 10 images, we will have very
little chance of seeing even one image example from
the same organ class, with or without image
similarity, so we need about 20-30 images minimum
in the reference dataset (for every organ and
diagnosis) to use our methods effectively.
Table 12: Label match statistics for organ groups.
Organ
Group
Expected # images with the
same organ group label in
10 images with random
sampling (mean)
# images with the same
organ group label in top 10
images, with similarity
search (mean)
Cerebral
posterior
fossa mid
sagittal
Fetal brain
and skull
3.14 8.13
Longitudinal
cervix
Adnexal 0.65 1.00
Trans-
cerebellar
axial oblique
Fetal brain
and skull
3.14 8.68
Lateral
ventricule
para sagittal
Fetal brain
and skull
3.14 9.17
Sylvian
fissure para
sa
g
ittal
Fetal brain
and skull
3.14 7.73
Sagittal
cervical fetal
s
p
ine
Fetal spine 0.79 3.95
In Table 12. the calculation analogy is similar to
Table 11. but the organ groups are summarized
together instead of calculating with separate organ
classes. For example, ‘Cerebral posterior fossa mid
sagittal‘, ‘Trans-cerebellar axial oblique’ and ‘Lateral
ventricule para sagittal’ and ‘Sylvian fissure para
sagittal’ belongs to the same, ‘Fetal brain and skull’
group, so all the image examples retrieved belonging
to ‘Fetal brain and skull’ is being considered as a
match, not just the exact same organ classes.
HEALTHINF 2025 - 18th International Conference on Health Informatics
420
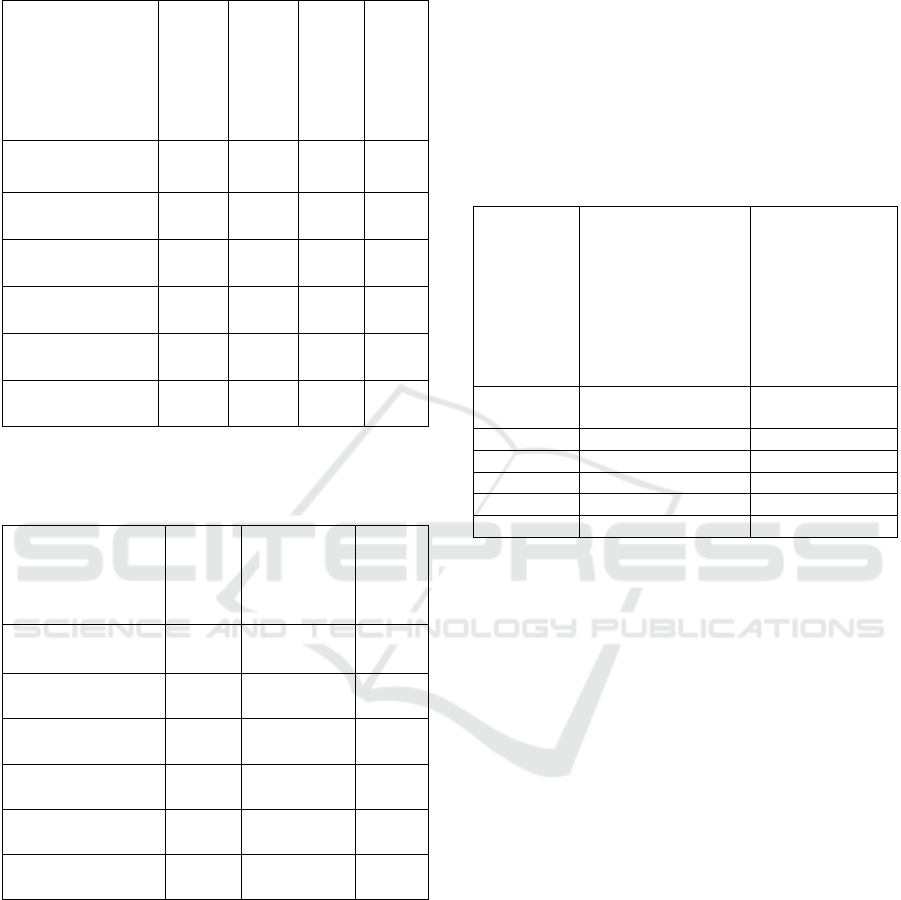
Table 13: Diagnosis label match statistics. The values in the
columns are averaged through all the single image statistics
belonging to the given organ class.
Organ
# Reference
diagnoses (mean)
# Common
diagnoses (mean)
# Not-found
diagnoses (mean)
# Extra diagnoses
(mean)
Cerebral posterior
fossa mid sagittal
1.15 0.28 0.87 7.44
Longitudinal
cervix
1.33 0.33 1.00 8.00
Trans-cerebellar
axial oblique
1.16 0.25 0.90 8.13
Lateral ventricule
para sagittal
1.17 0.31 0.86 7.58
Sylvian fissure
para sagittal
1.00 0.20 0.80 7.47
Sagittal cervical
fetal spine
1.05 0.50 0.55 7.40
Table 14: Pixel metric statistics. The pixel metric values in
the columns are averaged through all the single image
statistics belonging to the given organ class.
Organ
Hist. Sim.
(mean)
MSE (mean)
DreamSim
(mean)
Cerebral posterior
fossa mid sagittal
0.9653 2171.54 0.89
Longitudinal
cervix
0.9792 2787.11 0.80
Trans-cerebellar
axial oblique
0.9674 2557.68 0.90
Lateral ventricule
para sagittal
0.9872 1874.36 0.89
Sylvian fissure
para sagittal
0.9881 1451.74 0.90
Sagittal cervical
fetal spine
0.9592 1565.04 0.87
In Table 13. the number of diagnosis label match
counts are summarized for images belonging to the
given organ class (presented in rows). This means that
separate similar image set statistics like the example
in Table 10. (for top 10 retrieved similar images for a
single reference image) have been averaged for all
reference images in an organ class.
For example, in ‘Cerebral posterior fossa mid
sagittal’ there are 1.15 diagnoses on the reference
images in average, 0.28 common diagnoses in
average (diagnosis of the reference image that is also
found on at least one of the top 10 retrieved images),
0.87 diagnoses from reference images are not found
in average, and there are 7.44 diagnoses being present
on the similar images, but not on the reference image
in average (extra diagnoses).
Table 14. shows pixel-level similarity metrics
averaged out similarly as in Table 13.
Table 15: Final summary of image similarity search
experiments. Weighted average of organ and organ group
label match statistics. Expected value for random sampling
and best performing model is highlighted for comparison.
Model
Average number of
similar images in top 10
(With same organ
label)
Average number of
similar images in top 10
(With same organ group
label)
Random
Sampling
0.42 1.93
DINO 2.14 5.88
DINOv2 2.10 5.69
ResNet 1.10 4.15
DreamSim 2.68 6.41
SAM2 1.18 4.42
In the final summary tables (Table 15., 16., 17.)
statistics were counted for organ classes with
sufficient amount of image examples (> 20-25). This
currently means 30 organ classes from the available
102 ones, and similarly, 30 diagnose classes from the
67 available ones.
Table 15. presents the results with organ label
match counts. With randomly sampling 10 images the
expected organ label match count is 0.42 (most
probably we will not see any image belonging to the
same organ label), and with DreamSim and KD Tree
search, the organ label match count goes up to 2.68
(we will probably see 2-3 images belonging to the
same organ label). Because of the weighted average
summary, this means that the organ classes with more
image examples will perform even better, while organ
classes with fewer image examples are expected to
give less meaningful results. The next column shows
the similar statistics calculated with organ groups.
Table 16. summarizes diagnosis and diagnosis
group statistics. The best performing model on fetal
dataset for single and grouped organs is DreamSim,
for single and grouped diagnoses it is DINO.
For diagnoses and diagnosis groups the average
label match increment is not significant. Based on
consultation with medical experts the conclusion is
that organs and planes do not correlate well with
AI Models for Ultrasound Image Similarity Search: A Performance Evaluation
421

diagnoses from 2
nd
trimester of pregnancy, because
from that point multiple organs must be checked
thoroughly to set up a proper diagnosis. However,
findings, organs and planes tend to correlate well in
every stage of a pregnancy, and findings can help in
setting up the diagnosis.
Averaged and summarized pixel-level similarity
metrics tend to be quite close to each other for every
encoder, but all of them performs better than random
sampling, as Table 17. presents.
Table 16: Final summary of image similarity search
experiments for diagnoses. Weighted average of diagnoses
and diagnosis group label match statistics. Expected value
for random sampling and best performing model is
highlighted for comparison.
Model
Average number of
similar images in top 10
(With same diagnosis
label)
Average number of
similar images in top 10
(With same diagnosis
group label)
Random
Sampling
0.50 1.49
DINO 0.75 2.29
DINOv2 0.68 1.98
ResNet 0.68 1.93
DreamSi
m
0.74 2.12
SAM2 0.64 2.03
Table 17: Final summary of pixel metrics in image
similarity search experiments. DreamSim encoder’s
DreamSim score is biased but marked for comparison (*).
Pixel sim.
Model
Hist. Sim.
MSE
DreamSim
Score
Random Sampling 0.87 3246.89 0.75
DINO 0.95 2325.61 0.87*
DINOv2 0.94 2463.29 0.85
ResNet 0.93 2437.70 0.82
DreamSi
m
0.95 2247.93 0.88*
SAM2 0.96 2262.52 0.84
DreamSim scores are one of the best evaluation
metrics for similarity search when labels are not
available. As DreamSim encoder were used as an
encoder as well, its own score is biased and expected
to get higher scores than other encoders (as it contains
DINO features, it was also marked as a biased result),
however it still functions as a good comparison for
the other encoders.
2.3.6 Results on Early Pregnancy Dataset
We have performed the same analysis on our early
pregnancy dataset, and in that case, finding label
match statistics can also be measured (labelling the
fetal dataset with findings is still in progress). Due to
length constraints, only a brief summary of the final
results is provided here.
For early pregnancy data, the performance of the
models are very similar, but due to less variability of
organs at early stages of the pregnancy, the
increments tend to be less than on the fetal dataset.
Table 18: Final summary of image similarity search
experiments for organs and organ groups.
Model
Average number of
similar images in top 10
(With same organ
label)
Average number of
similar images in top 10
(With same organ group
label)
Random
Sam
p
lin
g
0.88 3.12
DINO 3.00 7.08
DINOv2 2.81 6.68
ResNet 3.64 8.19
DreamSi
m
3.20 7.30
SAM2 2.61 6.12
Table 19: Final summary of image similarity search
experiments for diagnoses and diagnosis groups.
Model
Average number of
similar images in top 10
(With same diagnosis
label)
Average number of
similar images in top 10
(With same diagnosis
group label)
Random
Sam
p
lin
g
2.36 2.83
DINO 3.83 4.39
DINOv2 3.45 3.95
ResNet 3.23 3.84
DreamSi
m
3.76 4.27
SAM2 3.23 3.77
The best performing model on early pregnancy
dataset for single and grouped organs is ResNet
(which was trained on the very same dataset for organ
classification), for single and grouped diagnoses it is
DINO, and for findings it is DreamSim. The pixel-
level metrics shows that comparing to random
HEALTHINF 2025 - 18th International Conference on Health Informatics
422

sampling, AI- based similarity search methods
perform consistently better. These results are being
presented in Table 18-21.
Table 20: Final summary of image similarity search
experiments for findings.
Model
Average number of
similar images in top 10
(With same finding
label)
Random Sam
p
lin
g
1.24
DINO 3.43
DINOv2 3.18
ResNet 3.01
DreamSim 3.58
SAM2 2.75
Table 21: Final summary of pixel metrics in image
similarity search experiments. DreamSim encoder’s
DreamSim score is biased but marked for comparison (*).
Pixel sim.
Model
Hist. Sim.
MSE
DreamSim
Score
Random Sam
p
lin
g
0.57 6234.12 0.70
DINO 0.92 3553.05 0.87*
DINOv2 0.91 3777.70 0.86
ResNet 0.90 3697.85 0.83
DreamSi
m
0.93 3397.69 0.89*
SAM2 0.93 3524.69 0.85
3 CONCLUSIONS
In general, we proved that employing AI models for
ultrasound similarity search resulted in reliable
performance, offering several usage possibilities in
medical applications.
In this image similarity task considering diagnosis
label match statistics, DINO features performed best,
and for organ label match statistics DreamSim
encoder performed best for fetal dataset. Our ResNet
was outstanding for early pregnancy organ label
matches. One likely explanation for this is that the
model’s training task was to separate the organs in
early pregnancy cases.
From this we can hypothesize that training an
encoder model on the whole ultrasound dataset using
general target (e.g. reconstruction) could enhance the
similarity search performance. This can be realized
by training a model from scratch, or finetune an
already evaluated encoder model using specific
techniques developed to tailor these models to custom
datasets.
ACKNOWLEDGEMENTS
Data collection and annotation activities were part of
the SUOG Project (www.suog.org), an EIT Health
Innovation supported project.
REFERENCES
Vaswani, A. (2017). Attention is all you need. Advances in
Neural Information Processing Systems.
Gkelios, S., Boutalis, Y., & Chatzichristofis, S. A. (2021,
July). Investigating the vision transformer model for
image retrieval tasks. In 2021 17th International
Conference on Distributed Computing in Sensor
Systems (DCOSS) (pp. 367-373). IEEE.
Agrawal, S., Chowdhary, A., Agarwala, S., Mayya, V., &
Kamath S, S. (2022). Content-based medical image
retrieval system for lung diseases using deep
CNNs. International Journal of Information
Technology, 14(7), 3619-3627.
Qayyum, A., Anwar, S. M., Awais, M., & Majid, M. (2017).
Medical image retrieval using deep convolutional neural
network. Neurocomputing, 266, 8-20.
Fu, S., Tamir, N., Sundaram, S., Chai, L., Zhang, R., Dekel,
T., & Isola, P. (2023). Dreamsim: Learning new
dimensions of human visual similarity using synthetic
data. arXiv preprint arXiv:2306.09344.
Jing, Z., Su, Y., Han, Y., Yuan, B., Liu, C., Xu, H., & Chen,
K. (2024). When Large Language Models Meet Vector
Databases: A Survey. arXiv preprint
arXiv:2402.01763.
Madugunki, M., Bormane, D. S., Bhadoria, S., & Dethe, C.
G. (2011, April). Comparison of different CBIR
techniques. In 2011 3rd International Conference on
Electronics Computer Technology (Vol. 4, pp. 372-
375). IEEE.
Kokare, M., Chatterji, B. N., & Biswas, P. K. (2003,
October). Comparison of similarity metrics for texture
image retrieval. In TENCON 2003. Conference on
convergent technologies for Asia-Pacific region (Vol.
2, pp. 571-575). IEEE.
Deselaers, T., Keysers, D., & Ney, H. (2008). Features for
image retrieval: an experimental
comparison. Information retrieval, 11, 77-107.
Yang, X., He, X., Zhang, H., Ma, Y., Bian, J., & Wu, Y.
(2020). Measurement of semantic textual similarity in
clinical texts: comparison of transformer-based
models. JMIR medical informatics, 8(11), e19735.
Caron, M., Touvron, H., Misra, I., Jégou, H., Mairal, J.,
Bojanowski, P., & Joulin, A. (2021). Emerging
AI Models for Ultrasound Image Similarity Search: A Performance Evaluation
423

properties in self-supervised vision transformers.
In Proceedings of the IEEE/CVF international
conference on computer vision (pp. 9650-9660).
Oquab, M., Darcet, T., Moutakanni, T., Vo, H., Szafraniec,
M., Khalidov, V., ... & Bojanowski, P. (2023). Dinov2:
Learning robust visual features without
supervision. arXiv preprint arXiv:2304.07193.
Darcet, T., Oquab, M., Mairal, J., & Bojanowski, P. (2023).
Vision transformers need registers. arXiv preprint
arXiv:2309.16588.
Ravi, N., Gabeur, V., Hu, Y. T., Hu, R., Ryali, C., Ma, T.,
... & Feichtenhofer, C. (2024). Sam 2: Segment
anything in images and videos. arXiv preprint
arXiv:2408.00714.
Radford, A., Kim, J. W., Hallacy, C., Ramesh, A., Goh, G.,
Agarwal, S., ... & Sutskever, I. (2021, July). Learning
transferable visual models from natural language
supervision. In International conference on machine
learning (pp. 8748-8763). PMLR.
Cherti, M., Beaumont, R., Wightman, R., Wortsman, M.,
Ilharco, G., Gordon, C., ... & Jitsev, J. (2023).
Reproducible scaling laws for contrastive language-
image learning. In Proceedings of the IEEE/CVF
Conference on Computer Vision and Pattern
Recognition (pp. 2818-2829).
Ahmed, A. S., & Ibraheem, I. N. (2024, November). Recent
advances in content based image retrieval using deep
learning techniques: A survey. In AIP Conference
Proceedings (Vol. 3219, No. 1). AIP Publishing.
HEALTHINF 2025 - 18th International Conference on Health Informatics
424
