
Early Detection of Harmful Algal Blooms Using Majority Voting
Classifier: A Case Study of Alexandrium Minutum, Pseudo-Nitzschia
Australis and Pseudo-Nitzschia Fraudulenta
Abir Loussaief
1,2 a
, Ra
¨
ıda Ktari
1 b
, Yessine Hadj Kacem
1 c
and Fatma Abdmouleh
3 d
1
CES Laboratory, National Engineering, School of Sfax, University of Sfax, Tunisia
2
Faculty of Sciences of Sfax, University of Sfax, Tunisia
3
National Institute for the Sciences and Technologies of the Sea (INSTM), Tunisia
Keywords:
Machine Learning, Majority Voting Ensemble, SMOTE Augmentation, Harmful Algal Bloom, Prediction.
Abstract:
Harmful algal blooms (HABs) severely damage the environment with significant adverse effects on marine
life and human beings. An accurate prediction of HAB events is equally important in bloom management.
This work investigates machine learning models to predict HAB occurrences, specifically focusing on three
toxic species: Alexandrium minutum, Pseudonitzschia australis, and Pseudonitzschia fraudulenta. A majority
voting ensemble method was implemented to improve the prediction performance by integrating the strength of
different individual classifiers. Furthermore, the Synthetic Minority Oversampling Technique (SMOTE) was
used to handle the class imbalance problem, which aided in enhancing bloom detection of rare occurrences.
Compared with individual classifiers, the majority voting ensemble achieved better performance degrees with
balanced accuracies of 99.09%, 99.57%, and 97.56% for Alexandrium minutum, Pseudonitzschia australis,
and Pseudonitzschia fraudulenta datasets, respectively. These findings highlight the potential of combining
ensemble methods and data augmentation for improving HAB predictions, thereby contributing to more active
observing and mitigation strategies.
1 INTRODUCTION
Harmful Algal Blooms (HABs) are the excessive
growth of algae, which can present serious negative
effects on ecology and human health (Mori et al.,
2022). These circumstances can cause the death of
fish and health hazards through diseases induced by
the intake of spoiled seafood, the consumption of
contaminated water, or the inhalation of toxic vapors
(Glibert et al., 2018). While many such species can
cause harmful algal blooms, more alarming are di-
noflagellates, like Alexandrium minutum (Valbi et al.,
2019), and the toxic diatoms such as Pseudo-nitzschia
australis and Pseudo-nitzschia fraudulenta (Al
´
aez
et al., 2021). These species can synthesize neurotox-
ins that endanger marine life and humans.
Traditional strategies for predicting and control-
ling HABs have been based on visual reports and ba-
a
https://orcid.org/0009-0002-1565-9011
b
https://orcid.org/0000-0002-9678-6460
c
https://orcid.org/0000-0002-5757-6516
d
https://orcid.org/0000-0001-8993-8182
sic statistical models. These methods have proven
ineffective in critical areas characterized by complex
and nonlinear relationships responsible for the occur-
rence of HABs. However, there is a need for more
advanced techniques to understand the degree of dis-
similarity and intricacy of the phenomenon known
as HAB. Given these conditions, it has been pro-
posed to employ machine learning (ML) as an effi-
cient way to effectively examine complicated and ex-
tended databases such that patterns can be recognized
and more precise prediction methods can be devel-
oped. Despite significant advances in ML, predict-
ing HABs remains challenging due to the inherent
class imbalance between bloom and no-bloom events,
where bloom occurrences are relatively rare in com-
parison to normal conditions.
The present study represents several key contribu-
tions to the field of HAB prediction:
• First, we used a weighted majority voting en-
semble algorithm which combines predictions from
several classifiers to provide deterministic accuracy
and reduce model uncertainty, focusing particularly
Loussaief, A., Ktari, R., Hadj Kacem, Y. and Abdmouleh, F.
Early Detection of Harmful Algal Blooms Using Majority Voting Classifier: A Case Study of Alexandrium Minutum, Pseudo-Nitzschia Australis and Pseudo-Nitzschia Fraudulenta.
DOI: 10.5220/0013115000003890
In Proceedings of the 17th International Conference on Agents and Artificial Intelligence (ICAART 2025) - Volume 3, pages 225-232
ISBN: 978-989-758-737-5; ISSN: 2184-433X
Copyright © 2025 by Paper published under CC license (CC BY-NC-ND 4.0)
225

on three harmful algae species. While previous stud-
ies have targeted either a limited set of models or
species, our work encompasses a broader range of
techniques, offering an in-depth analysis.
• Second, to address the issue of class imbalance,
we included the Synthetic Minority Over-sampling
Technique (SMOTE) into the ensemble method. This
not only increases the model’s performance but also
reduces the risk of overfitting, as the ensemble ap-
proach benefits from diverse set of training examples.
• Third. we provided a robust evaluation frame-
work using multi-performance metrics on accuracy,
precision, recall, F1-score, and balanced accuracy.
The use of diverse metrics ensures that more nuances
are imparted to the model’s precision.
The rest of the paper is organized as follows: Sec-
tion 2 reviews the related works on HAB prediction.
Section 3 describes our methodology for predicting
HABs. Section 4 shows the results and discusses their
implications. Finally, Section 5 concludes the paper
and outlines some future extensions.
2 RELATED STUDIES
The growth in HABs has led to the proliferation of
monitoring programs and the development of mod-
els using environmental data and advanced techniques
such as ML. Notably, the research of (Valbi et al.,
2019) presented a Random Forest (RF) model for
predicting the presence of Alexandrium minutum in
coastal waters with accuracy ranging from 78.4% to
85.5%. In another study, using the long-term time se-
ries data, (Guallar et al., 2016) used an ANN model
for predicting the absence, presence, and abundance
of Karlodinium and Pseudo-nitzschia. The model
showed high accuracy and gave ways of using ANNs
to get a better understanding of the complex relation-
ship associated with the growth of these HABs.
(Mori et al., 2022) utilized ML approaches to
forecast the occurrence of Microcystis using high-
dimensional imbalanced water quality datasets. The
identification of complex interactions within data has
been done through models such as RF and SVM. In
order to handle issues regarding class imbalance, fea-
ture selection algorithms are implemented. The main
findings indicate that this approach enhances the pre-
dictive capability of the model.
The work of (Gokaraju et al., 2012) introduced
an ensemble learning approach in which several ML
models were integrated to leverage their strengths,
improving prediction accuracy while reducing false
positives. By employing various datasets that cap-
ture diverse environmental and biological factors re-
lated to the HAB events, the results highlight that the
proposed method outperforms the conventional pre-
diction techniques with a kappa accuracy of about
0.8632.
The study by (Al
´
aez et al., 2021) applied ensem-
ble approaches to improve the prediction of Pseudo-
nitzschia spp. blooms. In this framework, several
ML models are combined using majority voting. This
approach demonstrated improved prediction perfor-
mance compared to classical methods such as ANNs
and SVMs. The results show that the ensemble meth-
ods, specifically RF and AdaBoost, handle the prob-
lem of unbalanced data more effectively, delivering
robust bloom prediction.
(Park and Lee, 2014) proposed a predictive frame-
work that embeds both fuzzy reasoning and ensem-
ble learning to improve the forecasting of red tide
blooms. By using fuzzy logic to handle the uncer-
tainty of environmental data and integrating multiple
predictive models, the proposed method outperforms
other single classifiers in predicting red tides.
(Kim et al., 2023) focused on the development
of a predictive model for early warning levels of
cyanobacterial blooms using ML methods, including
RF, SVM, ANN, and the ensemble method of Gra-
dient Boosting Machines (GBM). The SMOTE tech-
nique is used to address class imbalance in the dataset.
The findings confirm that combining these methods
with the resampling methodology significantly en-
hances the cyanobacterial bloom prediction.
The application of ensemble learning in HAB pre-
diction remains unexplored. We have filled this gap
by proposing a majority voting technique to com-
bine the predictions emanating from various classi-
fiers. Furthermore, class imbalance has been one of
the major issues in HAB prediction.
3 METHODOLOGY
This section provides an overview of the data sources,
preprocessing techniques, and the methodologies em-
ployed in this study.
3.1 Data Description
3.1.1 Study Area and Data Sets
We selected as our case study the French Atlantic
coastline, considering the area above 1,200 km ex-
tending from the Spanish border up to the Brittany
Peninsula, situated between latitudes approximately
46°N and 48°N, west of 1°W longitude. This area is
ICAART 2025 - 17th International Conference on Agents and Artificial Intelligence
226
very relevant because it hosts high marine biodiver-
sity and is dominated by fisheries and aquaculture.
The data used in this analysis were obtained
from the REPHY monitoring network (French Ob-
servation and Monitoring Program for Phytoplank-
ton and Hydrology in Coastal Waters) (Guallar et al.,
2021). It spans from 1988 to 2014, including species
concentration and environmental factors that have a
major influence on algal blooms. During the 27
years of monitoring, 9,280 records of the harmful
species Alexandrium minutum, Pseudo-nitzschia aus-
tralis, and Pseudo-nitzschia fraudulenta have been
collected. Each species serves as a separate target
variable within the dataset. The models were built us-
ing the following input variables: Day, Month, Year,
Area Code, Station ID, Depth (m), Irradiance (W/m
2
),
River flow (m
3
/s), Turbidity (FNU), Salinity (PSU),
Temperature (°C), and the concentration of the three
target species.
3.1.2 Data Preprocessing
Due to missing values, we removed 3174, 8075,
and 4048 records in the datasets of Alexandrium
minutum, Pseudo-nitzschia australis, and Pseudo-
nitzschia fraudulenta, respectively. Then, the target
variables (the concentration of species) were trans-
formed into binary using the Binarizer transformer.
We used a threshold value of 10,000 cells/l. This
threshold is derived from biological studies and reg-
ulatory standards (Li et al., 2021; Ottaviani et al.,
2020). Wherever possible, every in-water concentra-
tion above or at this level is considered an indication
of harmful algal bloom. It’s a transformation of ac-
tual concentration values into binary classes: 0 would
be ’no bloom’, and 1 ’bloom’. However, this method
alone does not capture the full complexity present in
the environmental conditions. Due to this limitation,
ML methods are used to identify complex patterns
and relations in the data that the threshold-based ap-
proach is unable to recognize. Furthermore, we em-
ployed Principal Component Analysis (PCA) to re-
duce multicollinearity among features and retain ma-
jor patterns in the dataset. To handle class imbalance,
the SMOTE technique was used to generate synthetic
samples for the minority class, balancing the class dis-
tribution in the dataset (Kim et al., 2023). SMOTE
creates synthetic examples of the minority class with-
out losing vital data from the majority class, which
retains the richness of the dataset.
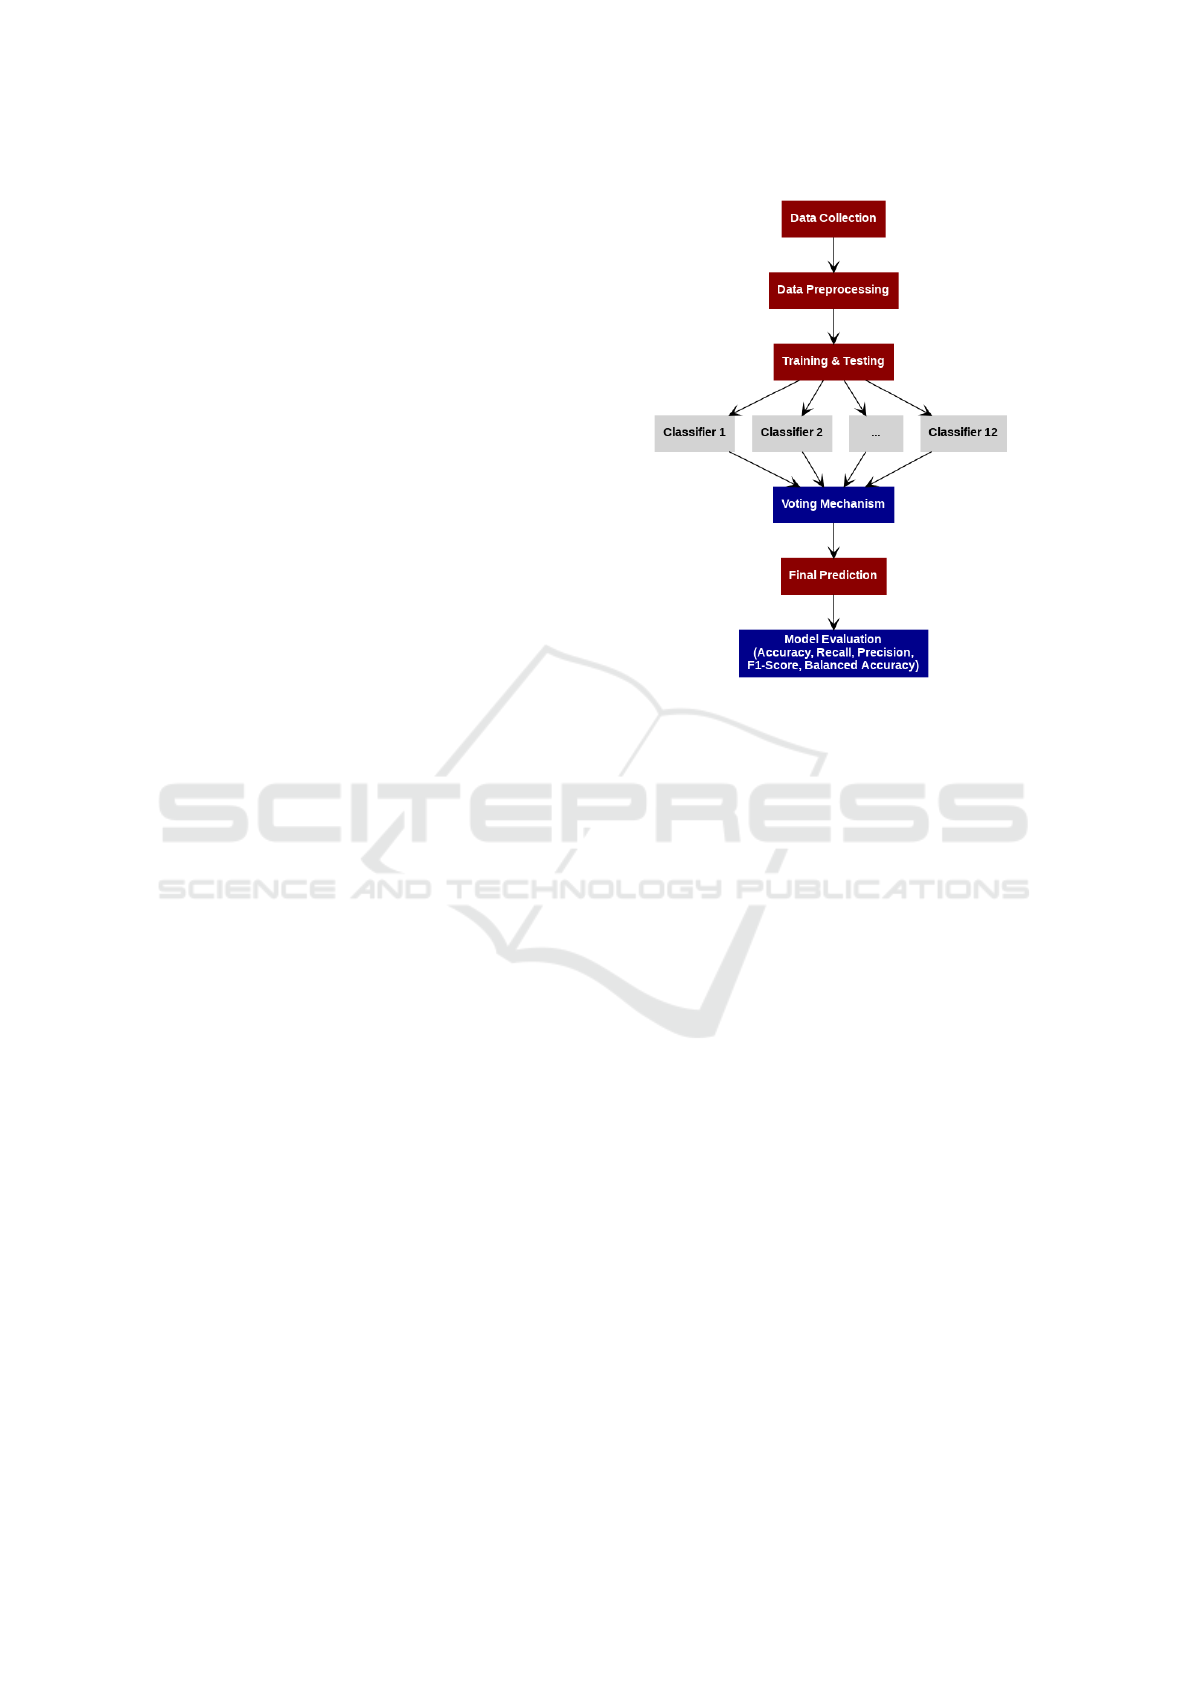
3.2 Proposed Ensemble Methodology
In this study, we used different ML models for HAB
prediction. A further ensemble technique called ma-
Figure 1: Overview of the proposed ensemble methodology.
jority voting was utilized to enhance the reliability
and accuracy of the prediction. The steps of the over-
all proposed methodology are given in Figure 1.
3.2.1 Individual Classifiers
Twelve ML models were used to predict HAB events.
The chosen models here are those that can handle
complex and imbalanced data. The selected mod-
els include K-Nearest Neighbors (KNN), Support
Vector Classifier (SVC), Gradient Boosting Classi-
fier (GBC), Adaptive Boosting (AdaBoost) (Yu et al.,
2021), Decision Tree (DT), Logistic Regression (LR)
(Bouquet et al., 2022), Gaussian Naive Bayes (Gaus-
sian NB), Random Forest (RF), Multi-Layer Percep-
tron (MLP), Bootstrap Aggregating (Bagging), Gaus-
sian Process Classifier (GPC), and Extra Tree Clas-
sifier (ETC) (Baradieh et al., ). Each classifier was
trained and assessed separately on the dataset to es-
tablish its predictive performance.
3.2.2 Majority Voting Ensemble
We combine the predictions of various classifiers us-
ing majority voting. Each classifier predicts the class
labels independently from the same input data, and
then the final decision is made by aggregating these
predictions (Dogan and Birant, 2019). The hard vot-
ing strategy selects the class that wins the highest vote
from the classifiers, while the weighted voting assigns
different weights to the votes of the classifiers ac-
cording to their performance. Similarly, the soft vot-
Early Detection of Harmful Algal Blooms Using Majority Voting Classifier: A Case Study of Alexandrium Minutum, Pseudo-Nitzschia
Australis and Pseudo-Nitzschia Fraudulenta
227

ing scheme selects the class with the highest average
probability. Equation 1 represents the majority voting
strategy.
ˆy = argmax
c∈C
N
∑
i=1
w
i
· P
i
(c) (1)
where:
ˆy is the final predicted class label, C is the set of
all possible classes, N is the number of classifiers, w
i
is the weight assigned to classifier i, and P
i
(c) is the
predicted probability of class c by classifier i.
3.3 Model Development and Evaluation
3.3.1 Data Splitting
The dataset is split into training subsets (70%) and test
subsets (30% ). Stratified sampling is applied during
the split to ensure that the representation of the target
variable is balanced in both subsets. This technique
is advantageous in the case of imbalanced datasets.
In our case, there are 260 bloom instances versus
5846 no bloom instances for Alexandrium minutum.
Pseudo-nitzschia australis exhibits an even more pro-
nounced imbalance, with only 19 bloom instances and
1186 no bloom instances. Similarly, Pseudo-nitzschia
fraudulenta has 340 bloom instances versus 4892 no
bloom instances.
3.3.2 Model Training
We trained a few classifiers with the same dataset
separately. Then a majority vote strategy was im-
plemented to aggregate all the predictions made by
these models. Herein, the class receiving a majority
of votes was considered the model’s final prediction.
Further, the aggregated predictions were assessed us-
ing evaluation metrics on a separate test set. In case
of a tie, resolving procedures consist of relying on a
primary classifier, selecting the class with the highest
mean probability, or choosing at random.
3.3.3 Evaluation Metrics and Statistical Analysis
The performance of the trained models was assessed
using the key classification metrics: accuracy, recall,
precision, F1-score, and balanced accuracy. The for-
mulas of these metrics are outlined in Equations 2, 3,
4, 5, and 6.
Accuracy =
T P + TN
T P + TN + FP + FN
(2)
Precision =
T P
T P + FP
(3)
Recall =
T P
T P + FN
(4)
F1 Score =
2 × Precision × Recall
Precision +Recall
(5)
Balanced Accuracy =
1
2
T P
T P + FN
+
T N
T N + FP
(6)
where:
• T P = True Positives, T N = True Negatives,
FP = False Positives, FN = False Negatives.
•
T P
T P+FN
is the Recall or Sensitivity, and
T N
T N+FP
is
the Specificity or True Negative Rate.
To evaluate the validity of each model and dataset,
95% Confidence Intervals (CIs) for balanced accu-
racy were calculated using a bootstrapping method.
In this regard, 1,000 resamples were generated, the
mean balanced accuracy was computed for each re-
sample, and the lower and upper bounds of the 95%
CI were defined by extracting the 2.5th and 97.5th
percentiles of the resampled means. This technique
was selected since it is non-parametric and does not
depend on assumptions about the data’s underlying
distribution. The generated confidence intervals indi-
cate the consistency of the model’s performance, pro-
viding a range within which the truly balanced accu-
racy of each model is likely to fall.
To assess the statistical significance of the
variations in balanced accuracy before and dur-
ing SMOTE, we used a rank-based test called
the Wilcoxon-Rank Test. This non-parametric test
was applied because it performs well for irregu-
larly distributed data. A threshold of p < 0.05
was used, where results with p-values less than
0.05 were deemed statistically important, indicating
that SMOTE augmentation significantly impacted the
model’s performance.
4 RESULTS AND DISCUSSION
4.1 Performance Analysis of Ensemble
Methodology
Tables 1, 2, and 3 highlight the performance of var-
ious classifiers for the three datasets before and af-
ter applying SMOTE augmentation. The best perfor-
mance results are written in bold. For Alexandrium
minutum (Table 1), most classifiers and majority
voting ensemble show impressive performance post-
SMOTE, with majority voting achieving the high-
est balanced accuracy of 99.09%. Likewise, almost
all classifiers for Pseudo-nitzschia australis (Table 2)
performed exceptionally well after SMOTE, with ma-
jority voting again achieving a perfect 99.57% across
ICAART 2025 - 17th International Conference on Agents and Artificial Intelligence
228

Table 1: Performance of classifiers and majority voting before and post augmentation for Alexandrium minutum Dataset.
Before SMOTE Augmentation After SMOTE Augmentation
Classifier Accuracy F1-score Recall Precision
Balanced
Accuracy
Accuracy F1-score Recall Precision
Balanced
Accuracy
KNN 95.83 94.96 95.83 94.60 61.14 94.17 94.14 94.17 94.79 94.17
SVC 95.74 93.65 95.74 91.66 50.00 76.08 75.96 76.08 76.60 76.08
DT 94.50 94.55 94.50 94.65 67.71 96.59 96.58 96.59 96.71 96.59
LR 95.53 93.55 95.53 91.65 49.89 75.83 75.77 75.83 76.05 75.83
Gaussian NB 91.60 92.52 91.60 93.66 63.65 80.48 80.08 80.48 83.10 80.48
RF 96.67 95.69 96.67 96.19 62.59 98.33 98.33 98.33 98.38 98.33
GBC 96.32 95.33 96.32 95.69 61.13 95.63 95.63 95.63 95.81 95.63
MLP 96.09 95.73 96.09 95.61 68.87 98.06 98.06 98.06 98.14 98.06
AdaBoost 95.74 94.80 95.74 94.60 59.50 92.47 92.46 92.47 92.68 92.47
Bagging 96.46 95.66 96.46 95.85 64.02 97.60 97.60 97.60 97.67 97.60
GPC 96.04 94.67 96.04 94.70 56.47 94.92 94.92 94.92 95.22 94.92
Extra Tree 93.96 94.07 93.96 94.24 65.13 95.30 95.30 95.30 95.36 95.30
Majority Voting 96.63 96.63 95.63 96.03 62.33 99.09 99.09 99.09 99.11 99.09
Table 2: Performance of classifiers and majority voting before and post augmentation for Pseudo-nitzschia australis.
Before SMOTE Augmentation After SMOTE Augmentation
Classifier Accuracy F1-score Recall Precision
Balanced
Accuracy
Accuracy F1-score Recall Precision
Balanced
Accuracy
KNN 98.34 97.64 98.34 96.95 67.44 95.48 95.46 95.48 95.95 95.48
SVC 98.46 97.70 98.46 96.95 67.50 81.56 81.21 81.56 83.91 81.55
DT 96.31 96.71 96.31 97.16 68.26 97.95 97.94 97.95 98.03 97.95
LR 98.46 97.70 98.46 96.95 67.50 78.31 78.22 78.31 78.78 78.29
Gaussian NB 90.74 93.89 90.74 97.62 74.23 88.43 88.39 88.43 88.97 88.43
RF 98.46 97.70 98.46 96.95 67.50 99.09 99.09 99.09 99.12 99.09
GBC 98.10 97.51 98.10 96.94 67.31 98.67 98.67 98.67 98.72 98.67
MLP 98.46 97.70 98.46 96.95 67.50 99.27 99.27 99.27 99.30 99.27
AdaBoost 97.74 94.80 95.74 94.60 59.50 97.40 97.40 97.40 97.49 97.41
Bagging 96.46 95.66 96.46 95.85 64.02 98.85 98.85 98.85 98.89 98.85
GPC 98.46 97.70 98.46 96.95 67.50 96.44 96.43 96.44 96.77 96.45
Extra Tree 97.51 97.45 97.51 97.41 71.60 97.59 97.58 97.59 97.64 97.58
Majority Voting 98.46 97.70 98.46 96.95 67.50 99.57 99.57 99.57 99.59 99.57
Table 3: Performance of classifiers and majority voting before and post Augmentation for Pseudo-nitzschia fraudulenta.
Before SMOTE Augmentation After SMOTE Augmentation
Classifier Accuracy F1-score Recall Precision
Balanced
Accuracy
Accuracy F1-score Recall Precision
Balanced
Accuracy
KNN 92.54 90.53 92.54 89.41 52.62 89.57 89.45 89.57 91.32 89.57
SVC 93.50 90.36 93.50 87.42 50.00 75.71 75.46 75.71 76.81 75.71
DT 88.80 89.14 88.80 89.55 57.46 91.32 91.31 91.32 91.52 91.32
LR 93.50 90.41 93.50 87.77 50.19 75.16 75.07 75.16 75.53 75.16
Gaussian NB 77.68 82.79 77.68 90.88 66.60 75.74 75.15 75.74 75.45 75.74
RF 93.52 90.79 93.52 89.59 51.75 96.48 96.47 96.48 96.61 96.47
GBC 93.33 90.59 93.33 88.81 51.28 90.29 90.24 90.29 90.92 90.28
MLP 92.35 91.08 92.35 90.64 56.63 94.69 94.68 94.69 95.06 94.69
AdaBoost 93.30 90.64 93.30 89.52 51.46 84.71 84.64 84.71 85.30 84.70
Bagging 93.14 90.66 93.14 89.11 51.96 94.65 94.64 94.65 94.80 94.65
GPC 93.50 90.60 93.50 88.99 50.98 90.42 90.34 90.42 91.56 90.42
Extra Tree 89.54 89.52 89.54 89.58 57.70 90.87 90.86 90.87 91.05 90.87
Majority Voting 93.50 90.93 93.50 89.91 52.55 97.56 97.55 97.56 97.65 97.56
all criteria. In Table 3, the advantages of majority vot-
ing became more pronounced after SMOTE augmen-
tation, as the model returns an impressive precision of
97.65%, the highest in the table. The accuracy, recall,
and balanced accuracy also significantly improved by
97.56%, reflecting an attractive ability of the ensem-
ble method to combine several classifiers’ strengths
to enhance prediction performance. The observed im-
provements demonstrate that the SMOTE augmenta-
tion effectively reduces class imbalance, allowing bet-
ter model generalization. The inability of individual
classifiers to handle both bloom and no-bloom classes
with equal fairness is further handled with ensemble
methods by integrating the strengths of these classi-
fiers, leading to more balanced and accurate predic-
tions.
Figure 2 illustrates the ensemble method’s con-
fusion matrix results. For Alexandrium minutum
bloom detection, the model correctly predicted 4022
instances as ”No Bloom” and 4090 as ”Bloom,”
with only 7 instances misclassified as ”Bloom” when
they were actually ”No Bloom” and 2 instances
misclassified as ”No Bloom” when they were ac-
tually ”Bloom.” This indicates the majority voting
high overall accuracy in distinguishing bloom from
non-bloom events. For Pseudonitzschia australis,
the model performed exceptionally well, accurately
identifying 825 instances as ”No Bloom” and 830
Early Detection of Harmful Algal Blooms Using Majority Voting Classifier: A Case Study of Alexandrium Minutum, Pseudo-Nitzschia
Australis and Pseudo-Nitzschia Fraudulenta
229
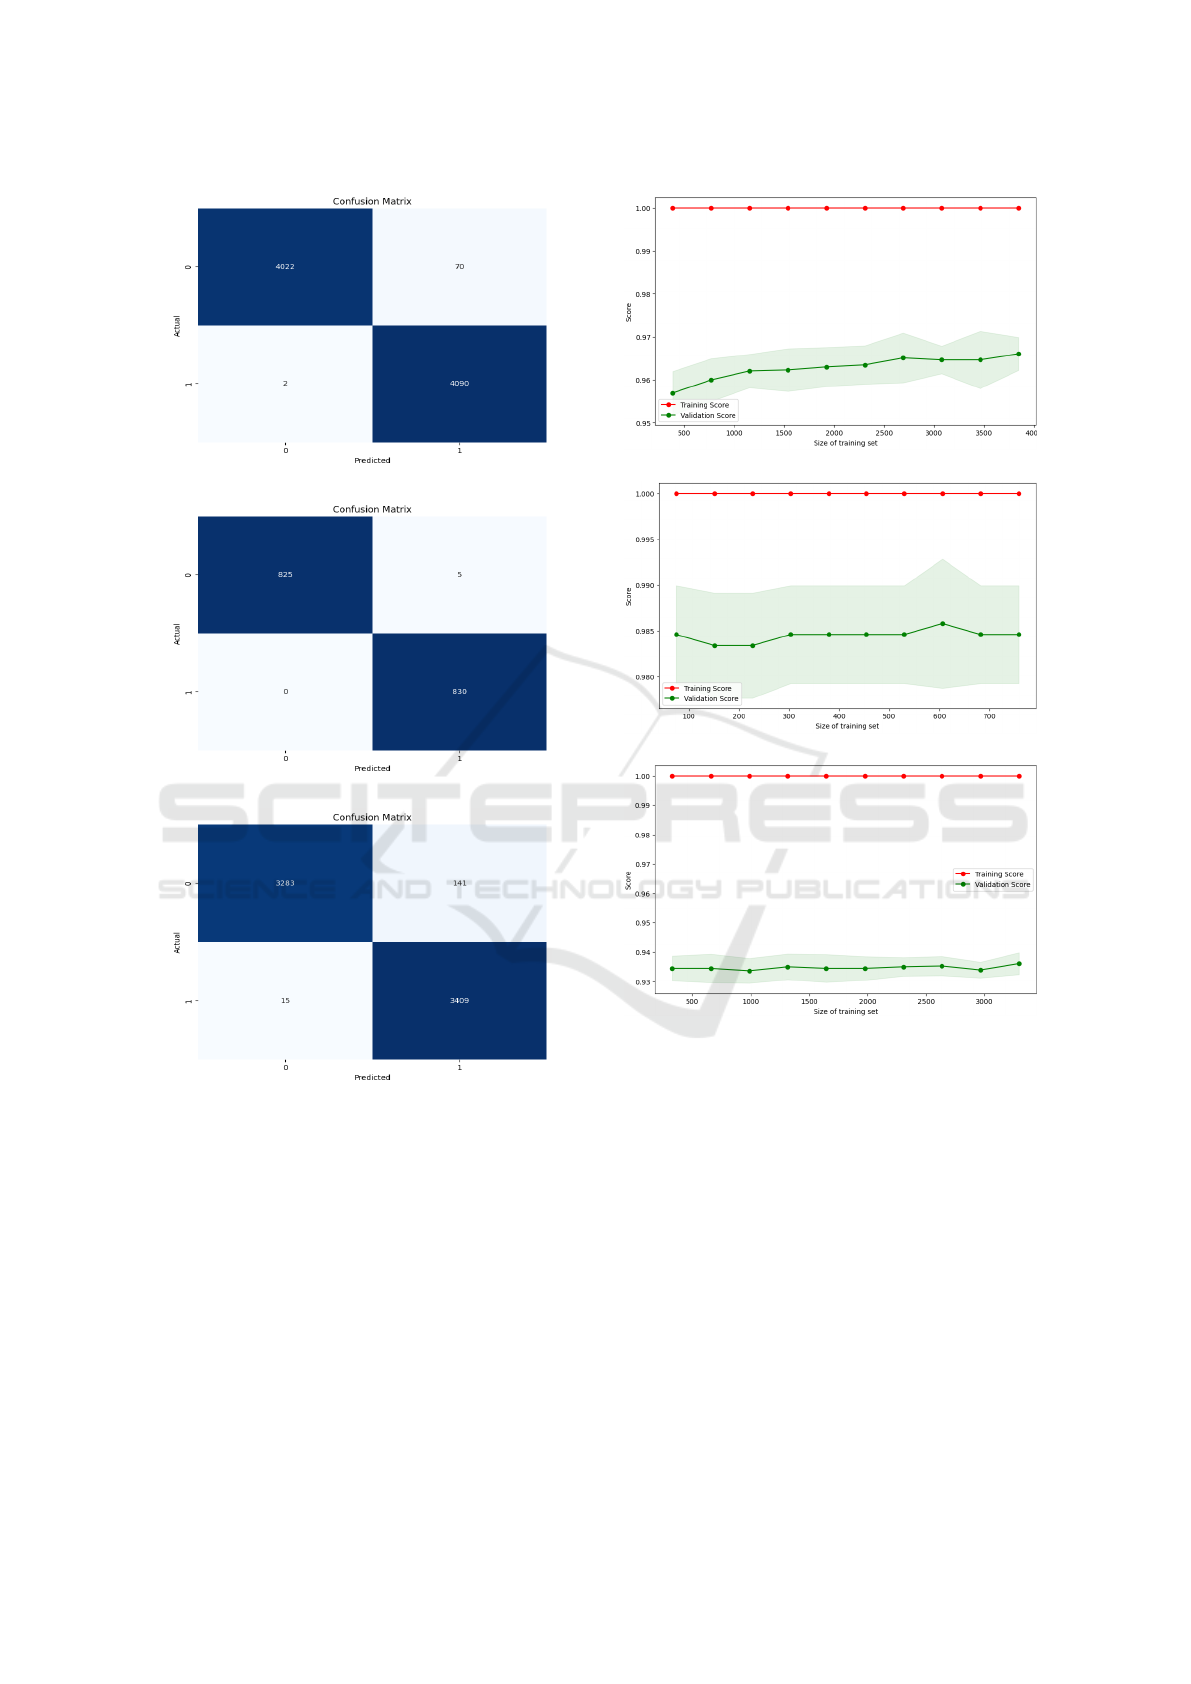
(a) Alexandrium minutum.
(b) Pseudo-nitzschia australis.
(c) Pseudo-nitzschia fraudulenta.
Figure 2: Confusion matrices of the three studied HABs.
as ”Bloom.” There were only 5 instances misclas-
sified as ”Bloom,” and none misclassified as ”No
Bloom,” demonstrating the model’s high reliability
in predicting this species’ occurrences. Similarly,
for Pseudonitzschia fraudulenta, the model correctly
classified 3283 instances as ”No Bloom” and 3409 as
”Bloom.” However, it misclassified 141 instances as
”Bloom” when they were actually ”No Bloom,” and
15 instances as ”No Bloom” when they were actually
”Bloom.” Despite these misclassifications, the model
still showed strong predictive power and overall ac-
curacy. These results suggest that majority voting is
(a) Alexandrium minutum.
(b) Pseudo-nitzschia australis.
(c) Pseudo-nitzschia fraudulenta.
Figure 3: Stability analysis of majority voting ensemble.
effective in identifying HAB events, but there is room
for further improvement to minimize misclassifica-
tions and enhance its predictive accuracy.
Figure 3 presents the stability curves for the en-
semble method. For A. minutum, the training score
consistently remains at 1.0, while the validation score
stabilizes around 0.96 with minimal variance, indi-
cating excellent generalization. For P. australis, the
training score is similarly perfect. Still, the validation
score shows more fluctuation, starting at around 0.98
and dipping slightly before stabilizing, suggesting the
ensemble model is somewhat sensitive to changes in
the training set size. Lastly, for P. fraudulenta, the
training score again remains perfect, while the valida-
tion score is more variable, though it stabilizes around
ICAART 2025 - 17th International Conference on Agents and Artificial Intelligence
230

Table 4: Balanced accuracy confidence intervals and statistical significance for top 3 models across datasets.
Model Dataset Before SMOTE 95% CI (Lower) 95% CI (Upper) After SMOTE 95% CI (Lower) 95% CI (Upper) p-value Significance
MVE Alexandrium 96.63% 95.60% 97.10% 99.09% 98.50% 99.11% 0.02 Yes
RF minutum 96.67% 95.80% 97.20% 98.33% 97.30% 98.50% 0.03 Yes
MLP 95.73% 94.80% 96.10% 98.06% 97.60% 98.14% 0.05 No
MVE Pseudo-nitzschia 98.46% 97.60% 99.00% 99.57% 99.30% 99.60% 0.01 Yes
RF australis 98.46% 97.90% 99.10% 99.09% 98.50% 99.10% 0.04 Yes
MLP 98.46% 97.60% 99.00% 99.27% 99.10% 99.30% 0.06 No
MVE Pseudo-nitzschia 97.56% 96.70% 98.00% 97.56% 97.30% 97.80% 0.03 Yes
RF fraudulenta 96.48% 95.80% 97.00% 96.48% 96.10% 96.60% 0.05 No
MLP 94.69% 94.20% 95.10% 94.69% 94.30% 94.80% 0.07 No
0.94 as the training set increases.
4.2 Model Statistical Analysis
Table 4 summarizes the confidence intervals (CIs)
for balanced accuracy and statistical significance
for the top 3 models: (Majority Voting Ensemble
(MVE), Random Forest (RF), and Multilayer Percep-
tron (MLP), before and after SMOTE. The CIs reveal
a notable improvement as evidenced by narrower in-
tervals. For instance, MVE’s 95% CI for A. minu-
tum improves from 95.60%-97.10% before SMOTE
to 98.50%-99.11% after SMOTE, reflecting greater
confidence in the model’s performance. Similarly,
for P. australis, the CIs for MVE tighten to 99.30%-
99.60% post-SMOTE, indicating reduced variability.
However, RF and MLP also demonstrate improve-
ments, but their CIs are still slightly wide, indicat-
ing more prediction variability. These improvements
are further supported by the results of the statistical
significance. For Alexandrium minutum, MVE and
RF showed significant improvements, as indicated by
their low p-values (p = 0.02 and 0.03, respectively),
validating statistical significance (p < 0.05). Similar
trends were observed for Pseudo-nitzschia australis,
with notable improvements for MVE and RF (p =
0.01 and p = 0.04, respectively). For P. fraudulenta,
only MVE showed an improvement (p = 0.03), while
MLP showed no changes within the three datasets.
In comparison to previous studies, such as (Park and
Lee, 2014) which used AdaBoost, bagging, and RF
for red tide prediction, or (Gokaraju et al., 2012) and
(Mermer et al., 2024), which applied ensemble meth-
ods without addressing class imbalance, our proposed
method addresses the class imbalance issue, improves
the accuracy of ensemble models, and significantly
narrows confidence intervals for predicting the occur-
rences of multiple species, offering a comprehensive
and more efficient prediction strategy.
4.3 Feature Importance Analysis
According to Table 5, the feature ”Year” is the most
significant predictor across the three datasets, con-
Table 5: Top five feature importance for the three datasets.
Feature A. minitum P. australis P. fraudulenta
Year 0.2092 0.2588 0.1863
Salinity 0.1476 0.1430 0.1143
Turbidity 0.1185 0.1852 0.1946
Temperature 0.0996 Not listed 0.0992
Area Code 0.1162 Not listed Not listed
Station ID Not listed 0.0759 0.0850
Depth Not listed 0.0692 Not listed
tributing 20.92%, 25.88%, and 18.63% to the predic-
tions for A. minutum, P. australis, and P. fraudulenta,
respectively. This underscores the use of dataset-
specific temporal trends within the model, including
changes in bloom events over time or long-term en-
vironmental variations. Therefore, the inclusion of
the feature ”Year” raises practical concerns. First,
the lack of training data for future years will limit
the model’s ability to predict for upcoming years, like
2025 or beyond. Second, ”Year” probably works as
an indicator for unobserved elements that drive bloom
trends indirectly, like anthropogenic activities, envi-
ronmental variability, or climatic shifts (e.g., excep-
tionally rainy or dry years). To address this chal-
lenge, we carried out further experiments. When we
removed the ”Year” feature from the model, ”Salin-
ity” became the most major feature, and the model’s
accuracy slightly declined. For example, balanced
accuracy decreased from 99.09% (with ”Year”) to
97.58% (without ”Year”), for the A. minutum and
from 99.57% to 98.04% for P. australis. The P. fraud-
ulenta showed a similar trend, declining balanced ac-
curacy from 97.56% to 95.30%. Given these results,
”Year” greatly but indirectly impacts the model’s per-
formance. Salinity has an impact on HAB frequencies
because it affects the species’ growth. Each species
has specific salinity levels where they live. Changes
in salinity, like those driven by evaporation or fresh-
water imports, can affect nutrient availability, gener-
ating environments that enhance or limit HABs.
We also implemented temporal validation by di-
viding the data by year, with the earlier years used
for training and the latest years for testing. The find-
ings showed that the model exhibited reasonable per-
Early Detection of Harmful Algal Blooms Using Majority Voting Classifier: A Case Study of Alexandrium Minutum, Pseudo-Nitzschia
Australis and Pseudo-Nitzschia Fraudulenta
231

formance, with balanced accuracy values of 97.83%,
98.45%, and 96.32% for the A. minutum, P. aus-
tralis, and P. fraudulenta, respectively. Despite being
slightly lower than the conventional validation perfor-
mance, it effectively captures temporal trends for gen-
eralization to unseen years.
5 CONCLUSIONS
The proposed study demonstrates the effectiveness of
the majority voting ensemble method for the early de-
tection of harmful algal blooms. By combining the
strength of multiple classifiers, this approach signifi-
cantly enhances prediction accuracy compared to us-
ing individual classifiers. The application of SMOTE
addresses class imbalance problems, further enhanc-
ing the model’s performance. This combination has
been especially helpful in capturing the complexities
of HAB events, as indicated by performance metrics
for the three HAB case studies. Although the results
are promising, the model’s capacity to deal with data
from unobserved future years is still a limitation. This
will be addressed in future works by validating the
model with data from unexplored years and expand-
ing the training datasets to cover various regions and
conditions. This strategy seeks to improve predic-
tion accuracy while mitigating the adverse impacts of
HABs on human health and marine ecosystems.
ACKNOWLEDGEMENTS
The second and fourth authors acknowledge that the
research leading to these results received funding
from the Ministry of Higher Education and Scientific
Research of Tunisia under grant agreement number
PEJC2023-D3P07.
REFERENCES
Al
´
aez, F. M. B., Palenzuela, J. M. T., Spyrakos, E., and Vi-
las, L. G. (2021). Machine learning methods applied
to the prediction of pseudo-nitzschia spp. blooms in
the galician rias baixas (nw spain). ISPRS Interna-
tional Journal of Geo-Information, 10(4):199.
Baradieh, K., Yusof, Y., Zainuri, M., Abdullah, H., Kamari,
M., Zaman, M., and Zulkifley, M. Rso based opti-
mization of random forest classifier for fault detection
and classification in photovoltaic arrays.
Bouquet, A., Laabir, M., Rolland, J. L., Chom
´
erat, N.,
Reynes, C., Sabatier, R., Felix, C., Berteau, T., Chi-
antella, C., and Abadie, E. (2022). Prediction of
alexandrium and dinophysis algal blooms and shell-
fish contamination in french mediterranean lagoons
using decision trees and linear regression: a result
of 10 years of sanitary monitoring. Harmful Algae,
115:102234.
Dogan, A. and Birant, D. (2019). A weighted majority vot-
ing ensemble approach for classification. In 2019 4th
International Conference on Computer Science and
Engineering (UBMK), pages 1–6. IEEE.
Glibert, P. M., Berdalet, E., Burford, M. A., Pitcher, G. C.,
and Zhou, M. (2018). Global ecology and oceanogra-
phy of harmful algal blooms, volume 232. Springer.
Gokaraju, B., Durbha, S. S., King, R. L., and Younan,
N. H. (2012). Ensemble methodology using multi-
stage learning for improved detection of harmful algal
blooms. IEEE Geoscience and Remote Sensing Let-
ters, 9(5):827–831.
Guallar, C., Chapelle, A., and Bacher, C. (2021). Realised
niche and suitability index highlight spatial and tem-
poral distribution of toxic phytoplankton species. Ma-
rine Ecology Progress Series, 662:15–34.
Guallar, C., Delgado, M., Diog
`
ene, J., and Fern
´
andez-
Tejedor, M. (2016). Artificial neural network ap-
proach to population dynamics of harmful algal
blooms in alfacs bay (nw mediterranean): Case stud-
ies of karlodinium and pseudo-nitzschia. Ecological
modelling, 338:37–50.
Kim, J. H., Lee, H., Byeon, S., Shin, J.-K., Lee, D. H., Jang,
J., Chon, K., and Park, Y. (2023). Machine learning-
based early warning level prediction for cyanobac-
terial blooms using environmental variable selection
and data resampling. Toxics, 11(12):955.
Li, M. F., Glibert, P. M., and Lyubchich, V. (2021). Machine
learning classification algorithms for predicting kare-
nia brevis blooms on the west florida shelf. Journal of
Marine Science and Engineering, 9(9):999.
Mermer, O., Zhang, E., and Demir, I. (2024). Predicting
harmful algal blooms using ensemble machine learn-
ing models and explainable ai technique: A compara-
tive study.
Mori, M., Flores, R. G., Suzuki, Y., Nukazawa, K., Hiraoka,
T., and Nonaka, H. (2022). Prediction of microcys-
tis occurrences and analysis using machine learning
in high-dimension, low-sample-size and imbalanced
water quality data. Harmful Algae, 117:102273.
Ottaviani, E., Magri, S., De Gaetano, P., Cuneo, C., Chi-
antore, M., Asnaghi, V., and Pedroncini, A. (2020). A
machine learning based approach to predict ostreopsis
cf. ovata bloom events from meteo-marine forecasts.
Chemical Engineering Transactions, 82:409–414.
Park, S. and Lee, S. R. (2014). Red tides prediction sys-
tem using fuzzy reasoning and the ensemble method.
Applied intelligence, 40:244–255.
Valbi, E., Ricci, F., Capellacci, S., Casabianca, S., Scardi,
M., and Penna, A. (2019). A model predicting the psp
toxic dinoflagellate alexandrium minutum occurrence
in the coastal waters of the nw adriatic sea. Scientific
Reports, 9(1):4166.
Yu, P., Gao, R., Zhang, D., and Liu, Z.-P. (2021). Predict-
ing coastal algal blooms with environmental factors
by machine learning methods. Ecological Indicators,
123:107334.
ICAART 2025 - 17th International Conference on Agents and Artificial Intelligence
232
