
HoloGraphs: An Interactive Physicalization for Dynamic Graphs
Daniel Pahr
a
, Henry Ehlers
b
and Velitchko Filipov
c
TU Wien, Austria
Keywords:
Physicalization, Fabrication, Information Visualization, Dynamic Networks.
Abstract:
We present HoloGraphs, a novel approach for physically representing, explaining, exploring, and interacting
with dynamic networks. HoloGraphs addresses the challenges of visualizing and understanding evolving net-
work structures by providing an engaging method of interacting and exploring dynamic network structures
using physicalization techniques. In contrast to traditional digital interfaces, our approach leverages tangible
artifacts made from transparent materials to provide an intuitive way for people with low visualization literacy
to explore network data. The process involves printing network embeddings on transparent media and assem-
bling them to create a 3D representation of dynamic networks, maintaining spatial perception and allowing the
examination of each timeslice individually. Interactivity is envisioned using optional Focus+Context layers
and overlays for node trajectories and labels. Focus layers highlight nodes of interest, context layers provide an
overview of the network structure, and global overlays show node trajectories over time. In this paper, we out-
line the design principles and implementation of HoloGraphs and present how elementary digital interactions
can be mapped to physical interactions to manipulate the elements of a network and temporal dimension in an
engaging matter. We demonstrate the capabilities of our concept in a case study. Using a dynamic network of
character interactions from a popular book series, we showcase how it represents and supports understanding
complex concepts such as dynamic networks.
1 INTRODUCTION
Dynamic network visualization aims to support ex-
tracting insights and making sense of dynamically
changing network structures (Beck et al., 2017). Sub-
sequently, dynamic graphs and their visualization
have found common use across a variety of domains,
from the social sciences (Oelke et al., 2013), through
software engineering (Rufiange and Melanc¸on, 2014),
to metabolic pathway analysis (Rohrschneider et al.,
2010). Several approaches to visualizing such graphs
have been proposed, such as animated node-link di-
agrams (Hayashi et al., 2013), layered matrix repre-
sentations (Vehlow et al., 2013), integrated 1.5D rep-
resentations (Shi et al., 2015), or a superimposition
of multiple 2D embeddings from different points in
time (Filipov et al., 2024). With multiple embeddings
for each point in time, we can produce space-time
cubes (2D + t or 3D), that encode the temporal as-
pect in a third dimension. However, virtual 3D rep-
resentations suffer from occlusions, distortions, and
parallax effects (Bach et al., 2014). This can, in turn,
obscure the graph’s topology and change over time,
a
https://orcid.org/0000-0001-7313-3056
b
https://orcid.org/0000-0002-5994-1492
c
https://orcid.org//0000-0001-9592-2179
negatively impacting user perception and understand-
ing. In contrast, by arranging the slices side-by-side,
i.e. juxtaposing them, we lose the ability to perceive
nodes’ movement over time between the individual
timeslices (Beck et al., 2017; Ehlers et al., 2024a; Fil-
ipov et al., 2023a). A key benefit of data physicaliza-
tion is that we can examine 3D representations tangi-
bly and intuitively by physically manipulating them.
Research shows that certain drawbacks of 3D repre-
sentations on screens can be overcome by such physi-
calizations (Jansen et al., 2013). Specifically, research
regarding networks in physical space has focused on
both 2D embeddings with additional tactile encod-
ings (Drogemuller et al., 2021) as well as 3D em-
beddings with added interactivity (Bae et al., 2024).
Drogemuller et al.(Drogemuller et al., 2021) present
their findings about physicalized graphs being more
engaging and fun to interact with, compared to their
screen-based counterpart.
Given these outcomes regarding engagement and
fun, it is unsurprising that interactive data physi-
calizations have value particularly related to educa-
tion and visualization literacy (O’Malley and Fraser,
2004). Manipulable physical representations have
great value in educational settings, conceptually al-
lowing for greater engagement, understanding, and
Pahr, D., Ehlers, H. and Filipov, V.
HoloGraphs: An Interactive Physicalization for Dynamic Graphs.
DOI: 10.5220/0013116000003912
Paper published under CC license (CC BY-NC-ND 4.0)
In Proceedings of the 20th International Joint Conference on Computer Vision, Imaging and Computer Graphics Theory and Applications (VISIGRAPP 2025) - Volume 1: GRAPP, HUCAPP
and IVAPP, pages 859-866
ISBN: 978-989-758-728-3; ISSN: 2184-4321
Proceedings Copyright © 2025 by SCITEPRESS – Science and Technology Publications, Lda.
859

learning (Jansen et al., 2015; Jansen and Dragicevic,
2013; Pahr et al., 2024). We argue that there still
are numerous opportunities to leverage the unique
strengths of data physicalization to communicate
complex scientific phenomena and concepts, such as
dynamic graphs and space-time cubes.
We introduce a novel workflow to create interac-
tive, physical representations of dynamic networks.
We make this workflow accessible by moving the fo-
cus away from complex 3D-printing technologies and
toward widely and cheaply available materials that
can be assembled with various means. By printing
network embeddings on overhead projector slides, we
obtain transparent slices that can be assembled in par-
allel to create a 3D appearance: a HoloGraph. This
allows us to keep the spatial perception of the space-
time cube while enabling the examination of individ-
ual timeslices at any point. We divide each of the net-
work’s embeddings into focus slices that highlight and
track nodes of interest and context slices that depict
the contextual structure of the network at different
points in time. We also provide separate global slices
such as label overlays for nodes of interest and tra-
jectory overlays to track nodes’ movement over time.
The codebase, printable versions of our networks, as
well as 3D-printable meshes we used for our sculp-
tures, can be found online
1
. We present a demonstra-
tion of our approach’s utility in a case study, exploring
the evolving relationships of characters across books
of the “Harry Potter” series. In summary, the contri-
butions of this work are two-fold:
• We present the development of a novel workflow
with which to create physical and interactive repre-
sentations of dynamic graphs.
• We demonstrate HoloGraphs’ utility in a case study
to highlight the value and importance of engage-
ment when learning about concepts such as dy-
namic graphs.
2 RELATED WORK
Data Physicalization. Data physicalization trans-
forms abstract data into tangible forms, leveraging
the physical properties of artifacts and materials to
encode information (Jansen et al., 2015). This ap-
proach has shown promise in making data more ac-
cessible and engaging. For instance, 3D physical rep-
resentations can outperform their screen-based coun-
terparts in efficiency for certain tasks (Jansen et al.,
1
https://osf.io/4u2e9/?view only=
751235378e564086beee9de8d37a6686
2013). Furthermore, they can also enhance mem-
ory retention and engagement compared to virtual
approaches (Stusak et al., 2015; Hurtienne et al.,
2020). Data physicalization approaches often include
interactive elements (“hands-on”), allowing users to
engage with the data actively, performing common
tasks such as filtering and selecting interesting data
items (Brehmer and Munzner, 2013). For instance,
Vol2Velle (Stoppel and Bruckner, 2017) allows the
selection of transfer function parameters by rotating
disks. Similarly, in Volograms (Pahr et al., 2021) in-
dividual slices can be removed to be inspected indi-
vidually or to examine otherwise obstructed regions.
Schindler et al. (Schindler et al., 2020) propose the
use of color filters to allow the filtering of differ-
ent anatomical regions. Squishicalization (Pahr et al.,
5555) encodes scalar field data into elastic 3D-printed
sculptures. Bae et al. (Bae et al., 2024) propose a
pipeline for creating network physicalizations that al-
low simple interactions with the nodes of the network
using electrical circuitry.
Physicalizing Networks. Networks are powerful
structures used to model and visualize data as a set
of entities and relationships between them. They are
widely employed in different domains to help under-
stand connections, detect patterns, and identify influ-
ential actors (Lee et al., 2006; Jae-wook Ahn et al.,
2014). Physicalizing networks adds a tactile dimen-
sion to the data exploration and analysis process, en-
hancing accessibility for the visually impaired indi-
viduals (Drogemuller et al., 2021; McGookin et al.,
2010). Recent research investigates how combining
visual and haptic exploration of physical node-link
diagrams benefits the understanding of such struc-
tures (Drogemuller et al., 2021) and how physical-
ized networks can support a better spatial percep-
tion through tangible interactions (McGuffin et al.,
2023). There is growing interest in exploring 3D im-
mersive environments for network visualization (Kot-
larek et al., 2020; Sorger et al., 2019; Oh-Hyun Kwon
et al., 2016; Colin Ware et al., 2008; Filipov et al.,
2023b). Such novel representations and interaction
techniques promise new ways to engage with the data.
Integrating dynamic network visualization with data
physicalization offers a tangible, interactive method
to explore complex concepts such as evolving net-
work structures, and behavior over time, and identi-
fying patterns and trends. Existing physicalizations
of networks often focus on simple, static structures.
However, dynamic networks introduce an additional
layer of complexity, considering the temporal evo-
lution of the entities and their relationships; an as-
pect that is crucial for understanding behavior over
IVAPP 2025 - 16th International Conference on Information Visualization Theory and Applications
860

Figure 1: A HoloGraph. We display a dynamic graph by
producing and embedding the individual timeslices, print-
ing them on transparent media, and arranging them equally
spaced. An overlay shows interesting nodes’ trajectories
over time and per individual timeslice.
time (Jae-wook Ahn et al., 2014). Approaches typi-
cally tackle this problem by aggregating (or timeslic-
ing) the network’s temporal dimension (Archambault
et al., 2011; Bach et al., 2017), while continuous rep-
resentations (event-based) capture changes occurring
at finer temporal granularities (Simonetto et al., 2018;
Arleo et al., 2022; Filipov et al., 2024).
Accessible Fabrication. Digital fabrication, i.e. 3D
printing technology, is one of the most common ap-
proaches to creating 3D artifacts (Djavaherpour et al.,
2021). However, more affordable methods exist that
can make them accessible to a broader audience.
Stoppel and Bruckner (Stoppel and Bruckner, 2017),
for example, use transparent disks to create interac-
tive volume visualizations, while Pahr et al. (Pahr
et al., 2021) present hologram-like structures from
segmented volumetric data. Raidou et al. (Raidou
et al., 2020) demonstrate how volumetric data can
be printed on transparent material to create 3D sculp-
tures without the use of sophisticated technology and
Schindler et al. (Schindler et al., 2022) show methods
for creating nested paper structures for anatomical ed-
ucation. Such approaches do not require expensive
hardware or technology, resulting in more affordable
and accessible physical data representations.
3 HoloGraphs
The physicalization of node-link diagrams is conven-
tionally done using 3D-printing techniques (Bae et al.,
2024). However, such representations limit the num-
ber of nodes that can be printed and hence displayed
owing to the time and cost associated with 3D print-
ing; a limitation we here aim to side-step. Here, Pahr
et al. (Pahr et al., 2021) propose methods to process
and (interactively) display medical volumetric data
using regular printers and transparent printable me-
dia. Moreover, outside of the context of data physical-
ization, Filipov et al. (Filipov et al., 2024) describe a
method to visualize dynamic networks by projecting
the space-time cube embedding to a 2D representa-
tion. This 2D representation is an orthogonal projec-
tion of the network’s topology over time in order to
visualize node trajectories and behavior. Here, com-
bining these two approaches, we propose to show the
individual timeslices created by such a method in a
3D environment by printing each time-slice-subgraph
embedding on transparent media and arranging them
as parallel slices. To add interactivity, we propose the
use of various removeable overlays with which to dis-
play added context, draw focus, and provide global
characteristics of the data. Figure 2 provides a sim-
plified overview of the proposed process.
Definitions. Given a dynamic graph, formulated here
as a time-sliced graph G = (V
S
, E
S
, T), where V the
total set of nodes and E the total set of undirected
links across a set of timeslices T . For some timeslice
t ∈ T node-time-slice pairs (v
a
, t) and (v
b
, t) in V
S
are
connected by links E
S
⊆ V
S
× V
S
, where V
S
⊆ V × T .
For a set of focus nodes V
F
⊆ V , we aim to highlight
their position in the different timeslices over a dis-
joint set of context nodes V
C
⊆ V . First, the dynamic
super graph G (Figure 2a) is separated into its con-
stituent time-sliced subgraphs G
s
(Figure 2b). These
individual subgraphs are then each further broken up
into their individual Focus+Context subgraphs, G
sF
and G
sC
respectively, such that E
sF
= V
F
×V
F
, as well
as E
sC
= V
s
× V
C
(Figure 2c). These Focus+Context
subgraphs are then individually printed and mounted
in a physical rack, forming (together with an addi-
tional labeled overlay that is printed along nodes’
time-dependent trajectories) a tactile and interactive
dynamic graph physicalization: the HoloGraph (Fig-
ure 2d).
Virtual Embedding. The layout of the network is
computed using D3.js’s particle-based force-directed
layout algorithm (Bostock et al., 2011). Here, the key
challenge of laying out a dynamic network is to strike
a balance between having enough change in node
placement between timeslices to effectively reflect the
network’s evolution over time, while also restricting
said movement sufficiently in order to ensure layout
and network structure are still preserved. Brandes
et al. (Brandes et al., 2012) present several strategies
for doing so, most notably aggregation and anchor-
ing. In HoloGraphs we make use of an anchoring
HoloGraphs: An Interactive Physicalization for Dynamic Graphs
861
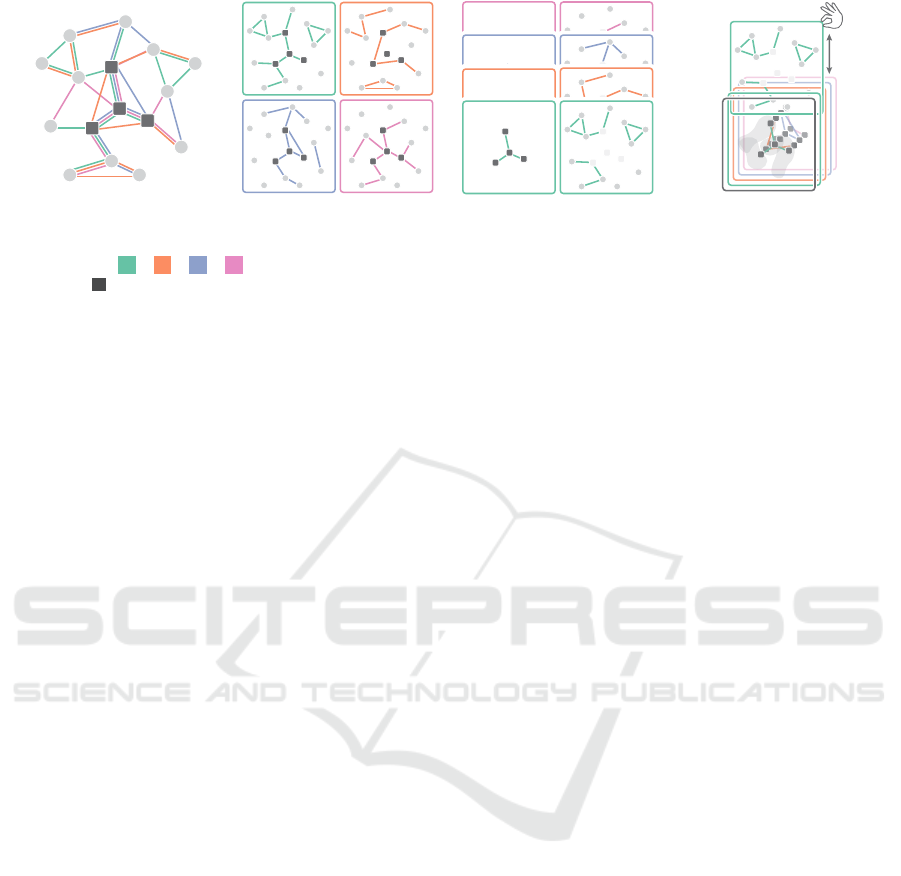
(a) Super Graph (b) Timeslice Subgraphs (c) Focus+Context Subgraphs
v
a
v
b
v
c
v
d
(d) HoloGraph
Figure 2: A dynamic graph (a), where connections between nodes and links differ between different points in time, is split up
into timeslices t
1
, t
2
, t
3
, t
4
, representing the state of the network at different points in time (b). To emphasize nodes
of interest ( x ), we divide the timeslices into focus (left) and context (right) subgraphs (c). Arranging the slices in parallel
creates a space-time cube appearance (d). Individual timeslices can be removed for inspection and global overlays show the
focus nodes’ movements over time. For illustration purposes and simplicity, each timeslice subgraph shares the same layout.
In practice, each timeslice subgraph is laid out semi-independently of the others, resulting in node movement between time
points.
approach to computing the layout of the dynamic net-
work: for each timeslice t, we utilize the layout of
the previous timeslice t − 1 as an initial layout before
commencing the layout process. This ensures that the
nodes’ movement over time will remain consistent
(i.e no flickering or popup effects) while preserving
the viewer’s mental map in the transitions from times-
lice to timeslice (Archambault and Purchase, 2013).
Here, the movement of the nodes between times-
lices depicts their trajectories over time as edges form
or dissolve, pulling or pushing the nodes, respectively,
reflecting the network’s evolving structure. In con-
trast, an aggregation approach, i.e. computing sin-
gular positions for each node based on the layout of
the super graph (Figure 2a), would result in no node
movement over time. Figure 3a shows an example
of the layouts of multiple timeslices overlaid on top
of each other and highlighting nodes’ movement over
time (orange lines), making it difficult to make sense
of changes over time. Instead, the focus nodes’ tra-
jectories, i.e. their movement between timeslices, can
be better perceived in Figure 3c.
Physical Embedding. Figure 1 shows our version
of a slide holder, used to stack the individual times-
lices printed on transparent media. To make sure
that our method supports a wide variety of fabrica-
tion techniques, we add manufacturing parameters
to the physical embeddings. The physical representa-
tion depends on the transparency and format of the
slides used. Additionally, the desired colors can be
chosen depending on the availability of color print-
ing.
First, we transform the node positions of the indi-
vidual timeslices for the physical embedding to the
format of the desired output. This corresponds to
the paper size, with additional margins that ensure
that the slide holders do not obscure any data. For
all timeslices, we calculate the minimum and maxi-
mum x and y positions of the nodes. We then map
the values to the space between the chosen margins.
We then create separate embeddings for the chosen
focus and context subgraphs. To emphasize nodes
of interest, the focused subgraph is embedded using
distinct node colors. In the context subgraph, we use
smaller node diameters and a lighter hue of gray to
avoid visual obstruction in the HoloGraph. The edge
weights are encoded into edge thickness in both sub-
graphs. Figure 3b shows both of these embeddings
superimposed. Printing the focus and context embed-
dings separately allows users to customize the rep-
resentation interactively. Figure 4a shows the inser-
tion or removal of a context slice from a HoloGraph.
Finally, we also create global overlays to trace the
movement of focus nodes over time, shown in Fig-
ure 3c. For this, we draw a polyline for each focus
node through all its positions in the timeslices. At the
node positions, we add a bright circle to emphasize
where the node can be found. Figure 4b shows the
process of adding this slice to the HoloGraph. We
create a separate overlay for node labels. This way
the labels can be removed freely, minimizing possible
obstructions as shown in Figure 4c.
4 CASE STUDY
To examine the potential of HoloGraphs, we present
a case study highlighting social network interactions
between characters in a famous children’s book se-
ries.
IVAPP 2025 - 16th International Conference on Information Visualization Theory and Applications
862

(a) Individual timeslices overlaid. (b) Focus + Context (c) Global overlays
Figure 3: Embeddings for individual timeslices, Focus + Context slices as well as Labels + Trajectories overlays. (a) The
embedding of the subsequent slice is dependent on the previous. Disappearing (1) and appearing (2) links and the subsequent
re-embedding causes movement of the nodes (3). (b) shows a superimposition of the focus subgraph, indicated by larger and
colored nodes, and the context subgraph with smaller, faint grey nodes for a single timeslice. (c) shows the global overlays
for focus node trajectories and labels.
Data. We use a dynamic network representing the
character interactions in the series of Harry Potter
books by J.K. Rowling
2
to show the capabilities of
our approach. The dataset is processed as a time-
sliced network, where the nodes represent the char-
acters in the books, and the weighted edges represent
the number of interactions between those characters
within each book. The individual timeslices represent
the state of the character interaction graph within each
book. We reduced the size of the original dataset to vi-
sualize the most central and influential actors as well
as the most important relationships. By filtering out
the links whose weights were not in the top 10 per-
centile we additionally reduce clutter and put an em-
phasis on the more important relationships between
the characters of the data. This process resulted in a
set of 111 nodes (characters) and 612 weighted edges
(relationships) over 7 timeslices (books). From these
110 nodes, ten focus nodes, i.e. “egos” (Ehlers et al.,
2024b), were selected (Figure 3c).
Implementation. Our pipeline’s virtual embedding
was done using d3.js (Bostock et al., 2011) and its
physical embedding using qt/python. For the focus
nodes, we use the top 10 nodes with the highest de-
gree centrality, present in each of the seven timeslices.
We used laser-printer-compatible overhead slides as
the medium for the slices. The slide holder and base
were 3D printed in a Prusa MK2S. To use the entire
printer surface, we decided to print the slices on half
of an A4 page, resulting in 2 slices per page. The
slices were attached to the holders using a hole punch
on both sides of each slide to keep them in place. The
2
https://github.com/nikhil-ravi/
harry-potter-interactions
slice holders fit into the left and right sides of the base,
ensuring slices remained parallel when mounted. Fig-
ure 1 shows a fully assembled HoloGraph, Figure 4
shows how different overlays are added or removed.
Findings. Using our Harry Potter HoloGraph, we
present some notable findings that can be extracted
from the time-sliced dynamic network. Our partic-
ipant had an interest in the Harry Potter series as
well as basic knowledge of node-link diagrams. They
were, however, unfamiliar with the concept of dy-
namic graphs. We then asked the participant to ex-
plore our HoloGraph, discussing notable events, char-
acter moments, and group interactions. We present
the insights, findings, and emphasize the reasoning
and suggestions we obtained with the goal of im-
proving our approach in communicating dynamic net-
works to non-expert audiences. The aim of our work
is to provide affordable data physicalizations to in-
crease knowledge and engagement using a hands-on
approach and interesting datasets.
Harry Potter, as the protagonist of all the books,
takes a stable position in the center of the graph.
His movements are minimal, however, we can ob-
serve how other nodes of interest behave in relation
to him. Rubeus Hagrid, for example, is a central char-
acter in the first books, often interacting with Harry
as his “window to the wizard world”, however, in
later books, he leaves the school and has other in-
teractions. While he remains tethered to Harry and
in a stable orbit around him, his other interactions
cause him to move away from the central set of char-
acters. Albus Dumbledore’s interactions with Harry
are often distant and occur at the end of the individ-
ual books. In books five and six, he becomes closer
associated with Harry, and they form a personal rela-
HoloGraphs: An Interactive Physicalization for Dynamic Graphs
863
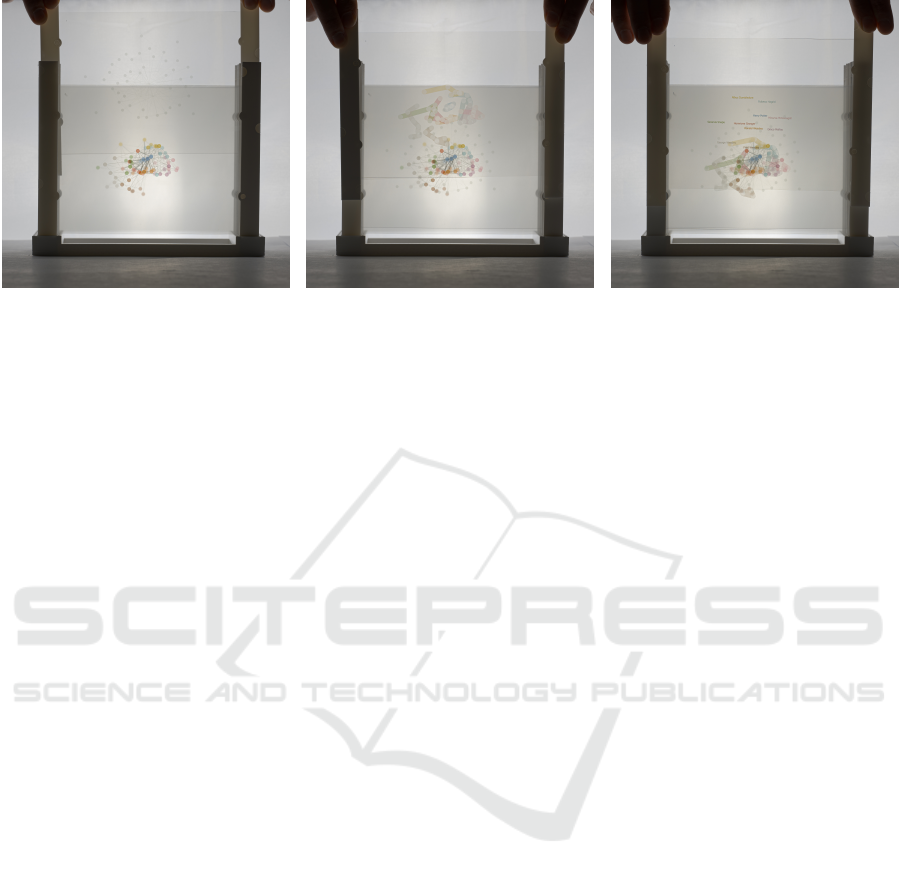
(a) Context slices (b) Trajectory overlay (c) Labels
Figure 4: Composition of a HoloGraph. Focus slices show the nodes of interest at every timeslice. Context slices can be
added to each focus slice individually (a). Node trajectories of focus nodes can be added as a global overlay (b), together with
focus node labels (c).
tionship, culminating in private tuition sessions. After
his departure from the active cast in the sixth book,
his node moves towards new characters related to his
backstory and away from the central set of charac-
ters. Fred and George Weasley are twins and are of-
ten shown in interactions together. This is supported
by their very similar, sometimes parallel trajectories.
They become separated close to the end of the last
book when Fred’s trajectory is a little shorter than
Georges’s. Finally, one of the most faceted charac-
ters, Severus Snape also has an interesting trajectory.
He spends most of the time in a stable position, close
to the center, as part of the “Hogwarts cluster’’. He
also joins another faction dedicated to the protection
of Harry in the later books, leading to continued prox-
imity. Finally, he changes factions again when his
node is pulled away from the other teachers in the
school and towards the antagonists. Issues The node
trajectories often point towards shifting associations
of the characters with different groups. However, in
the presented version of the Harry Potter HoloGraph,
these groups are not highlighted. Our expert recom-
mended visualizing these groups by highlighting per-
taining nodes in different colors in the context view.
Node trajectories could be easier explained by having
this added context. We also omitted different char-
acters in favor of readability. Our selection of nodes
of interest was purely based on node centrality. A
suggestion here was to emphasize a different selec-
tion of characters that interact in different ways with
the central characters. Notably, Voldemort, the pri-
mary antagonist of the story was not included in the
focus nodes for lack of centrality. Other nodes, such
as the love interests of different characters could have
interesting trajectories in conjunction with the associ-
ated characters. Finally, while the trajectory overlay
was overall helpful in finding nodes of interest in the
different timeslices, it led to some confusion. Our ex-
pert thought that a certain move of the node occurred
early on in the data, but noticed that the node was in a
different place than expected at that time. The partici-
pant suggested indicating a direction in the trajectory
lines, for example by narrowing the lines from first to
last timeslice.
5 CONCLUSIONS
Takeaways. Our work presents an accessible and
affordable way to create interactive physicalizations
of dynamic graphs. Our overarching goal is for this
approach to be applied to improve visualization liter-
acy and provide an engaging method for communi-
cating science-related concepts in education settings.
In our work, we investigated small to medium-sized
graphs using the Harry Potter dataset. However, the
number of nodes that can be displayed is limited only
by printer resolution and the size of the used medium.
Because we are printing our embeddings with 2D
printing devices, the number of nodes can be much
larger than in 3D printed graphs, where maximum
node numbers of around 30 nodes are common (Bae
et al., 2024; Drogemuller et al., 2021). Our flexible
approach allows for the use of different sets of fo-
cus nodes as well, so that different aspects of the data
can be examined with minimal reassembly, where, for
3D printed representations, printing times are often a
limiting factor (Drogemuller et al., 2021). Most of a
HoloGraph only has to be built once, and the various
slices of a dynamic graph can be printed quickly and
inexpensively. Compared to the approach of Bae et
al.(Bae et al., 2024), HoloGraphs provides interactiv-
ity without the use of electronics or other augmenta-
IVAPP 2025 - 16th International Conference on Information Visualization Theory and Applications
864

tion. The case study confirms that our HoloGraphs
can convey several facts about dynamic graph visu-
alization at the hand of a simple example. A per-
son with knowledge about the underlying data was
able to quickly reason about important story events
and character moments regarding several nodes of in-
terest. Thus, using a dataset already familiar to the
user, made it possible to explain the mechanisms of
dynamic networks to a person with no prior knowl-
edge of or experience with dynamic graphs. Finally,
our domain expert also pointed out interesting aspects
our representation could display: highlighting differ-
ent groups in context slides could explain node move-
ment in conjunction with group association, while the
trajectory overlay could be easily adjusted to help find
nodes at different time points.
Limitations. The number of timeslices that a Holo-
Graph can display depends on several material fac-
tors. With the overhead projector slides we used, sig-
nificant obstructions became apparent using about 20
slices (10 focus + 10 context slices). We used A5
pages (A4 halved) in landscape format for our em-
beddings. With a standard printer, sizes of up to an
A4 page per timeslice are possible. Framing has to
support larger slice formats well enough for the slices
to remain parallel. Drogemuller et al. (Drogemuller
et al., 2021) show that users prefer haptic feedback in
physical networks. Our approach, however, sacrifices
the tactile component, in favor of visual clarity.
Future Work. In this work, we investigated times-
liced networks, however, many real-world networks
are not discrete. In future work, we aim to investigate
the use of HoloGraphs for continuous network physi-
calization. Our evaluation presents some insights into
how our method can help with understanding the un-
derlying data, visualization techniques, and what in-
sights can be extracted from dynamic network struc-
tures and behaviors. However, the versatility and ac-
cessibility of our method could support a multitude of
dynamic data.
REFERENCES
Archambault, D., Purchase, H., and Pinaud, B. (2011).
Animation, Small Multiples, and the Effect of Men-
tal Map Preservation in Dynamic Graphs . IEEE
Transactions on Visualization and Computer Graph-
ics, 17(4):539–552.
Archambault, D. and Purchase, H. C. (2013). Mental
Map Preservation Helps User Orientation in Dynamic
Graphs. In Graph Drawing, volume 7704, pages 475–
486.
Arleo, A., Miksch, S., and Archambault, D. (2022). Event-
based Dynamic Graph Drawing without the Agoniz-
ing Pain. Computer Graphics Forum, 41(6):226–244.
Bach, B., Dragicevic, P., Archambault, D., Hurter, C., and
Carpendale, S. (2017). A Descriptive Framework for
Temporal Data Visualizations Based on Generalized
Space-Time Cubes: Generalized Space-Time Cube .
Computer Graphics Forum, 36(6):36–61.
Bach, B., Pietriga, E., and Fekete, J.-D. (2014). GraphDi-
aries: Animated Transitions and Temporal Navigation
for Dynamic Networks . IEEE Transactions on Visu-
alization and Computer Graphics, 20(5):740–754.
Bae, S. S., Fujiwara, T., Ynnerman, A., Do, E. Y.-L., Rivera,
M. L., and Szafir, D. A. (2024). A Computational
Design Pipeline to Fabricate Sensing Network Physi-
calizations . IEEE Transactions on Visualization and
Computer Graphics, 30(1):913–923.
Beck, F., Burch, M., Diehl, S., and Weiskopf, D. (2017). A
Taxonomy and Survey of Dynamic Graph Visualiza-
tion. Computer Graphics Forum, 36(1):133–159.
Bostock, M., Ogievetsky, V., and Heer, J. (2011). D
3
Data-
Driven Documents. IEEE Transactions on Visualiza-
tion and Computer Graphics, 17(12):2301–2309.
Brandes, U., Indlekofer, N., and Mader, M. (2012). Visual-
ization methods for longitudinal social networks and
stochastic actor-oriented modeling. Social Networks,
34(3):291–308.
Brehmer, M. and Munzner, T. (2013). A Multi-Level
Typology of Abstract Visualization Tasks. IEEE
Transactions on Visualization and Computer Graph-
ics, 19(12):2376–2385.
Colin Ware, Ware, C., Peter Mitchell, and Mitchell, P.
(2008). Visualizing graphs in three dimensions. ACM
TAP, 5(1):2.
Djavaherpour, H., Samavati, F., Mahdavi-Amiri, A., Yaz-
danbakhsh, F., Huron, S., Levy, R., Jansen, Y., and
Oehlberg, L. (2021). Data to Physicalization: A Sur-
vey of the Physical Rendering Process. Computer
Graphics Forum, 40.
Drogemuller, A., Cunningham, A., Walsh, J. A., Baumeis-
ter, J., Smith, R. T., and Thomas, B. H. (2021). Hap-
tic and Visual Comprehension of a 2D Graph Layout
Through Physicalisation. In CHI Conference on Hu-
man Factors in Computing Systems, pages 1–16.
Ehlers, H., Marin, D., Wu, H.-Y., and Raidou, R. (2024a).
Visualizing Group Structure in Compound Graphs:
The Current State, Lessons Learned, and Outstand-
ing Opportunities . In Joint Conference on Computer
Vision, Imaging and Computer Graphics Theory and
Applications - IVAPP, pages 697–708.
Ehlers, H., Pahr, D., Filipov, V., Wu, H.-Y., and Raidou,
R. G. (2024b). Me! me! me! me! a study and com-
parison of ego network representations. Computers &
Graphics, page 104123.
Filipov, V., Arleo, A., B
¨
ogl, M., and Miksch, S. (2023a).
On Network Structural and Temporal Encodings: A
Space and Time Odyssey. IEEE Transactions on Vi-
sualization and Computer Graphics, pages 1–14.
Filipov, V., Arleo, A., and Miksch, S. (2023b). Are We
There Yet? A Roadmap of Network Visualization
HoloGraphs: An Interactive Physicalization for Dynamic Graphs
865

from Surveys to Task Taxonomies . Computer Graph-
ics Forum, 42(6):e14794.
Filipov, V., Ceneda, D., Archambault, D., and Arleo, A.
(2024). TimeLighting: Guided Exploration of 2D
Temporal Network Projections . IEEE Transactions
on Visualization & Computer Graphics, (01):1–13.
Hayashi, A., Matsubayashi, T., Hoshide, T., and Uchiyama,
T. (2013). Initial Positioning Method for Online and
Real-Time Dynamic Graph Drawing of Time Varying
Data . In International Conference on Information Vi-
sualisation, pages 435–444.
Hurtienne, J., Maas, F., Carolus, A., Reinhardt, D., Baur, C.,
and Wienrich, C. (2020). Move amp;Find: The Value
of Kinaesthetic Experience in a Casual Data Repre-
sentation . IEEE Computer Graphics and Applica-
tions, 40(6):61–75.
Jae-wook Ahn, Plaisant, C., and Shneiderman, B. (2014).
A Task Taxonomy for Network Evolution Analysis.
IEEE Transactions on Visualization and Computer
Graphics, 20(3):365–376.
Jansen, Y. and Dragicevic, P. (2013). An interaction
model for visualizations beyond the desktop. IEEE
Transactions on Visualization and Computer Graph-
ics, 19(12):2396–2405.
Jansen, Y., Dragicevic, P., and Fekete, J. D. (2013). Evalu-
ating the efficiency of physical visualizations. Confer-
ence on Human Factors in Computing Systems - Pro-
ceedings, pages 2593–2602.
Jansen, Y., Dragicevic, P., Isenberg, P., Alexander, J.,
Karnik, A., Kildal, J., Subramanian, S., and Horn-
bæk, K. (2015). Opportunities and Challenges for
Data Physicalization. In Proceedings of the 33rd An-
nual ACM Conference on Human Factors in Comput-
ing Systems, CHI ’15, pages 3227–3236.
Kotlarek, J., Kwon, O.-H., Ma, K.-L., Eades, P., Kerren,
A., Klein, K., and Schreiber, F. (2020). A Study
of Mental Maps in Immersive Network Visualization.
In 2020 IEEE Pacific Visualization Symposium (Paci-
ficVis), pages 1–10.
Lee, B., Plaisant, C., Parr, C. S., Fekete, J.-D., and Henry,
N. (2006). Task taxonomy for graph visualization. In
AVI workshop on BEyond time and errors novel eval-
uation methods for information visualization, page 1.
McGookin, D., Robertson, E., and Brewster, S. (2010).
Clutching at straws: using tangible interaction to pro-
vide non-visual access to graphs . In Proceedings of
the SIGCHI conference on human factors in comput-
ing systems, pages 1715–1724.
McGuffin, M. J., Servera, R., and Forest, M. (2023). Path
Tracing in 2D, 3D, and Physicalized Networks. IEEE
Transactions on Visualization and Computer Graph-
ics, pages 1–14.
Oelke, D., Kokkinakis, D., and Keim, D. A. (2013). Fin-
gerprint Matrices: Uncovering the dynamics of social
networks in prose literature . Computer Graphics Fo-
rum, 32(3pt4):371–380.
Oh-Hyun Kwon, Kwon, O.-H., Chris Muelder, Muelder, C.,
Kyungwon Lee, Lee, K., Kwan-Liu Ma, and Ma, K.-
L. (2016). A Study of Layout, Rendering, and In-
teraction Methods for Immersive Graph Visualization
. IEEE Transactions on Visualization and Computer
Graphics, 22(7):1802–1815.
O’Malley, C. and Fraser, D. S. (2004). Literature Review in
Learning with Tangible Technologies.
Pahr, D., Ehlers, H., Wu, H.-Y., Waldner, M., and Raidou,
R. (2024). Investigating the Effect of Operation Mode
and Manifestation on Physicalizations of Dynamic
Processes . Computer Graphics Forum, 43(3):e15106.
Pahr, D., Piovarci, M., Wu, H.-Y., and Raidou, R. G. (5555).
Squishicalization: Exploring Elastic Volume Physi-
calization . IEEE Transactions on Visualization &
Computer Graphics, (01):1–14.
Pahr, D., Wu, H.-Y., and Raidou, R. G. (2021). Vologram:
An Educational Holographic Sculpture for Volumetric
Medical Data Physicalization . In VCBM 2021: 11th
Eurographics Workshop on Visual Computing for Bi-
ology and Medicine, Paris, France, 22-24 September
2021, pages 19–23.
Raidou, R. G., Gr
¨
oller, M. E., and Wu, H.-Y. (2020). Slice
and Dice: A Physicalization Workflow for Anatomical
Edutainment. Computer Graphics Forum, 39(7):623–
634.
Rohrschneider, M., Ullrich, A., Kerren, A., Stadler, P. F.,
and Scheuermann, G. (2010). Visual Network Analy-
sis of Dynamic Metabolic Pathways. In Advances in
Visual Computing, pages 316–327.
Rufiange, S. and Melanc¸on, G. (2014). AniMatrix: A
Matrix-Based Visualization of Software Evolution. In
2014 Second IEEE Working Conference on Software
Visualization, pages 137–146.
Schindler, M., Korpitsch, T., Raidou, R. G., and Wu, H.-
Y. (2022). Nested Papercrafts for Anatomical and
Biological Edutainment. Computer Graphics Forum,
41(3):541–553.
Schindler, M., Wu, H. Y., and Raidou, R. G. (2020). The
Anatomical Edutainer. In Proceedings - 2020 IEEE
Visualization Conference, VIS 2020, pages 1–5.
Shi, L., Wang, C., Wen, Z., Qu, H., Lin, C., and Liao, Q.
(2015). 1.5D Egocentric Dynamic Network Visual-
ization. IEEE Transactions on Visualization and Com-
puter Graphics, 21(5):624–637.
Simonetto, P., Archambault, D., and Kobourov, S. G.
(2018). Event-Based Dynamic Graph Visualisation.
IEEE Transactions on Visualization and Computer
Graphics, pages 1–1.
Sorger, J., Waldner, M., Knecht, W., and Arleo, A. (2019).
Immersive Analytics of Large Dynamic Networks via
Overview and Detail Navigation . International Con-
ference on Artificial Intelligence and Virtual Reality,
pages 144–151.
Stoppel, S. and Bruckner, S. (2017). Vol2velle: Printable
Interactive Volume Visualization. IEEE Transactions
on Visualization and Computer Graphics, 23(1):861–
870.
Stusak, S., Schwarz, J., and Butz, A. (2015). Evaluating the
memorability of physical visualizations. Conference
on Human Factors in Computing Systems - Proceed-
ings, 2015-April:3247–3250.
Vehlow, C., Burch, M., Schmauder, H., and Weiskopf, D.
(2013). Radial Layered Matrix Visualization of Dy-
namic Graphs. In 2013 17th International Conference
on Information Visualisation, pages 51–58.
IVAPP 2025 - 16th International Conference on Information Visualization Theory and Applications
866
