
Quantifying Racial Bias in SpO
2
Measurements Using a Machine
Learning Approach
Hakan Burak Karli
a
, Eli Hilborn and Bige Deniz Unluturk
b
Michigan State University, Electrical and Computer Engineering Department, East Lansing, MI, U.S.A.
Keywords:
Pulse Oximetry, SpO
2
Accuracy, Racial Bias in Medical Devices, Machine Learning in Healthcare, Oximetry
Calibration, Health Disparities.
Abstract:
This paper investigates the racial biases in pulse oximetry, focusing on the importance of noninvasive pe-
ripheral oxygen saturation (SpO
2
) measurements in classifying patient race and ethnicity. Using the publicly
available BOLD dataset, our study applies various machine learning models to quantify the extent of bias in
SpO
2
readings. Initial analysis revealed significant inaccuracies for individuals with darker skin tones, high-
lighting broader health disparities. Further exploration with machine learning models assessed SpO
2
as a pre-
dictive marker for race, uncovering that conventional oximetry may underestimate hypoxemia in non-White
patients. Notably, the XGBoost model demonstrated superior performance, achieving baseline accuracy of
58.08% across the dataset with all races and 72.60% for only black and white patients included, while consis-
tently identifying SpO
2
as a significant factor in these disparities. Our findings demonstrate the necessity for
recalibrating medical devices to enhance their reliability and inclusivity, ensuring equitable health outcomes.
1 INTRODUCTION
Pulse oximetry is a critical, noninvasive method used
to measure peripheral oxygen saturation (SpO
2
) in a
patient’s blood (Harskamp et al., 2021). It is essential
for making immediate clinical decisions in various
healthcare settings, especially in intensive care units
when managing patients with respiratory conditions
(Valbuena et al., 2022). However, the reduced ac-
curacy of pulse oximeters for individuals with darker
skin tones has been known for decades, perpetuating
structural racism in healthcare (Jamali et al., 2022).
Pulse oximeters function by emitting light through
the skin and measuring the light absorption of oxy-
genated and deoxygenated hemoglobin at two differ-
ent wavelengths (Webster, 1997). This measurement
is affected by skin pigmentation, which can interfere
with the light absorption and scattering, leading to
less accurate readings for individuals with darker skin
tones (Feiner et al., 2007) (Keller et al., 2022) as de-
picted in Fig. 1. Studies have shown that pulse oxime-
ters tend to overestimate oxygen saturation levels in
Black patients (Fawzy et al., 2022). For instance,
Black patients experiencing respiratory failure had a
a
https://orcid.org/0009-0001-0328-6409
b
https://orcid.org/0000-0002-9047-1978
notably higher likelihood of occult hypoxemia, with
an odds ratio of 2.57 (Valbuena et al., 2022), com-
pared to White patients.
The persistent underdiagnosis of hypoxemia in
Black patients is probably due to design flaws in the
technology, yet there has been a collective decision
to accept this miscalibration despite existing evidence
(Valbuena et al., 2022). The impact of these inaccura-
cies extends beyond individual patient care, contribut-
ing to broader health disparities. Inaccurate SpO
2
readings can lead to mismanagement of oxygen ther-
apy, delayed treatment, and ultimately poorer health
outcomes for minority patients.
Therefore, it is important to demonstrate the
prevalence of this bias in existing medical records and
work towards a solution in the technology used to take
SpO
2
measurements. In this study, we aim to quan-
tify the racial bias in SpO
2
measurements by train-
ing machine learning (ML) models on patient data to
predict race. Specifically, we evaluate the contribu-
tion of SpO
2
to the predictive performance of these
models using feature importance metrics and perfor-
mance evaluation scores. By analyzing how strongly
SpO
2
contributes to race predictions, we can quantify
the extent of the bias and demonstrate its impact on
model outcomes.
The organization of this paper is as follows. Sec-
Karli, H. B., Hilborn, E. and Unluturk, B. D.
Quantifying Racial Bias in SpO 2 Measurements Using a Machine Learning Approach.
DOI: 10.5220/0013117000003911
Paper published under CC license (CC BY-NC-ND 4.0)
In Proceedings of the 18th International Joint Conference on Biomedical Engineering Systems and Technologies (BIOSTEC 2025) - Volume 1, pages 853-859
ISBN: 978-989-758-731-3; ISSN: 2184-4305
Proceedings Copyright © 2025 by SCITEPRESS – Science and Technology Publications, Lda.
853
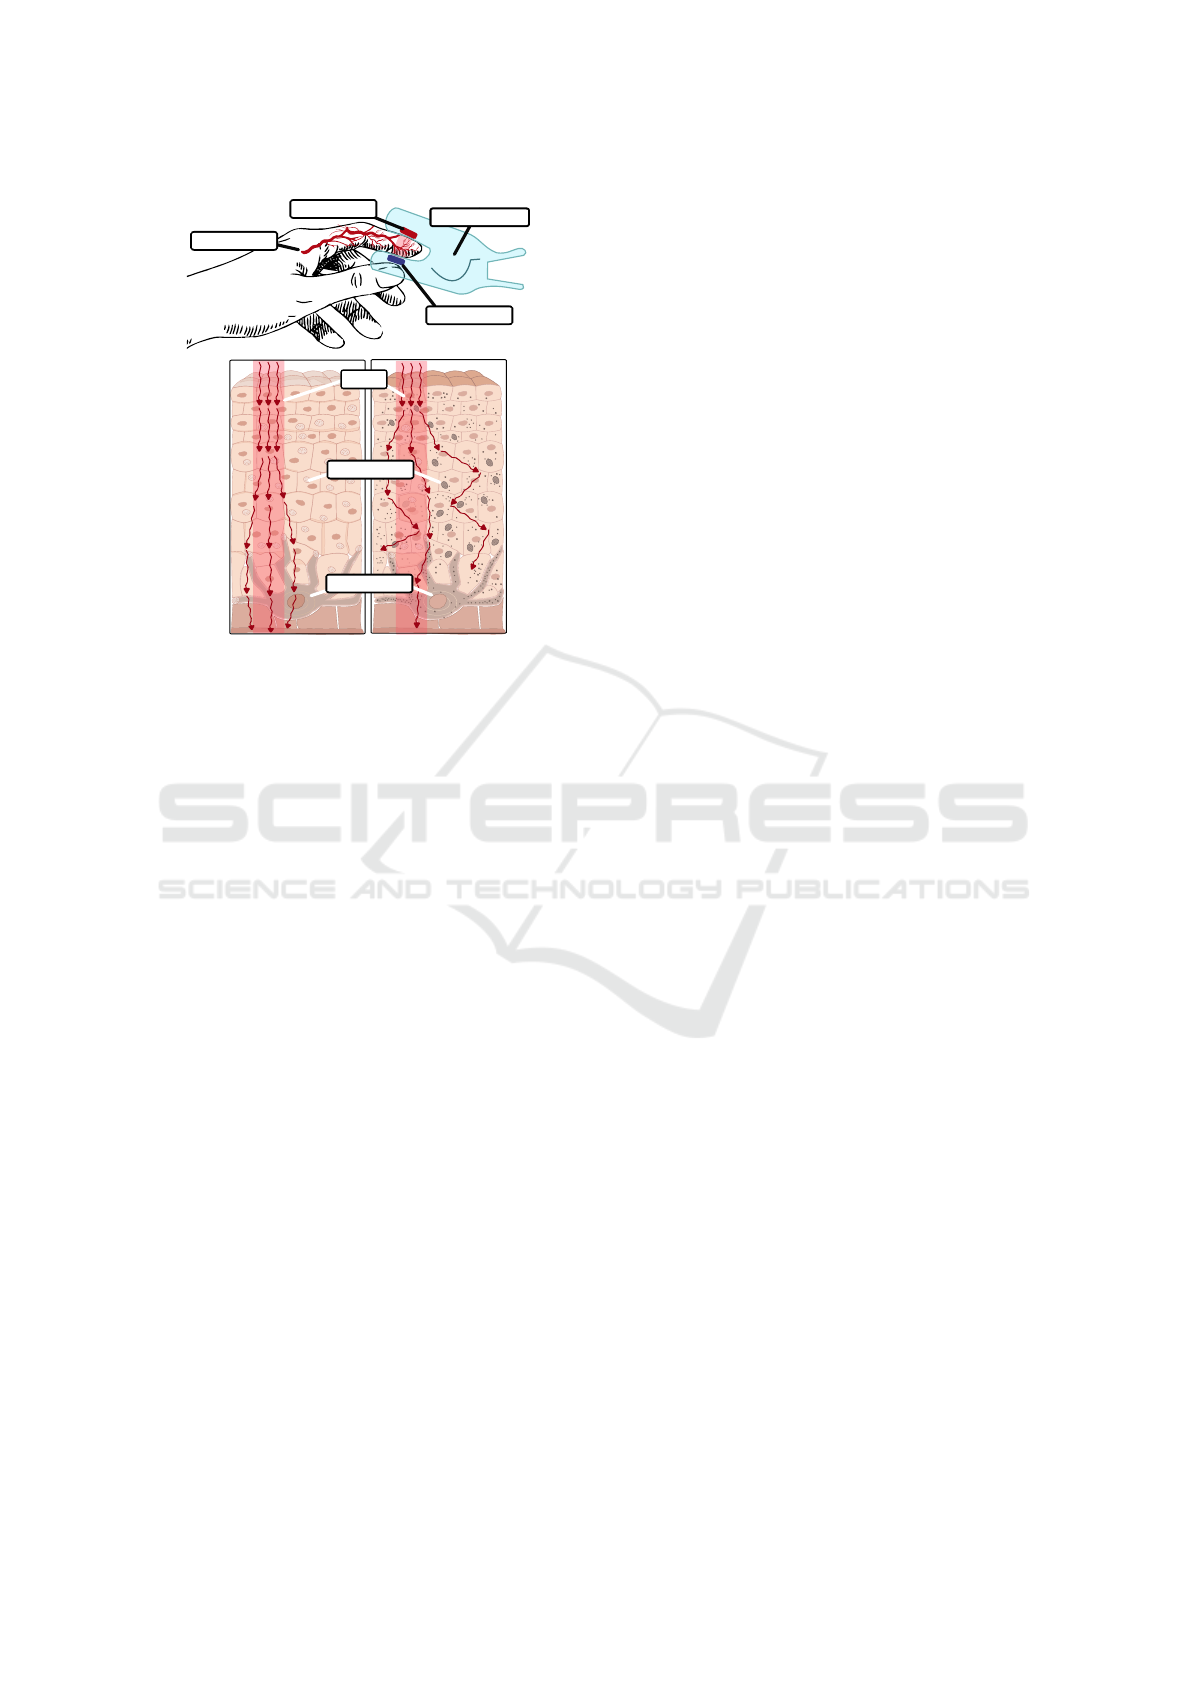
Light skin
a).
b).
Dark skin
Light
Melanosomes
Melanocytes
Light emitter
Detector
Pulse Oximeter
Blood vessel
Figure 1: a). Pulse oximeter placement. b). Melanin
in melanosomes—produced by melanocytes—affects sig-
nal accuracy, especially in darker skin, which has larger and
more numerous melanosomes. Traditional oximetry inad-
equately accounts for how light scatters in different skin
types, often leading to calibration biases towards lighter
skin.
tion 2 elaborates on the methodologies used to as-
sess SpO
2
as a predictive marker for race, includ-
ing various ML models and the preprocessing of the
dataset. Following that, Section 3 presents our find-
ings, discussing the results obtained from the analysis
of SpO
2
’s effectiveness in predicting race. Finally, in
Section 4, we provide concluding remarks along with
future work.
2 METHODOLOGY
2.1 Dataset Overview
The BOLD (Matos et al., 2023), is a blood-gas and
oximetry linked dataset designed to investigate the
relationship between SpO
2
, measured noninvasively
via pulse oximeters, and arterial blood gas measure-
ments such as arterial oxygen saturation (SaO
2
). This
dataset integrates data from three extensive Electronic
Health Record (EHR) databases; MIMIC-III (John-
son et al., 2016), MIMIC-IV (Johnson et al., 2023),
and eICU-CRD which focuses on ICU patients (Pol-
lard et al., 2018). The BOLD dataset categorizes in-
dividuals according to standardized racial and ethnic
classifications to examine disparities in pulse oxime-
try accuracy (Matos et al., 2024).
Key variables include SpO
2
, SaO
2
, race, and other
interpersonal parameters such as age, gender, and un-
derlying health conditions. The dataset comprises
49,099 pairs from 44,907 patients and includes a to-
tal of 142 features. Demographics include admission
age, sex, and race/ethnicity. Vital signs, laboratory
test values, and Sequential Organ Failure Assessment
(SOFA) scores are also included.
2.2 Preprocessing
The following preprocessing steps were taken to pre-
pare the dataset for ML analysis.
2.2.1 Identifying and Removing Outliers
The algorithm searched for outliers in columns (fea-
tures) for values that fell significantly outside of the
normal range. For example, in the pH column, many
data entries were off by factors of 10 due to incorrect
placement of the decimal point.
This was corrected by looping through the values
and dividing them by 10 until they fell within the ac-
ceptable range of 0-14. For other features, such as
‘BMI’, the algorithm searched for BMI data entries
greater than a threshold value (in this case, 50) and
delete those patient entries from the dataset.
2.2.2 Handling Unknown Values
To maintain data integrity and ensure reliable mod-
eling, predictors with more than 50% missing val-
ues, considered substantial and often concentrated
in specific features rather than randomly distributed
across all variables, were removed. This approach
minimizes the risk of introducing artificial patterns
through excessive imputation without sufficient un-
derlying information (Kuhn et al., 2013). For nu-
merical columns, missing values were filled based on
skewness: if greater than 0.5, the median was used;
otherwise, the mean was used. For categorical data,
we filled with the mode of the respective columns.
For the ‘Race/Ethnicity’ column, entries listed as
‘Unknown’ and categories with insufficient data, such
as ‘More Than One Race’ and ‘Native Hawaiian / Pa-
cific Islander’ as seen in Fig. 2, were deleted.
After these preprocessing steps as shown in Fig. 3,
the dataset was left with the following distribution of
race/ethnicity:
• White: 36212
• Black: 4556
• Hispanic or Latino: 2075
• Asian: 855
• American Indian / Alaska Native: 362
BIOSIGNALS 2025 - 18th International Conference on Bio-inspired Systems and Signal Processing
854

White
Black
Asian
More than one race
Unknown
Hispanic or Latino
American Indian / Alaska Native
Native Hawaiian / Pacific Islander
Figure 2: Initial Race/Ethnicity Value Counts.
2.2.3 Label Encoding
Each categorical feature was assigned a numerical
value using the Scikit-learn library’s LabelEncoder
tool.
2.2.4 Reducing Bias
The initial dataset had a significant imbalance in the
‘Race/Ethnicity’ column, with the White race being
overrepresented as depicted in Fig. 2. To correct
this, we employed the Synthetic Minority Oversam-
pling Technique (SMOTE) (Chawla et al., 2002),
which generates synthetic data points for the minor-
ity classes to balance the dataset. However, before
applying SMOTE, we reduced the number of ‘White’
entries to 5,000 through random sampling. After this
reduction, SMOTE was applied to generate additional
data entries for the other races and ethnicities, result-
ing in a balanced training dataset.
2.3 Machine Learning
After preprocessing, we selected several ML mod-
els (Decision Tree Classifier (DTC), Random For-
est Classifier (RFC), XGBoost Classifier, K-Nearest
Neighbors (KNN), Logistic Regression, and a Multi-
Layer Perceptron (MLP) neural network with default
layers as provided by the sklearn library) which
were trained to predict race by examining various fea-
tures, including SpO
2
and SaO
2
. To ensure the reli-
ability and stability of our results, we implemented
5-fold cross-validation. Preliminary analysis showed
consistent variability across the five folds, suggest-
ing that increasing the number of folds (e.g., to 10)
would not significantly improve performance esti-
mates. Therefore, 5-fold cross-validation provided a
balanced and efficient evaluation approach.
After cross-validation, the models were trained on
the entire resampled training set and tested on the
test set to evaluate their performance. Subsequently,
we extracted the 25 most important features from the
Permutation Feature Importance (PFI) analysis and
conducted training and testing with the same model
x25 Iteration
PREPROCESSING
Identifying and Removing
Outliers
Label Encoding
Train and Test
Split
SMOTE
Cross validation,
Training & Testing
Training & Testing
with top 25 features
Permutation Feature
Importance
For each
model
IN
OUT
Figure 3: Process flowchart of the algorithm.
to assess information loss. For each classifier, we
conducted the training, testing, PFI analysis, training
and testing with the selected features for 25 iterations
which can be seen in Fig. 3. This approach was taken
to mitigate the effect of randomness and to observe
the standard deviation of the rankings.
2.4 Permutation Feature Importance
PFI process involves shuffling the values of a feature
and observing how the model’s performance changes.
A significant drop in performance indicates that the
feature is important. Rankings are assigned based on
the decrease in model accuracy, with higher rankings
indicating greater importance.
To evaluate the importance of each feature, includ-
ing SpO
2
, we used PFI across different models. By
comparing the importance rankings of SpO
2
in vari-
ous classifiers, we can assess the extent of its influ-
ence on the model’s predictions and identify potential
racial bias in SpO
2
measurements.
3 RESULTS AND DISCUSSION
We initially evaluated the performance of ML mod-
els using all racial groups but achieved low accuracy
since race does not indicate a unique skin color for
certain races. Therefore, we narrowed our analysis to
only Black and White races to better understand the
correlation between race and SpO
2
.
3.1 Overall Performance
Table 1 summarizes the performance metrics of
various classifiers used in our study to predict
race/ethnicity based on SpO
2
and other features. The
table presents the baseline accuracy, accuracy with
25 top-ranked selected features, and the ranking of
SpO
2
for each model. The results are averaged over
25 iterations as explained in Subsection 2.3, and the
Quantifying Racial Bias in SpO 2 Measurements Using a Machine Learning Approach
855

Table 1: Comparison of Performance Metrics - All Races/Ethnicities.
Models Baseline
Accuracy
Feature
Accuracy*
Ranking of SpO
2
Standard
Deviation
XGBoost Classifier 0.5808 0.5586 5.36 0.70
Random Forest
Classifier
0.5261 0.5304 24.40 25.25
Neural Network 0.4627 0.4456 13.40 10.52
Logistic Regression 0.4078 0.3698 66.48 12.14
DTC 0.4000 0.4020 9.80 4.27
KNN 0.2444 0.2880 66.20 23.52
*presents the accuracy with selected features.
standard deviation of SpO
2
rankings is also provided
to indicate the variability in its importance across the
models.
The XGBoost demonstrated the highest overall
performance, closely followed by the RFC. This in-
dicates that ensemble methods such as XGBoost and
RFC are highly effective for this classification task.
In contrast, the KNN exhibited the lowest accuracy,
highlighting its struggles in discerning patterns. This
limitation of KNN can be considered a result of its in-
ability to consider minority classes and the weight of
data points (Uddin et al., 2022).
When selecting the top 25 features for training
and testing, all classifiers except Logistic Regression
and KNN included SpO
2
among the selected features
through PFI. However, a drop in accuracy was still
observed across models except DTC and KNN.
Based on Table 1 for all races, the PFI analysis re-
veals interesting trends. Models with higher accura-
cies also recognize the importance of features such as
SpO
2
. However, high-accuracy models often cannot
position SpO
2
correctly, indicated by a higher stan-
dard deviation, except for the XGBoost. XGBoost not
only achieved the highest accuracy but also ranked
SpO
2
correctly with the lowest standard deviation,
indicating a consistent ranking of SpO
2
across iter-
ations. In contrast, RFC and KNN had the highest
standard deviations, reflecting greater variability in
the importance of SpO
2
.
Overall, the results underscore the challenge of
predicting race/ethnicity based on SpO
2
and other
features. This difficulty is reflected in the generally
lower accuracies observed. Subsequently, we will fo-
cus on the prediction of Black and White races specif-
ically, as racial bias in SpO
2
measurements is related
to skin color differences (Jamali et al., 2022) and not
racial differences directly. Focusing on these races
would help reveal this potential bias since the skin
color differences are more pronounced between these
two races.
3.2 Focused Analysis: Black and White
Races
In this subsection, we utilize the same models specif-
ically to predict the race between Black and White.
The outcomes of this focused analysis are encapsu-
lated in Table 2 that includes baseline accuracy, accu-
racy after selecting the top 25 features, the ranking of
SpO
2
for each model, and the standard deviation of
SpO
2
rankings.
The findings indicate that the accuracies for pre-
dicting Black and White races are generally higher
than those for predicting all races. Moreover, the
SpO
2
rankings are elevated, and the standard devia-
tions are reduced, suggesting that SpO
2
has emerged
as a more significant feature in this context. As illus-
trated in Table 2, XGBoost model outperformed other
ML models, achieving the highest accuracy and the
lowest standard deviation in SpO
2
ranking.
To determine whether the top-ranked features
identified by XGBoost are meaningful, we conducted
a detailed review of these features. The top-ranked
feature is ‘bmp creatinine’, representing measured
creatinine levels. This ranking is understandable
given that Black patients tend to have higher serum
creatinine concentrations than non-Hispanic White
patients (Delgado et al., 2024) and, according to
the third National Health and Nutrition Examination
Survey, overall mean creatinine levels were highest
among non-Hispanic Blacks (Jones et al., 1998). The
second-ranked feature, ‘region’, correlates with U.S.
census regions—Midwest 34.5%, Northeast 8.4%,
South 34.6%, or West 22.4%—highlighting the non-
uniform racial diversity across these regions accord-
ing to United States 2010 and 2020 Census (U.S.
Census Bureau, 2020). The third ranked feature is
‘admission age’. Research on potential racial dispar-
ities in age at preventable hospitalizations concluded
that Blacks were hospitalized more than 5 years ear-
lier than Whites for both chronic and acute conditions
(Biello et al., 2010).
The fourth-ranked feature is SpO
2
, which this pa-
BIOSIGNALS 2025 - 18th International Conference on Bio-inspired Systems and Signal Processing
856

Table 2: Comparison of Performance Metrics - Black & White.
Models Baseline Accuracy Feature
Accuracy*
Ranking of SpO
2
Standard
Deviation
XGBoost Classifier 0.7260 0.7155 3.84 0.37
Random Forest Classifier 0.7051 0.7050 4.16 1.72
Logistic Regression 0.6850 0.6853 8.88 1.64
Neural Network 0.6526 0.6749 3.80 1.26
DTC 0.6230 0.6157 6.88 6.66
KNN 0.5832 0.5941 12.72 5.60
*presents the accuracy with selected features.
per aims to prove is related to race. As evident from
the ranked features, the highest-ranked ones are al-
ready recognized within the scientific community for
showing racial disparities and have well-documented
racial inequities, with SpO
2
’s relation to race being as
significant as those discussed. The ranking continues
with measured blood urea nitrogen levels, measured
mean corpuscular volume, measured mean corpuscu-
lar hemoglobin, and measured calcium levels.
SaO
2
, ranked ninth, is considered the gold stan-
dard for oxygenation status. Given that SaO
2
is typ-
ically measured through invasive blood gas analysis
and is not affected by skin color, its high ranking
in the feature importance suggests that race-related
information might be carried through its correlation
with SpO
2
. This indicates that the model may be
leveraging the relationship between these features to
capture race data indirectly. To further explore this
observation, additional analysis on the SaO
2
- SpO
2
pairs was conducted (see Section 3.3). This inclu-
sion aligns with findings from a cohort study across
four NHS Hospitals (Bangash et al., 2022), which
revealed that the differences between SpO
2
and SaO
2
varied by ethnicity, with this variance being more pro-
nounced among Black versus White individuals. This
difference led to 8.7% of Black patients and 6.1%
of White patients, who were classified as normoxic
based on SpO
2
, actually being hypoxic when mea-
sured against SaO
2
(Bangash et al., 2022), supporting
a similar conclusion in our study.
3.3 Additional Analysis on SaO
2
- SpO
2
Pairs
To further elucidate the effect of SpO
2
on race predic-
tion, we conducted additional analyses by examining
accuracies: i) after excluding SpO
2
, ii) excluding both
SpO
2
and SaO
2
, iii) excluding only SaO
2
, and iv) in-
cluding delta SpO
2
(the difference between SpO
2
and
SaO
2
) while excluding both SpO
2
and SaO
2
. Per-
formed using the XGBoost model, Table 3 presents
the results of these analyses.
The results indicate that the exclusion of SpO
2
and
Table 3: Accuracy Variations with Different SpO
2
Config-
urations.
Configuration Accuracy
Baseline (All Features) 0.7260
Without SpO
2
0.7012
Without SpO
2
and SaO
2
0.6934
Without SaO
2
0.7158
With Delta SpO
2
(SpO
2
- SaO
2
) 0.7294
SaO
2
features results in a slight decrease in accuracy,
highlighting the contribution of these features in pre-
dicting race/ethnicity. The introduction of delta SpO
2
(the difference between SpO
2
and SaO
2
while exclud-
ing both SpO
2
and SaO
2
) marginal improvement in
the accuracy, suggesting that the difference between
these two measurements provides additional valuable
information as mentioned in (Bangash et al., 2022).
When delta SpO
2
is added and both SpO
2
and SaO
2
are excluded, there is no loss of information, which
implies that the racial bias is not stored in the indi-
vidual measurements but in the differences between
them. These findings highlight the impact of SpO
2
and SaO
2
on the performance of the XGBoost model
and suggest that differences in these measurements
may contribute to racial biases in clinical settings.
4 CONCLUSION
In conclusion, our study quantifies the racial bias
present in SpO
2
measurements using machine learn-
ing models applied to the BOLD dataset. By train-
ing various classifiers to predict race using SpO
2
and
other parameters, we evaluated the importance of
SpO
2
as a predictive feature and demonstrated its con-
tribution to race prediction, particularly when focus-
ing on Black and White patients. Our initial analy-
sis, which included all racial groups, revealed gener-
ally lower accuracies across machine learning mod-
els, highlighting that race itself is not the primary
driver of these disparities. Instead, the key source
Quantifying Racial Bias in SpO 2 Measurements Using a Machine Learning Approach
857

of bias stems from skin color differences, which are
most distinctly observed between Black and White
populations. This insight led us to narrow our focus
to these two groups, allowing a clearer quantification
of bias.
The XGBoost classifier achieved the highest ac-
curacy, reaching 72.60% when predicting race us-
ing SpO
2
and other parameters, with SpO
2
consis-
tently ranking as a top predictive feature and show-
ing minimal variability across iterations. When SpO
2
was excluded from the model, accuracy dropped
from 72.60% to 70.12%. Additionally, introduc-
ing delta SpO
2
, the difference between SpO
2
and
SaO
2
, slightly improved accuracy to 72.94%, indi-
cating that the bias arises not only from individual
SpO
2
or SaO
2
values but from their interrelation. Our
findings reinforce existing clinical evidence showing
that Black patients are more susceptible to undetected
hypoxemia when SpO
2
is used as the sole diagnos-
tic tool. While our analysis demonstrated the abil-
ity of machine learning models to detect and quan-
tify bias through feature importance analysis, we em-
phasize that SpO
2
discrepancies cannot be fully ad-
dressed without more granular data, such as direct
skin color measurements. These insights suggest that
race serves as a reasonable surrogate for skin color in
current datasets, but future datasets must incorporate
explicit skin pigmentation data to enable more precise
corrections.
For future work, we propose exploring more ro-
bust solutions beyond race-based corrections. De-
vices such as transcutaneous oxygen monitors, like
the prototype wearable developed by Vakhter et al.,
measure oxygen diffusion directly through the skin,
bypassing the bias introduced by skin pigmenta-
tion (Vakhter et al., 2023). Integrating data from such
devices with pulse oximetry could provide a more
accurate and skin-independent assessment of oxygen
saturation. However, in our current dataset, we lack
specific skin color information, preventing the im-
plementation of skin-specific corrections. As a re-
sult, in our ongoing work, we will continue to use
race as a surrogate for skin color as a proof of con-
cept to demonstrate the potential effectiveness of ma-
chine learning-based corrections (Karli and Unluturk,
2024).
ACKNOWLEDGEMENTS
This material is based upon work supported in part by
the National Science Foundation (NSF) under Grant
OAC-2203827, in part by the National Institutes of
Health (NIH) under Grant R01HL172293 and in part
by R21EB036329.
REFERENCES
Bangash, M. N., Hodson, J., Evison, F., Patel, J. M., John-
ston, A. M., Gallier, S., Sapey, E., and Parekh, D.
(2022). Impact of ethnicity on the accuracy of mea-
surements of oxygen saturations: A retrospective ob-
servational cohort study. EClinicalMedicine, 48.
Biello, K. B., Rawlings, J., Carroll-Scott, A., Browne, R.,
and Ickovics, J. R. (2010). Racial disparities in age at
preventable hospitalization among us adults. Ameri-
can journal of preventive medicine, 38(1):54–60.
Chawla, N. V., Bowyer, K. W., Hall, L. O., and Kegelmeyer,
W. P. (2002). Smote: synthetic minority over-
sampling technique. Journal of artificial intelligence
research, 16:321–357.
Delgado, C., Powe, N. R., Chertow, G. M., Grimes, B.,
and Johansen, K. L. (2024). Muscle mass and serum
creatinine concentration by race and ethnicity among
hemodialysis patients. Journal of the American Soci-
ety of Nephrology, 35(1):66–73.
Fawzy, A., Wu, T. D., Wang, K., Robinson, M. L., Zeger,
S. L., Tracy, R. P., Haynes, S. G., Krishnan, J. A., and
McEvoy, J. W. (2022). Racial and ethnic discrepancy
in pulse oximetry and delayed identification of treat-
ment eligibility among patients with covid-19. JAMA
Internal Medicine, 182(7):730–738.
Feiner, J. R., Severinghaus, J. W., and Bickler, P. E. (2007).
Dark skin decreases the accuracy of pulse oxime-
ters at low oxygen saturation: The effects of oxime-
ter probe type and gender. Anesthesia & Analgesia,
105(6):S18–S23.
Harskamp, R. E., Bekker, L., Himmelreich, J. C.,
De Clercq, L., Karregat, E. P., Sleeswijk, M. E., and
Lucassen, W. A. (2021). Performance of popular
pulse oximeters compared with simultaneous arterial
oxygen saturation or clinical-grade pulse oximetry: a
cross-sectional validation study in intensive care pa-
tients. BMJ open respiratory research, 8(1):e000939.
Jamali, H., Castillo, L. T., Morgan, C. C., Coult, J., Muham-
mad, J. L., Osobamiro, O. O., Parsons, E. C., and
Adamson, R. (2022). Racial disparity in oxygen satu-
ration measurements by pulse oximetry: evidence and
implications. Annals of the American Thoracic Soci-
ety, 19(12):1951–1964.
Johnson, A. E., Bulgarelli, L., Shen, L., Gayles, A., Sham-
mout, A., Horng, S., Pollard, T. J., Hao, S., Moody,
B., Gow, B., et al. (2023). Mimic-iv, a freely acces-
sible electronic health record dataset. Scientific data,
10(1):1.
Johnson, A. E., Pollard, T. J., Shen, L., Lehman, L.-w. H.,
Feng, M., Ghassemi, M., Moody, B., Szolovits, P.,
Anthony Celi, L., and Mark, R. G. (2016). Mimic-
iii, a freely accessible critical care database. Scientific
data, 3(1):1–9.
Jones, C. A., McQuillan, G. M., Kusek, J. W., Eberhardt,
M. S., Herman, W. H., Coresh, J., Salive, M., Jones,
C. P., and Agodoa, L. Y. (1998). Serum creatinine lev-
els in the us population: third national health and nu-
trition examination survey. American Journal of Kid-
ney Diseases, 32(6):992–999.
BIOSIGNALS 2025 - 18th International Conference on Bio-inspired Systems and Signal Processing
858

Karli, H. B. and Unluturk, B. D. (2024). Addressing racial
disparities in pulse oximetry: A machine learning per-
spective. In Proceedings of the 2024 Asilomar Con-
ference on Signals, Systems, and Computers (ACSSC),
Pacific Grove, CA, USA. Accepted for publication.
Keller, M. D., Harrison-Smith, B., Patil, C., and Arefin,
M. S. (2022). Skin colour affects the accuracy of med-
ical oxygen sensors.
Kuhn, M., Johnson, K., Kuhn, M., and Johnson, K. (2013).
Data pre-processing. Applied predictive modeling,
pages 27–59.
Matos, J., Struja, T., Gallifant, J., Nakayama, L.,
Charpignon, M.-L., Liu, X., Economou-Zavlanos, N.,
S. Cardoso, J., Johnson, K. S., Bhavsar, N., et al.
(2024). Bold: Blood-gas and oximetry linked dataset.
Scientific Data, 11(1):535.
Matos, J., Struja, T., Gallifant, J., Nakayama, L. F.,
Charpignon, M., Liu, X., dos Santos Cardoso, J., Celi,
L. A., and Wong, A. K. (2023). Bold, a blood-gas and
oximetry linked dataset (version 1.0). PhysioNet.
Pollard, T. J., Johnson, A. E., Raffa, J. D., Celi, L. A.,
Mark, R. G., and Badawi, O. (2018). The eicu col-
laborative research database, a freely available multi-
center database for critical care research. Scientific
data, 5(1):1–13.
Uddin, S., Haque, I., Lu, H., Moni, M. A., and Gide,
E. (2022). Comparative performance analysis of k-
nearest neighbour (knn) algorithm and its different
variants for disease prediction. Scientific Reports,
12(1):6256.
U.S. Census Bureau (2020). Racial and Ethnic Diversity
in the United States: 2010 Census and 2020 Census.
https://www.census.gov/library/visualizations/intera
ctive/racial-and-ethnic-diversity-in-the-united-sta
tes-2010-and-2020-census.html. [Online; accessed
10-June-2024].
Vakhter, V., Kahraman, B., Bu, G., Foroozan, F., and Guler,
¨
U. (2023). A prototype wearable device for nonin-
vasive monitoring of transcutaneous oxygen. IEEE
Transactions on Biomedical Circuits and Systems,
17(2):323–335.
Valbuena, V. S., Barbaro, R. P., Claar, D., Valley, T. S.,
Dickson, R. P., Gay, S. E., Sjoding, M. W., and
Iwashyna, T. J. (2022). Racial bias in pulse oxime-
try measurement among patients about to undergo ex-
tracorporeal membrane oxygenation in 2019-2020: a
retrospective cohort study. Chest, 161(4):971–978.
Webster, J. (1997). Design of Pulse Oximeters. Series in
Medical Physics and Biomedical Engineering. CRC
Press.
Quantifying Racial Bias in SpO 2 Measurements Using a Machine Learning Approach
859
