
Delphi: A Natural Language Interface
for 2.5D Treemap Visualization of Source Code
Adrian Jobst
1 a
, Daniel Atzberger
1 b
, Willy Scheibel
1 c
,
J
¨
urgen D
¨
ollner
1 d
and Tobias Schreck
2 e
1
Hasso Plattner Institute, Digital Engineering Faculty, University of Potsdam, Germany
2
Graz University of Technology, Austria
{adrian.jobst, daniel.atzberger, willy.scheibel}@hpi.uni-potsdam.de, doellner@uni-potsdam.de,
Keywords:
Software Visualization, Natural Language Interfaces, Chart Question Answering.
Abstract:
Modern software development projects are characterized by large teams of developers, diverse technology
stacks, and systematic workflows. This inherent complexity makes it difficult for stakeholders to maintain an
overview of the project and its evolution. Software Visualization concerns generating data-driven geometric
representations of specific aspects of software systems to provide insights and enable exploration. However,
effective utilization of these specialized visualizations requires expertise in visualization theory and software
development. This paper presents Delphi, the first system that combines a Natural Language Interface backed
by a Large Language Model with a 2.5D treemap as software visualization technique. Delphi modifies the vi-
sual mapping to answer questions related to the software project, highlights objects, and provides explanations
for the user. We demonstrate our system’s workflow through a use case study involving a mid-sized TypeScript
project, showing how Delphi facilitates exploration. Our findings indicate that Delphi enhances the exploration
process’s efficiency and broadens accessibility for a wider range of users. We release our source code as open
source at https://github.com/hpicgs/llm-treemaps, with our prototype hosted on https://hpicgs.github.io/llm-
treemaps.
1 INTRODUCTION
According to Brooks Jr (1995), “software systems
are perhaps the most intricate and complex of man’s
handiworks.” Tasks such as coordinating mainte-
nance and identifying defects require a comprehen-
sive understanding of both the current state of the
software and its evolution over time. However, mod-
ern software is typically distributed across vast collec-
tions of files stored in numerous repositories, making
it nearly impossible for individuals to gain a holis-
tic view of the entire system (Menzies and Zimmer-
mann, 2013). This challenge motivated the field of
software visualization, a practice focused on “the vi-
sualization of artifacts related to software and its de-
velopment process [...] to help comprehend software
systems and improve the productivity of the software
a
https://orcid.org/0009-0007-4894-451X
b
https://orcid.org/0000-0002-5409-7843
c
https://orcid.org/0000-0002-7885-9857
d
https://orcid.org/0000-0002-8981-8583
e
https://orcid.org/0000-0003-0778-8665
development process” (Diehl, 2007).
Various software visualizations have been devel-
oped to represent aspects of software, such as soft-
ware metrics, i.e., quantifications of aspects related to
the complexity and quality of the source code (Hon-
glei et al., 2009). Treemaps, for example, are a hier-
archical data visualization technique that applies well
to the hierarchical structure of source code (Scheibel
et al., 2024). By extending traditional 2D treemaps to
2.5D, where height serves as an additional visual di-
mension, these visualizations can represent a variety
of data in a single view, while scaling well with the
size and complexity of the project (Limberger et al.,
2022). However, these visualizations present two ma-
jor challenges. First, effectively modifying and in-
terpreting them requires users to have knowledge of
general visualization principles and familiarity with
the specific technique employed. Second, users must
also have an understanding of the software engineer-
ing domain to map the visualization output to mean-
ingful software concepts. Consequently, these tools
impose a cognitive burden on users.
Jobst, A., Atzberger, D., Scheibel, W., Döllner, J. and Schreck, T.
Delphi: A Natural Language Interface for 2.5D Treemap Visualization of Source Code.
DOI: 10.5220/0013119600003912
Paper published under CC license (CC BY-NC-ND 4.0)
In Proceedings of the 20th International Joint Conference on Computer Vision, Imaging and Computer Graphics Theory and Applications (VISIGRAPP 2025) - Volume 1: GRAPP, HUCAPP
and IVAPP, pages 867-874
ISBN: 978-989-758-728-3; ISSN: 2184-4321
Proceedings Copyright © 2025 by SCITEPRESS – Science and Technology Publications, Lda.
867
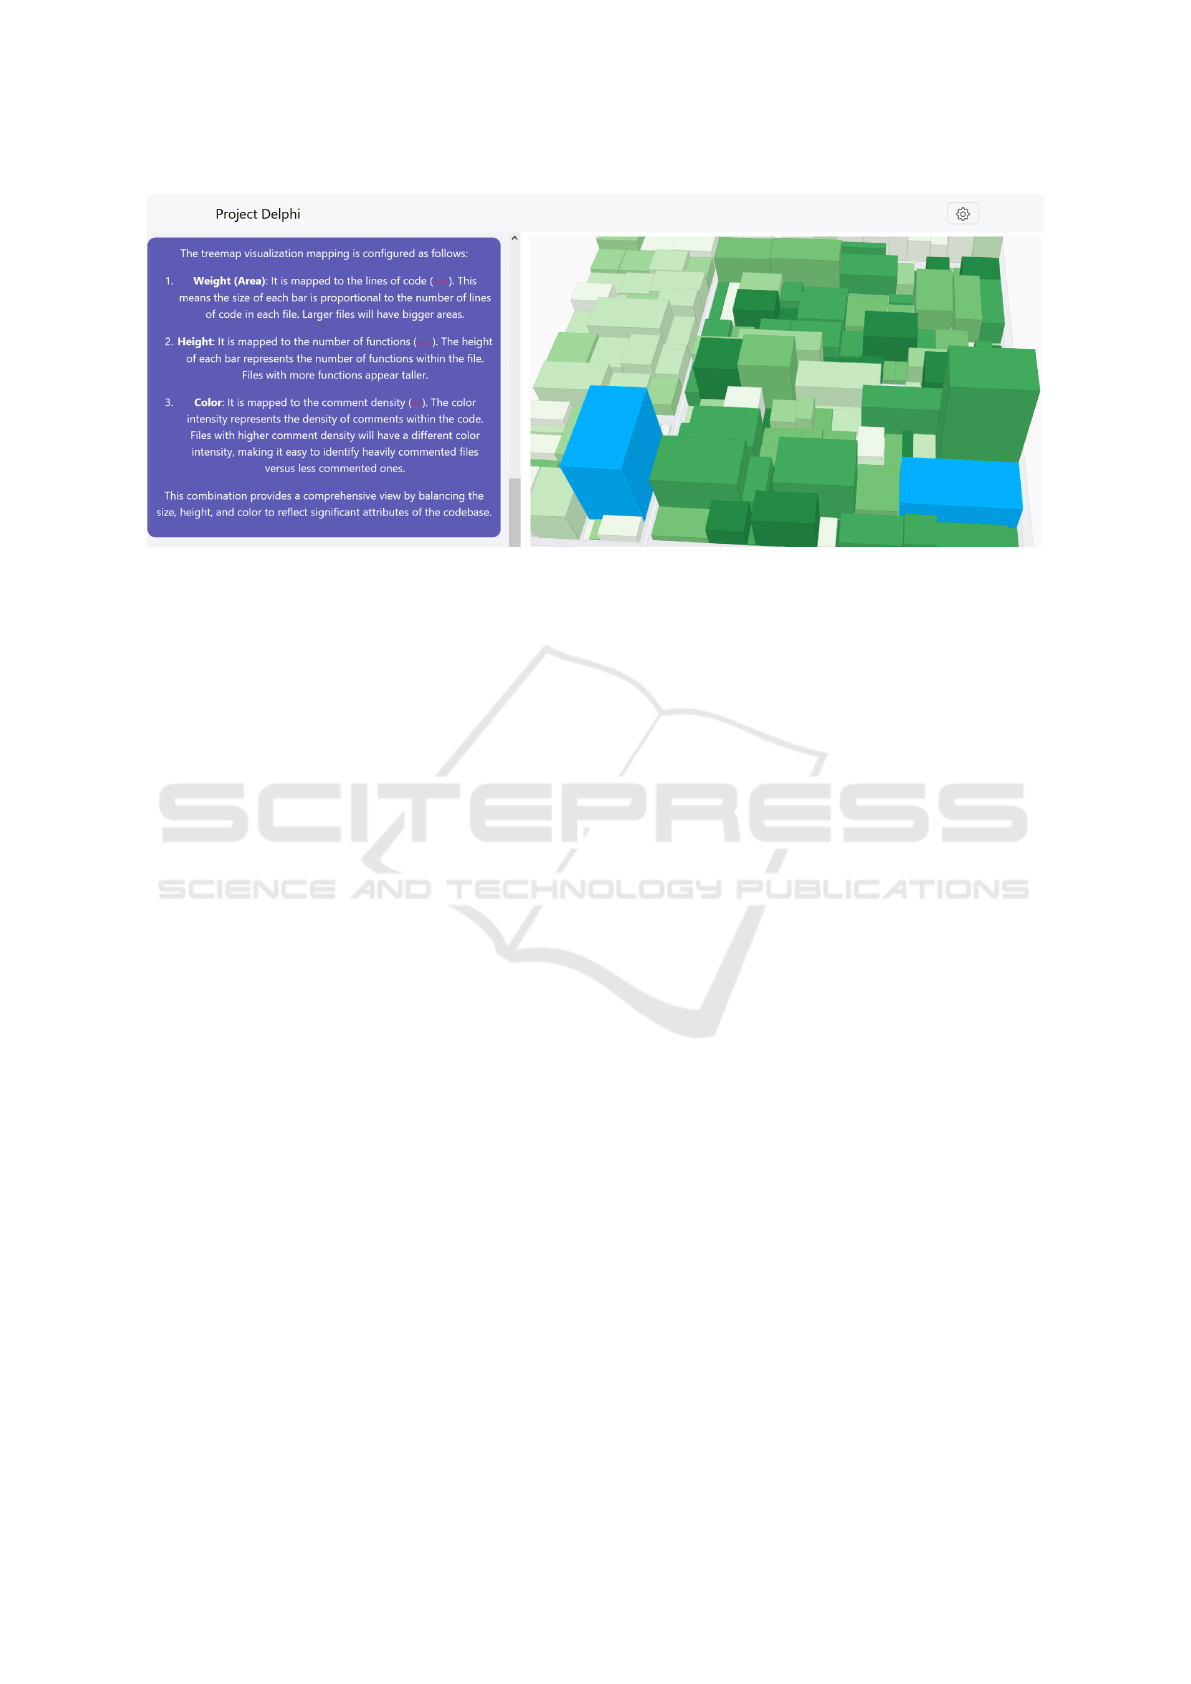
Figure 1: Illustration of our system Delphi: (Left) NLI for interacting with the user via text, (Right) 2.5D treemap for
displaying software metrics for source code files. The LLM first chooses an appropriate visual mapping and explains it to the
user. It highlights cuboids in blue that correspond to files with the most lines of code.
In this work, we present Delphi – a system that in-
tegrates a Natural Language Interface (NLI) backed
by a Large Language Model (LLM) with a 2.5D
treemap as a form of software visualization. As ex-
emplified in Figure 1, users interact with the LLM
via natural language to ask questions about both about
the dataset and the visualization itself. The LLM re-
sponds either through textual explanations or by di-
rectly adjusting the treemap, such as modifying visual
mappings or highlighting specific objects. This inte-
gration of LLMs enables users to express their needs
more intuitively, improving accessibility and reduc-
ing the cognitive load traditionally associated with
software visualization tools. By lowering the analyt-
ical skills required to engage with complex software
systems, the system makes these tools more acces-
sible to users with varying levels of technical exper-
tise (Hoque, 2023). Additionally, leveraging an LLM
allows for more dynamic and flexible interactions
compared to traditional query mechanisms, making it
easier for users to explore and interpret large, com-
plex datasets without needing deep knowledge of the
visualization technique itself.
2 RELATED WORK
Our discussion of related work is divided into three
main areas: (1) existing software visualization tech-
niques, (2) Chart Question Answering (CQA), and
(3) LLM-based systems for generating visualizations.
Software Visualization. Software lacks an intrin-
sic gestalt, which makes software visualization a sub-
field of information visualization. This subfield deals
with representing selected aspects of software, such
as its structure, development process, or the evo-
lution of software artifacts (Diehl, 2007). Exam-
ples include universal visualizations, such as icicle
plots for trace executions (Malony et al., 1991; Cor-
nelissen et al., 2011), bundleview maps for depen-
dency representation (Cornelissen et al., 2008), and
sequences of simple glyphs for visualizing software
evolution (Lanza, 2001). Additionally, specific vi-
sualizations have been developed to address partic-
ular domains within software. Examples using a
city metaphor are Software Cities (Steinbr
¨
uckner and
Lewerentz, 2013) and Code Cities (Wettel and Lanza,
2007). The layout of these visualizations often re-
lies on a treemap structure (Scheibel et al., 2020b).
Our system builds upon these concepts by employ-
ing rectangular 2.5D treemaps, which are character-
ized by their high visual quality, the extensive use of
visual variables (Limberger et al., 2022, 2020), and,
in particular, their visual scalability when depicting
tree-structured datasets through their space-filling ap-
proach.
Chart Question Answering. As defined by Hoque
et al. (2022), CQA refers to approaches that “take a
chart and a natural language question as input and
automatically generate the answer to facilitate visual
data analysis.” Several applications of CQA include
chart summarization (Kantharaj et al., 2022), caption
generation (Hsu et al., 2021), extraction of geometric
attributes (Kim et al., 2020), and complex reasoning
tasks (Masry et al., 2022). In addition, NLIs for visu-
alizations have been explored in various works (Shen
et al., 2023; Voigt et al., 2022; Setlur et al., 2016).
Earlier CQA methods did not leverage LLMs, instead
IVAPP 2025 - 16th International Conference on Information Visualization Theory and Applications
868

implementing functionalities such as data extraction
and query answering independently. In contrast, Del-
phi directly processes software metrics as input, en-
abling multiple CQA tasks seamlessly through its in-
tegration with an LLM, providing more dynamic and
flexible interactions for program comprehension.
Visualization Generation using LLMs. LLMs,
trained on vast corpora including web pages, are ca-
pable of generating source code for visualizations,
such as producing D3.js code (Maddigan and Susn-
jak, 2023). This capability makes the application of
LLMs for visualization generation a natural exten-
sion. However, user descriptions often suffer from
under-specification and ambiguity (Kim et al., 2024;
Gao et al., 2015). To mitigate this issue, several
pipelines have been proposed that decompose the gen-
eration process into subtasks, where each stage’s out-
put serves as the context for the subsequent stage.
For instance, Dibia (2023) introduced LIDA, an open-
source tool that combines LLMs and Image Generator
Models (IGMs) to create data visualizations in a four-
stages pipeline. Other recent pipelines, such as those
proposed by Tian et al. (2024) and Cui et al. (2025),
follow a similar multi-step process to enhance clar-
ity and precision in visualization generation. While
existing LLM-based visualization generation systems
offer considerable flexibility by allowing users to cus-
tomize the visual design via generated code, this flex-
ibility also introduces the potential for errors. Fur-
thermore, despite their capabilities, many of these
systems remain restricted to producing basic visu-
alizations and offer limited integration with specific
projects. In contrast, our approach simplifies the gen-
eration process by using a predefined output structure
that directly maps data attributes to visual variables.
This predefined structure reduces the risk of errors
while maintaining flexibility, ensuring that the gener-
ated visualizations are accurate and aligned with the
project’s needs.
3 VISUALIZATION DESIGN
A treemap visualization uses a hierarchical structure
of data. In the case of a software project the hierarchi-
cal structure can be determined by the file structure on
the hierarchical decomposition of the software project
itself. From this structure, we compute and visual-
ize several key software metrics that quantify aspects
such as size, complexity, and quality. Specifically, we
focus on the following core metrics: Lines of Code
(LoC), Number of Functions (NoF), Number of Com-
ments (NoC), Commented Lines of Code (CLoC), and
Comment Density (DC).
Figure 2: Example for 2.5D treemap generation: (Top-Left)
a tree structure with weights for every leaf node, (Top-
Right) 2D treemap generated using the slide-and-dice al-
gorithm, (Bottom-Right) Distances for displaying the depth
(Bottom-Left) 2.5D extension. The color represents the
node.
3.1 2.5D Treemap
The treemap layout organizes rectangles—each rep-
resenting a file—based on the hierarchical folder
structure, with the size of each rectangle propor-
tional to a selected quantitative metric, specifically
LoC (Scheibel et al., 2020b). Figure 2 illustrates one
among several layout algorithms for generating a 2D
treemap layout alongside its corresponding tree struc-
ture (Scheibel et al., 2020a). Our treemap module
enhances the traditional 2D layout by introducing a
2.5D representation, where the height of the cuboids
(extruded rectangles) serves as an additional visual di-
mension. This third dimension allows us to encode
more data. Additional visual properties, including
color and texture, highlight various file characteris-
tics. The treemap module operates as a standalone
component, offering several interaction techniques
such as rotation, zooming, and details-on-demand.
Users can hover over or select a cuboid to reveal its
corresponding file name and associated metrics.
3.2 Natural Language Interface
An instruction prompt, i.e., the text input provided
to the underlying LLM, defines how the system re-
sponds to user queries. The context of the domain,
data attributes, tasks, and expected output format are
predefined by the visualization designer in a detailed
instruction prompt. Our instruction prompt is shown
in Figure 3. The design of the prompt was iterative.
We experimented with various instruction prompts
before acquiring a working version that consistently
produced desired outputs. Our approach was guided
by best practices (OpenAI, 2024). We specifically
implemented strategies such as forcing the LLM to
Delphi: A Natural Language Interface for 2.5D Treemap Visualization of Source Code
869

return JSON-formatted outputs, ensuring that the re-
sponses were reliable and could be directly utilized in
the system’s visual mappings. The LLM responds in
one of three possible ways, as specified by the instruc-
tion prompt:
1. Answering analytics-related questions: The
LLM generates textual answers to the user’s
queries. For example, the user might asks, “Can
you explain the different data columns?” and the
LLM would return an explanation.
2. Visual Mapping: The LLM can modify a JSON
object that controls the mapping between data at-
tributes and visual variables. For instance, a user
may ask, “Map complexity to color,” and the LLM
updates the treemap to reflect this change.
3. Highlighting: The LLM can also adjust the JSON
object to highlight specific objects in the visual-
ization. For example, in response to “Highlight
files with more than 500 lines of code,” the corre-
sponding cuboids would be visually emphasized
within the treemap.
The underlying data set is available to the LLM as
input, and questions about the data set are solved
programmatically by generating source code that per-
forms computations and returns results in natural lan-
guage. To ensure consistency, the output format of
the LLM adheres to structured templates, following
ideas from Liu et al. (2024), which greatly enhances
reliability when manipulating visual elements. Addi-
tionally, during user exploration, the LLM maintains
context, remembering previous queries and enabling
open-ended QA.
4 IMPLEMENTATION DETAILS
The application is implemented as a web-based sys-
tem using React JS and Bootstrap for UI components.
Currently there is no dedicated backend, all function-
ality resides in the web application.The system uses
the GPT-4o model from OpenAI, which is accessed
through OpenAI’s Node.js package for communica-
tion between the web app and OpenAI’s servers (Ope-
nAI, 2024). OpenAI allows for different usage sce-
narios, where we make use of the Assistant API which
allows us to give system instructions (prompts) and
make use of tools, specifically the code interpreter.
Upon application startup, an instance of the assistant
is created. Following this, the CSV file containing
the software metrics is uploaded, which the assistant
uses during the session. The assistant is able to ac-
cess the file directly with the code interpreter tool.
The CSV file containing the aforementioned software
CONTEXT
You are the backbone of a visual analytics
application. You use a knowledge base to answer
analytics-related questions and control part
of the visual analytics app if necessary. The
analytics platform uses a treemap to visualize
hierarchical data.
Your knowledge base is software analytic data
of Git repositories. Data is stored in csv files
which have the following columns:
- filename: name of the file
- loc: lines of code
- noc: number of comments (comment blocks)
- cloc: number of comment lines
- dc: comment density; ratio of comment lines to
all lines
- nof: number of functions
TASKS
As you are the backbone of the visual analytics
application, you mainly do two things. You
provide explanations for human users, and you
control parts of the application, mainly a treemap
visualization. That we can use your responses
properly, your response for controlling the
application has to be valid JSON format. You
append the json at the end of your user message
as a separate message. There should be no sign
that a message contains a configuration object,
for instance never use wording like "Here is the
configuration for ...". Just use JSON for easier
parsing at the end of the message.
Here is more information about your core
functionality:
1: You answer analytic related questions about
the provided knowledge base and provide reasoning
about the actions you take when you control the
app. Keep your answers as brief as possible, also
don’t use too much text styling.
2: You create the visual mapping of the data
columns for the treemap visualization. The
treemap uses three visual attributes. The area of
a bar, the height of a bar and the color of a bar.
Per default the treemap displays the number of
lines of code (loc) as area. You can choose the
mapping of the other two visual attributes based
on what you think makes most sense, or on what the
user specifies. To speed up the user interaction,
you never ask for confirmation when you create a
mapping. The mapping object will configure the
treemap component of the system, therefore it will
be in the JSON response object. The format is
either { mapping: {height: columnName, colors:
columnName} } or { mapping: null}.
3: Whenever appropriate, you can highlight single
or multiple columns. A column represents a
single file in the knowledge base. When you
want to highlight a column, you respond with the
"filename" of the item in the knowledge base. So
the format is either { highlight: [filename] } or
{ highlight: null }.
Figure 3: Instruction prompt of Delphi. In the prompt, the
visualization designer specifies the context, data attributes,
tasks, and output structure.
metrics is fetched by one of our previous projects
which computes metrics for Git project commits via
a GitHub Continuous Integration runtime (Scheibel
et al., 2024).
IVAPP 2025 - 16th International Conference on Information Visualization Theory and Applications
870

Figure 4: Delphi explains the current role of the three visual
variables of the treemap.
The chat interface is implemented as a React com-
ponent. Upon receiving user input, the application
controller forwards the message to the OpenAI server
and waits for the response. The system uses stream-
ing responses to improve perceived response time by
displaying partial outputs. When the LLM generates a
JSON object, the app controller collects and parses it
(but does not display it in the chat), then invokes func-
tions within the treemap component to adjust visual
mappings or highlight specific data elements. The Re-
act treemap component leverages the treemap imple-
mentation from Scheibel et al. (2024), enabling direct
manipulation of the visualization through a configu-
ration object. When the controller calls for a change
originating from the LLM, the configuration is trans-
lated accordingly.
5 USE CASES
In the following, we demonstrate how Delphi can as-
sist a practitioner, such as a software project manager,
who may lack dedicated knowledge of software vi-
sualization. As an example, we analyze the webgl-
operate
1
project from GitHub, a TypeScript-based
WebGL rendering framework. Delphi starts by pro-
viding an overview of the project, displaying a two-
dimensional treemap where the areas represent the
LoC. Since the user may not be familiar with treemap
visualization, they might require additional explana-
tions. The context provided to the LLM allows it to
generate a detailed response, as shown in Figure 4.
1
https://github.com/cginternals/webgl-operate
Figure 5: Delphi modifies the visual mapping to display
more information within the treemap using a sequential
color scheme.
Figure 6: Delphi highlights the three largest files in the vi-
sualization.
The inclusion of additional visual variables en-
ables users to explore more complex questions. How-
ever, selecting an appropriate visual mapping requires
knowledge of aspects like color schemes. To assist
with this, Delphi defines a mapping and briefly de-
scribes it, displaying the source code used to modify
the treemap visualization, as illustrated in Figure 5.
During the interaction process, users may want
to retrieve specific data, such as the files with the
most LoC. This task, which involves comparing the
areas of all rectangles, can be time-consuming and
error-prone. Delphi facilitates this by generating a
formal retrieval using the Python library pandas and
listing the three files in the interface. Additionally,
it highlights the corresponding cuboids, as shown in
Figure 6. Beyond simple text inquiries, Delphi can
also handle questions requiring compositional com-
putations.
Typically, users will have questions that arise from
their work context and may not be directly addressed
by the visualization. For example, a project manager
might be interested in identifying areas most likely
to contain defects to prioritize maintenance efforts.
While software visualization aims to empower users
to explore and answer such questions, no dedicated
Delphi: A Natural Language Interface for 2.5D Treemap Visualization of Source Code
871
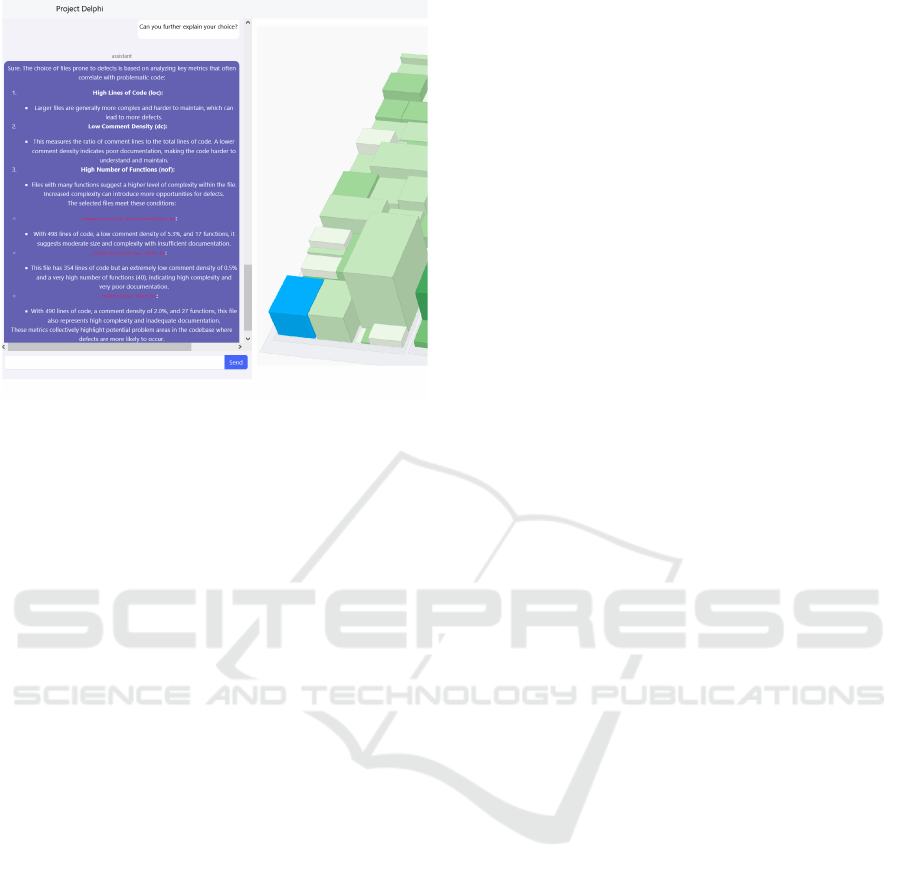
Figure 7: Delphi explains the idea behind its heuristic to
detect defect prone source code files.
metric quantifies the likelihood of a source code file
inheriting errors. This requires logical reasoning that
involves multiple metrics and a deep understanding
of each. To address the abstract question of locating
defect-prone files, Delphi employed statistical analy-
sis to select files with high LoC and NoF values but
low DC values in our tests. Upon request, Delphi ex-
plains its heuristic, as illustrated in Figure 7.
6 DISCUSSION
In the following, we discuss our main findings derived
from our use case study together with Delphi’s limi-
tations and threats to validity.
Main Findings. In our initial prompt, we provided
the LLM with a formal specification of the possible
outputs given as JSON object. Throughout our exper-
iments, this specification was strictly followed, result-
ing in no errors or inconsistencies in the output rep-
resentation. This restriction simplifies the interaction
process, allowing users to engage freely and dynam-
ically with the system without needing the visualiza-
tion process to be divided into predefined sub-steps.
It also allows less flexibility in the possible output by
restricting the visualization to the provided options.
We tested a range of CQA queries that varied in
input and output dimensions, e.g., some questions re-
fer to facts of the visualization while others require
logical reasoning. In each case, the LLM consistently
provided satisfying answers, demonstrating that it can
effectively handle different types of CQA tasks. This
suggests that LLMs, when integrated with visualiza-
tions, can serve as a versatile, out-of-the-box alterna-
tive to more complex, custom-built CQA systems.
Moreover, the LLM adapted well to the domain-
specific context of software visualization, e.g., it
showed a deep understanding of the software metrics
and their impact on error proneness. It tailored its
responses to align with the metrics and terminology
relevant to the project, indicating that the integration
of LLMs in domain-specific tasks like software visu-
alization can be highly effective.
Limitations. While the system performs well
within the constraints of the instruction prompt, it
heavily depends on its quality (Subramonyam et al.,
2024). If the prompt fails to cover all potential inter-
actions or describes ambiguities, the LLM’s perfor-
mance may become inconsistent or limited. This re-
liance places a significant burden on the visualization
designer to craft a precise and thorough instruction
set. In our case, the prompt was designed by a domain
expert with knowledge in both software visualization
and prompting, following best practices to prompt de-
sign such as those outlined by OpenAI. However, vi-
sualization designers without prior experience in cre-
ating effective prompts may struggle to develop suit-
able ones (Zamfirescu-Pereira et al., 2023). To miti-
gate this, we provide our prompt as a “blueprint” that
can serve as a foundation for further development.
It is also important to recognize that our findings
are subject to specific threats to validity arising from
our use case study. For instance, in our experiments,
the LLM was able to modify three visual variables and
highlight specific objects effectively. However, with-
out further customization, it may fall short in fully
addressing a user’s more nuanced or complex needs.
Additionally, it remains uncertain how well the sys-
tem scales to visualizations with more visual vari-
ables.
Another threat to validity is that our evaluation
of Delphi was conducted on a single project, the
webgl-operate framework. Testing on just one soft-
ware project limits the generalizability of our find-
ings. While the system performed well in this specific
context, it is unclear how it would handle projects
of different scales, complexities, or domains. Addi-
tionally, the user in our study was a researcher with
expertise in visualization, not a practitioner such as
a software project manager or developer—the target
user group for this system. Although the system was
designed to support users without specialized knowl-
edge in software visualization, the lack of testing with
actual practitioners represents a potential threat to the
validity of our findings. Practitioners may face dif-
IVAPP 2025 - 16th International Conference on Information Visualization Theory and Applications
872

ferent challenges or have different expectations when
interacting with the system.
7 CONCLUSIONS
The effective utilization of these visualizations of-
ten necessitates a solid understanding of visual-
ization theory and software engineering principles.
This knowledge barrier can hinder practitioners from
fully leveraging the benefits of available visualization
tools. In this work, we introduced Delphi, a system
that integrates an NLI with a 2.5D treemap to visual-
ize various aspects related to the complexity and qual-
ity of a software project. The NLI is powered by an
LLM that can modify the visualization, highlight spe-
cific objects, and generate textual responses to user
queries. Through a use case study, we demonstrated
that Delphi effectively addresses questions pertaining
to both the underlying data and the corresponding vi-
sualization, showcasing its potential to enhance pro-
gram comprehension. Our findings show that by pro-
viding the LLM with a formal specification of out-
puts, we achieved strict adherence, resulting in error-
free and consistent visual representations. The LLM
effectively handled a range of CQA queries, demon-
strating its versatility as an out-of-the-box alternative
to complex CQA systems. Overall, the LLM adapted
well to the domain-specific context, reinforcing its
potential in improving user engagement in software
visualization.
We see various directions for future work. One
potential enhancement is to personalize the output
based on the user’s visualization literacy (Ge et al.,
2024). Integrating a feedback channel into the NLI
could facilitate the categorization of users, allowing
for a tailored hidden prompt that adapts the LLM’s
responses to the user’s specific context (Li et al.,
2024). Additionally, we plan to extend Delphi to
handle more classes of visualizations. This exten-
sion will involve developing a specification for the
visualization system that outlines the assignment of
visual variables. To evaluate the impact of the NLI
on interaction efficiency with visualizations, we plan
to develop a benchmark comprising various visualiza-
tions and tasks that correspond to abstract tasks, such
as overview, zoom, filtering, details-on-demand, re-
lation, history, and extraction. Quality metrics will
be employed to quantify the accuracy of the LLM’s
outputs. Ultimately, we aspire to create an abstract
framework that empowers visualization designers to
seamlessly integrate LLMs in the form of NLIs into
their visualizations.
ACKNOWLEDGEMENTS
We want to thank the anonymous reviewers for their
valuable comments and suggestions to improve this
article. Part of this research work is supported by a
PhD grant from the HPI Research School for Service-
Oriented Systems Engineering at the Hasso Plattner
Institute for Digital Engineering, University of Pots-
dam. This work was partially funded by the Federal
Ministry for Economic Affairs and Climate Action
of Germany through grant 16KN086467 (“Decoding-
Food”). The work of Tobias Schreck was supported
by the Austrian FFG-COMET-K1 Center Pro
2
Future
(Products and Production Systems of the Future),
contract No.881844.
REFERENCES
Brooks Jr, F. P. (1995). The Mythical Man-Month: Essays
on Software Engineering. Pearson Education.
Cornelissen, B., Zaidman, A., Holten, D., Moonen, L., van
Deursen, A., and van Wijk, J. J. (2008). Execution
trace analysis through massive sequence and circular
bundle views. Elsevier Journal of Systems and Soft-
ware, 81(12):2252–2268.
Cornelissen, B., Zaidman, A., and van Deursen, A. (2011).
A controlled experiment for program comprehension
through trace visualization. IEEE Transactions on
Software Engineering, 37(3):341–355.
Cui, Y., Ge, L. W., Ding, Y., Harrison, L., Yang, F., and Kay,
M. (2025). Promises and pitfalls: Using large lan-
guage models to generate visualization items. IEEE
Transactions on Visualization and Computer Graph-
ics, 31(1):1094–1104.
Dibia, V. (2023). LIDA: A tool for automatic generation of
grammar-agnostic visualizations and infographics us-
ing large language models. In Proc. 61st Annual Meet-
ing of the Association for Computational Linguistics
(Volume 3: System Demonstrations), pages 113–126.
ACL.
Diehl, S. (2007). Software Visualization: Visualizing
the Structure, Behaviour, and Evolution of Software.
Springer Science & Business Media.
Gao, T., Dontcheva, M., Adar, E., Liu, Z., and Karahalios,
K. G. (2015). DataTone: Managing ambiguity in natu-
ral language interfaces for data visualization. In Proc.
28th Annual ACM Symposium on User Interface Soft-
ware & Technology, UIST ’15, pages 489–500. ACM.
Ge, L. W., Hedayati, M., Cui, Y., Ding, Y., Bonilla, K.,
Joshi, A., Ottley, A., Bach, B., Kwon, B. C., Rapp,
D. N., Peck, E., Padilla, L. M., Correll, M., Borkin,
M. A., Harrison, L., and Kay, M. (2024). Toward
a more comprehensive understanding of visualization
literacy. In Extended Abstracts of the Conference on
Human Factors in Computing Systems, CHI EA ’24.
ACM.
Honglei, T., Wei, S., and Yanan, Z. (2009). The re-
search on software metrics and software complex-
Delphi: A Natural Language Interface for 2.5D Treemap Visualization of Source Code
873

ity metrics. In International Forum on Computer
Science-Technology and Applications, IFCSTA ’09,
pages 131–136. IEEE.
Hoque, E. (2023). NLP4Vis: Natural language
processing for information visualization –
half-day tutorial at IEEE VIS conference
2023. URL: https://nlp4vis.github.io/IEEEVis-
2023/index.html.
Hoque, E., Kavehzadeh, P., and Masry, A. (2022). Chart
question answering: State of the art and future direc-
tions. EG Computer Graphics Forum, 41(3):555–572.
Hsu, T.-Y., Giles, C. L., and Huang, T.-H. (2021). SciCap:
Generating captions for scientific figures. In Find-
ings of the Association for Computational Linguistics:
EMNLP 2021, pages 3258–3264. ACL.
Kantharaj, S., Leong, R. T., Lin, X., Masry, A., Thakkar,
M., Hoque, E., and Joty, S. (2022). Chart-to-Text:
A large-scale benchmark for chart summarization. In
Proc. 60th Annual Meeting of the Association for
Computational Linguistics (Volume 1: Long Papers),
pages 4005–4023. ACL.
Kim, D. H., Hoque, E., and Agrawala, M. (2020). Answer-
ing questions about charts and generating visual ex-
planations. In Proc. Conference on Human Factors in
Computing Systems, CHI ’20. ACM.
Kim, Y., Lee, J., Kim, S., Park, J., and Kim, J. (2024). Un-
derstanding users’ dissatisfaction with ChatGPT re-
sponses: Types, resolving tactics, and the effect of
knowledge level. In Proc. 29th International Con-
ference on Intelligent User Interfaces, IUI ’24, pages
385–404. ACM.
Lanza, M. (2001). The Evolution Matrix: Recovering
software evolution using software visualization tech-
niques. In Proc. 4th International Workshop on Prin-
ciples of Software Evolution, IWPSE ’01, pages 37–
42. ACM.
Li, C., Zhang, M., Mei, Q., Kong, W., and Bendersky, M.
(2024). Learning to rewrite prompts for personalized
text generation. In Proc. ACM on Web Conference
2024, WWW ’24, pages 3367–3378. ACM.
Limberger, D., Scheibel, W., D
¨
ollner, J., and Trapp, M.
(2022). Visual variables and configuration of software
maps. Springer Journal of Visualization, 26:249–274.
Limberger, D., Trapp, M., and D
¨
ollner, J. (2020). Depicting
uncertainty in 2.5D treemaps. In Proc. 13th Interna-
tional Symposium on Visual Information Communica-
tion and Interaction, VINCI ’20, pages 28:1–2. ACM.
Liu, M. X., Liu, F., Fiannaca, A. J., Koo, T., Dixon, L.,
Terry, M., and Cai, C. J. (2024). “We Need Structured
Output”: Towards user-centered constraints on large
language model output. In Extended Abstracts of the
Conference on Human Factors in Computing Systems,
CHI EA ’24. ACM.
Maddigan, P. and Susnjak, T. (2023). Chat2VIS: Generating
data visualizations via natural language using Chat-
GPT, Codex and GPT-3 large language models. IEEE
Access, 11:45181–45193.
Malony, A., Hammerslag, D., and Jablonowski, D. (1991).
Traceview: a trace visualization tool. IEEE Software,
8(5):19–28.
Masry, A., Do, X. L., Tan, J. Q., Joty, S., and Hoque, E.
(2022). ChartQA: A benchmark for question answer-
ing about charts with visual and logical reasoning. In
Findings of the Association for Computational Lin-
guistics: ACL 2022, pages 2263–2279. ACL.
Menzies, T. and Zimmermann, T. (2013). Software analyt-
ics: So what? IEEE Software, 30:31–37.
OpenAI (2024). OpenAI documentation.
URL: https://platform.openai.com/docs/overview.
Scheibel, W., Blum, J., Lauterbach, F., Atzberger, D., and
D
¨
ollner, J. (2024). Integrated visual software ana-
lytics on the GitHub platform. MDPI Computers,
13(2):33:1–23.
Scheibel, W., Limberger, D., and D
¨
ollner, J. (2020a). Sur-
vey of treemap layout algorithms. In Proc. 13th In-
ternational Symposium on Visual Information Com-
munication and Interaction, VINCI ’20, pages 1:1–9.
ACM.
Scheibel, W., Trapp, M., Limberger, D., and D
¨
ollner, J.
(2020b). A taxonomy of treemap visualization tech-
niques. In Proc. 15th International Joint Conference
on Computer Vision, Imaging and Computer Graphics
Theory and Applications – Volume 3: IVAPP, IVAPP
’20, pages 273–280. INSTICC, SciTePress.
Setlur, V., Battersby, S. E., Tory, M., Gossweiler, R., and
Chang, A. X. (2016). Eviza: A natural language in-
terface for visual analysis. In Proc. 29th Annual Sym-
posium on User Interface Software and Technology,
UIST ’16, pages 365–377. ACM.
Shen, L., Shen, E., Luo, Y., Yang, X., Hu, X., Zhang,
X., Tai, Z., and Wang, J. (2023). Towards natu-
ral language interfaces for data visualization: A sur-
vey. IEEE Transactions on Visualization and Com-
puter Graphics, 29(6):3121–3144.
Steinbr
¨
uckner, F. and Lewerentz, C. (2013). Understanding
software evolution with Software Cities. SAGE Infor-
mation Visualization, 12(2):200–216.
Subramonyam, H., Pea, R., Pondoc, C., Agrawala, M., and
Seifert, C. (2024). Bridging the gulf of envision-
ing: Cognitive challenges in prompt based interac-
tions with LLMs. In Proc. Conference on Human Fac-
tors in Computing Systems, CHI ’24. ACM.
Tian, Y., Cui, W., Deng, D., Yi, X., Yang, Y., Zhang, H.,
and Wu, Y. (2024). ChartGPT: Leveraging LLMs to
generate charts from abstract natural language. IEEE
Transactions on Visualization and Computer Graph-
ics. Early Access.
Voigt, H., Alacam, O., Meuschke, M., Lawonn, K., and
Zarrieß, S. (2022). The why and the how: A survey on
natural language interaction in visualization. In Proc.
Conference of the North American Chapter of the As-
sociation for Computational Linguistics: Human Lan-
guage Technologies, pages 348–374. ACL.
Wettel, R. and Lanza, M. (2007). Visualizing software sys-
tems as cities. In Proc. 4th International Workshop on
Visualizing Software for Understanding and Analysis,
VISSOFT, pages 92–99. IEEE.
Zamfirescu-Pereira, J., Wong, R. Y., Hartmann, B., and
Yang, Q. (2023). Why Johnny can’t prompt: How
non-AI experts try (and fail) to design LLM prompts.
In Proc. Conference on Human Factors in Computing
Systems, CHI ’23. ACM.
IVAPP 2025 - 16th International Conference on Information Visualization Theory and Applications
874
