
Towards Enhanced Decision Making: Integrating Weighted Expected
Solution Points in Multi-Criteria Analysis
Andrii Shekhovtsov
1,2 a
, Bartłomiej Kizielewicz
1,2 b
and Wojciech Sałabun
1,2 c
1
West Pomeranian Univ. of Technology
˙
Zołnierska 49, 71-210 Szczecin, Poland
2
National Institute of Telecommunications Szachowa 1, 04-894 Warsaw, Poland
Keywords:
MCDA, Multi-Criterion Decision-Making, Fuzzy Logic, Expected Solution, COMET.
Abstract:
Multi-Criteria Decision Analysis (MCDA) addresses complex problems across various domains by consider-
ing multiple decision criteria. This interdisciplinary field offers a systematic approach to decision-making,
accommodating contradictory criteria and non-linear factors. Reference points are crucial in MCDA, facilitat-
ing a nuanced understanding of decision interrelationships and outcomes. While classic MCDA methods rely
on static reference points, recent advances introduce manual allocation mechanisms, such as the Stable Pref-
erence Ordering Toward Ideal Solution (SPOTIS) and Characteristic Objects Method (COMET). However,
incorporating reference points alone may overlook the significance of individual criteria, leading to the para-
dox of equal evaluations. To address this issue, an extension of the COMET method, Expected Solution Point
(ESP-COMET), introduces weighted considerations to accurately reflect experts’ preferences. This paper pro-
poses a methodology to integrate weights into ESP-COMET, enhancing its efficacy in decision modeling. We
applied the proposed approach in the case study focused on the evaluation of hydrogen-fueled vehicles. Iden-
tifying the decision model and considering both the expected solution point and the relevance of the criteria to
it, we demonstrated the utility of weighted ESP in improving decision-making processes.
1 INTRODUCTION
Multi-Criteria Decision Analysis (MCDA) is an in-
terdisciplinary field that analyzes decisions in the
context of multiple criteria. It is used when faced
with complex problems, considering various factors.
These criteria may frequently conflict with one an-
other, as they embody various priorities like effi-
ciency, profit, or other considerations. An essential
element of MCDA is the consideration of non-linear
criteria that may be relevant to the analysis. MCDA is
used in various areas, from energy to medicine (Saraji
et al., 2023; Kizielewicz et al., 2020), logistics to sus-
tainability issues (Moslem, 2023; Wi˛eckowski et al.,
2024).
MCDA, using a variety of mechanisms, is an ef-
fective tool to solve such problems. Approaches re-
lying on pairwise comparisons prove advantageous
when experts aim to identify the model based on their
knowledge. Alternatively, methods dependent on the
a
https://orcid.org/0000-0002-0834-2019
b
https://orcid.org/0000-0001-5736-4014
c
https://orcid.org/0000-0001-7076-2519
coefficients of individual components facilitate adapt-
able decision making by permitting dynamic adjust-
ments to these coefficient values. In addition, meth-
ods that use reference points efficiently represent the
decision grid by focusing solely on these reference
points.
Using reference points makes it possible to better
understand the relationships between different deci-
sion criteria and assess how changes in these criteria
affect the outcome of a decision. Reference points
form the basis of many classic MCDA methods, such
as the Technique for Order of Preference by Similar-
ity to Ideal Solution (TOPSIS) (Aldino et al., 2023)
and the Viekriterijumsko Kompromisno Rangiranje
(VIKOR) (Nath et al., 2023). In addition, the logic of
reference points is also reflected in newer approaches
such as Compromise Ranking of Alternatives from
Distance to Ideal Solution (CRADIS) (Chakraborty
et al., 2024).
However, the methods above operate on statically
defined reference points based on a decision matrix.
With reference points, decision experts can better
reflect their preferences, which has resulted in the de-
velopment of methods that allow experts to allocate
272
Shekhovtsov, A., Kizielewicz, B. and Sałabun, W.
Towards Enhanced Decision Making: Integrating Weighted Expected Solution Points in Multi-Criteria Analysis.
DOI: 10.5220/0013120100003890
In Proceedings of the 17th International Conference on Agents and Artificial Intelligence (ICAART 2025) - Volume 3, pages 272-279
ISBN: 978-989-758-737-5; ISSN: 2184-433X
Copyright © 2025 by Paper published under CC license (CC BY-NC-ND 4.0)

these points manually. The logic behind such man-
ual mechanisms assumes that the decision expert for
a given problem assigns his ideal values to specific
criteria. Thus, to normalize the decision space, these
very objects are used. In addition, using fixed val-
ues for these objects with fixed boundaries of the de-
cision problem allows the method to be immune to
the rank-reversal paradox. Examples of these meth-
ods are methods that will allow reference points to
be used in this way include Stable Preference Order-
ing Toward Ideal Solution (SPOTIS) (Dezert et al.,
2020) and Characteristic Objects Method (COMET)
(Shekhovtsov et al., 2023).
In the SPOTIS approach methods, an expert de-
termines a single point that forms the basis for a de-
cision grid. The COMET approach, on the other
hand, is based on fuzzy logic, specifically the Mam-
dani model, where characteristic objects are created
based on specific characteristic values. This raises a
dimensionality problem, where the expert is forced
to compare characteristic objects among themselves
to get the right preference. To solve this prob-
lem, (Shekhovtsov et al., 2023) proposed an exten-
sion of the COMET method with the Expected So-
lution Point (ESP-COMET). With this approach, an
expected point is assigned based on which the pref-
erence values of the characteristic objects are deter-
mined. This eliminates the difficulty of an expert
evaluating a high-dimensional problem and facilitates
comparing objects.
However, with this solution, there is another prob-
lem related to the relevance of the criteria. Using ESP
alone allows for grid modeling to evaluate alternatives
according to a declared reference point. However, it
does not consider the relevance of individual criteria
to that point. Therefore, this paper will focus on a pro-
posal to add weight to ESP-COMET to better reflect
the preferences of experts. In the remainder of the pa-
per, we will present the process of identifying such
a model and its practical implementation, using the
example of evaluating hydrogen-powered vehicles.
The remainder of the paper is organized as fol-
lows. Section 2 presents related work in relation to
the topic of decision making. Section 3 presents the
methodology, with the initial assumptions related to
the COMET method, the expanded COMET method
with ESP and correlation coefficients. Section 3.2 dis-
cusses the proposed approach. Section 4 presents a
simple example related to weighting the expected so-
lution point. Section 5 presents research on a practical
problem related to hydrogen-powered cars. Section 6
presents conclusions and future research propositions.
2 RELATED WORKS
Methods based on reference objects have gained sig-
nificant attention and are widely applied across vari-
ous fields due to their robust ability to handle complex
multi-criteria decision-making processes. For exam-
ple, (Awodi et al., 2023) developed a fuzzy TOPSIS-
based risk assessment model to effectively man-
age the risks associated with nuclear decommission-
ing. This approach allowed for a more nuanced as-
sessment by incorporating uncertainty through fuzzy
logic. Similarly, (Aldino et al., 2023) used the TOP-
SIS method with an alternative weighting procedure
to identify the highest performing graduates, demon-
strating the versatility of the method in educational
evaluation.
In the context of sustainable technologies,
(Wi˛eckowski et al., 2024) applied the RANking
COMparison (RANCOM) method in combination
with ESP-SPOTIS to optimize decision making for
the selection of electric vehicles, highlighting the flex-
ibility of SPOTIS in handling adaptive systems.
Moreover, (Nath et al., 2023) proposed a VIKOR
framework for biodiesel production using heteroge-
neous agricultural waste-based catalysts. Their work
underscores the adaptability of VIKOR in sustainable
energy research. (Saraji et al., 2023) utilized the Fer-
matean CRITIC-VIKOR approach to assess the chal-
lenges in implementing renewable energy technolo-
gies in rural areas, demonstrating the applicability of
the method to assess complex technological adoption
scenarios.
On the other hand, pairwise comparison methods,
such as the Analytic Hierarchy Process (AHP) and
ELimination Et Choix Traduisant la REalité (ELEC-
TRE), compare alternatives in pairs, judging which
of the two performs better relative to specific crite-
ria. These techniques are instrumental when the di-
rect comparison between multiple criteria is complex,
allowing for a more gradual and structured evaluation
process.
In his work, (Romero-Ramos et al., 2023) inte-
grated a GIS-AHP approach to assess the potential of
solar energy to meet the demand for heat in indus-
trial areas in the south-eastern part of Spain. This
study demonstrates the effectiveness of AHP in spa-
tial decision-making, combining geographical data
with multi-criteria evaluation. Similarly, (Ahadi et al.,
2023) used the AHP method to determine the opti-
mal site for a solar power plant in Iran, highlighting
the utility of AHP in planning energy infrastructure,
mainly when multiple conflicting criteria such as land
use, environmental impact and cost are involved.
Towards Enhanced Decision Making: Integrating Weighted Expected Solution Points in Multi-Criteria Analysis
273
While the discussed methods provide valuable
frameworks for multi-criteria evaluations, they often
lack a comprehensive approach that enables decision-
makers or experts to express their preferences and in-
sights in a clear and transparent manner. Address-
ing this limitation we propose a novel weighted ESP-
COMET approach. This method aims to offer a more
holistic solution, enhancing the ability of decision-
makers to provide their judgments while maintaining
the robustness of the decision-making process.
3 METHODOLOGY
In this paper, we focus on our proposed weighting
method within the ESP-COMET approach introduced
by (Shekhovtsov et al., 2023). To this end, we devel-
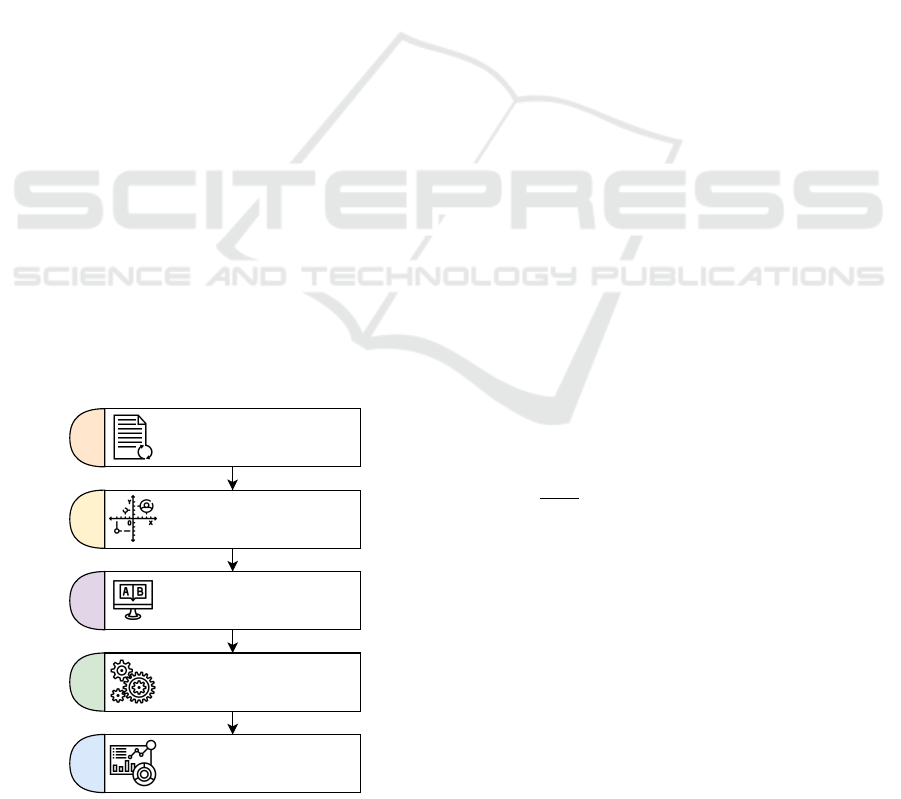
oped a framework consisting of five stages. The first
stage involved creating research data to evaluate the
new approach. For this purpose, we utilized an en-
vironment created in Python, and the data was gener-
ated from a uniform distribution. In the next stage, we
implement the proposed weighted ESP-COMET ap-
proach. After its implementation, we moved on to the
third stage, where we compared the unweighted ESP-
COMET approach with our proposal. Once the dif-
ferences between these approaches were determined,
a simulation was created in which ESP-based ap-
proaches with weighting options, such as SPOTIS and
our proposed ESP-COMET, were applied. In the fi-
nal fifth stage, we analyze the approaches using the
weighted Spearman correlation coefficient (r
w
). The
entire framework of the work is presented in Figure 1,
while the techniques used and the details of our pro-
posed approach are discussed in subsequent sections.
Data generation
Proposal for an ESP weighting
approach in COMET
Comparative research
Simulation studies
Analysis of results
1
2
3
4
5
Figure 1: The framework of the proposed approach.
3.1 Preliminaries
3.1.1 Characteristic Objects Method
The Characteristic Objects Method (COMET) is
a distinctive Multiple Criteria Decision Analysis
(MCDA) approach that is completely resistant to
the ranking reversal phenomenon. This method en-
sures consistent and unequivocal results regardless of
changes in the set of alternatives (Kizielewicz et al.,
2021). The main steps of the COMET algorithm are
as follows:
Step 1. Identify the criteria of the decision problem
and represent each criterion using fuzzy numbers.
Step 2. Create a set of Characteristic Objects by ap-
plying the Cartesian product of fuzzy numbers, repre-
senting all potential combinations.
Step 3. Conduct pairwise comparisons of the Charac-
teristic Objects based on expert judgment, summarize
these judgments, and compute preference values.
Step 4. Transform each characteristic object and its
associated preference value into a fuzzy rule.
Step 5. Utilize the fuzzy rule base along with Mam-
dani’s inference method to assess and rank alterna-
tives, where higher preference values indicate better
alternatives.
The complete algorithm of the COMET method
can be found in (Kizielewicz et al., 2021), while
the implementation of this method is presented
(Kizielewicz et al., 2023).
3.1.2 Expected Solution Point COMET
Expected Solution Point COMET was created as an
answer to the dimensionality problem in the standard
COMET procedure (Shekhovtsov et al., 2023). This
problem appears when the Matrix of Expert Judge-
ments (MEJ) should be identified by an expert. Sup-
pose that we have t characteristic objects, therefore,
the identification of the MEJ matrix of size t ×t will
require
t(t−1)
2
pairwise comparisons. This makes it
difficult to identify the decision model due to the large
number of pairwise comparisons required.
To answer that, ESP-COMET was proposed, cre-
ating the alternative way to identify the pairwise com-
parison matrix. To use it, first, the expert or decision
maker should define the n Expected Solution Points
based on their preferences and domain knowledge.
Each of the ESP vectors consists of r values, where
r is a number of criteria in the decision problem (1).
ESP =
esp
i j
n×r
(1)
ESP-COMET uses Equation (2), which incorpo-
rates the function f
ESP
. This function computes an
ICAART 2025 - 17th International Conference on Agents and Artificial Intelligence
274

aggregated normalized distance from predefined Ex-
pected Solution Points concerning a characteristic ob-
ject. A smaller distance indicates a preferable charac-
teristic object.
α
i j
=
1.0, f
ESP
(CO
i
) < f
ESP
(CO
j
)
0.5, f
ESP
(CO
i
) = f
ESP
(CO
j
)
0.0, f
ESP
(CO
i
) > f
ESP
(CO
j
)
, (2)
The function f
ESP
(CO
i
) is defined as (3).
f
ESP
(X) = min
i
s
r
∑
j=1
(x
′
j
− esp
′
i j
)
2
(3)
In Equation (3), X represents the abstract Char-
acteristic Object, comprising the values x
j
, where
j ∈ 1, 2, . . . , r, and esp
i j
denotes the expected value
i for the criterion j. The values x
′
j
and esp
′
i j
represent
the normalized counterparts of x
j
and esp
i j
, respec-
tively, computed using Equation (4). This normal-
ization process relies on the values c
(min)
j
and c
(max)
j
,
which denote the smallest and largest characteristic
values for criterion j. The same normalization proce-
dure outlined in Equation (4) is applied to each ESP.
x
′
j
=
x
j
− c
(min)
j
c
(max)
j
− c
(min)
j
, (4)
where c
(min)
j
and c
(max)
j
denote the minimum and
maximum characteristic values within criterion C
j
.
3.1.3 Similarity Coefficients
In this work, we use two similarity coefficients to
measure the differences between the rankings and
weights.
The Weighted Spearman’s correlation coefficient
(Dancelli et al., 2013) extends the traditional Spear-
man coefficient by incorporating weights, emphasiz-
ing changes at the top of the rankings. It evaluates the
correlation between two rankings, with values rang-
ing from -1 (reversed rankings) to 1 (identical rank-
ings), and 0 indicating no correlation.
The Weights Similarity Coefficient (Shekhovtsov,
2023) provides a robust measure for comparing differ-
ences in sets of criteria weights. It uses the Manhat-
tan distance, normalized for cross-set comparability,
to quantify dissimilarities, offering a similarity value
scaled between 0 and 1.
3.2 Proposed Approach
The paper which introduced the ESP-COMET ap-
proach focuses mainly on the idea of the approach
and the influence of the selection of characteristic ob-
jects on the identification of the preference function
and therefore the accuracy of the model (Shekhovtsov
et al., 2023). However, this paper missed the impor-
tant point of weighting the distances to ESP during
the aggregation process. This paper addresses this is-
sue by introducing the weighting mechanism to the
ESP-COMET method and investigates it’s properties.
To introduce the weights into the ESP-COMET
method, we modify Equation (3), adding the weight
vector to it (5):
f
ESP
(X) = min
i
s
r
∑
j=1
w
j
· (x
′
j
− esp
′
i j
)
2
, (5)
Where w
j
is the importance weight for the jth cri-
terion. Such modification of the algorithm allows us
to simply manipulate the importance of the weights
by the expert if needed. This paper focuses on this
version. However, it is possible to extend the ap-
proach further, introducing weight sets for different
ESP, and also providing ability to weight ESP points.
4 SIMPLE EXAMPLE
To demonstrate our proposed approach, we first want
to apply it to a simple two-criterion problem. This
simple example contains two criteria, each in the
range [0, 10], with chosen ESP {3, 3} as shown on the
leftmost part of Figure 3. All of those values were ar-
bitrary selected, as they will best illustrate the changes
of the preference function.
In this example we compare unweighted ver-
sion of the ESP-COMET (which can be considered
weighted with equal weights) with weighted ESP with
the weights vector w
ESP
= {0.01, 0.99}.
Such extreme change in the weights will in our
opinion show how big can be change in the preference
function when weights are introduced.
The comparison results are presented in Table 1,
which contains the indices of the characteristic ob-
jects (COs) evaluatedCO
i
as well as the criteria values
for these characteristic objects (C
1
and C
2
). Next, we
include preferences for these COs for normal P
U
and
weighted P
W
algorithms, as well as respective rank-
ings of characteristic objects R
U
and R
W
.
Analyzing Table 1 one can notice that in the case
of the unweighted method there are several links, such
as the link between CO
2
and CO
4
, CO
6
and CO
8
and
others. This can be easily explained by the fact that
those characteristic objects have the same distance to
the ESP and are therefore treated equally. In case of
weighted ESP however, we can see that weights work
Towards Enhanced Decision Making: Integrating Weighted Expected Solution Points in Multi-Criteria Analysis
275

correctly, introducing the change in the ranking. CO
5
which has the same criteria values as ESP is placed
first in both rankings, and COs such CO
9
and CO
3
that are most distant from ESP are ranked worst.
Table 1: Preferences and rankings of unweighted (P
U
, R
U
)
and weighted (P
W
, R
W
) ESP models.
CO
i
C
1
C
2
P
U
P
W
R
U
R
W
CO
1
0 0 0.6000 0.5000 4 5
CO
2
0 3 0.8000 0.8750 2.5 2
CO
3
0 10 0.2000 0.1250 7.5 8
CO
4
3 0 0.8000 0.6250 2.5 4
CO
5
3 3 1.0000 1.0000 1 1
CO
6
3 10 0.4000 0.2500 5.5 7
CO
7
10 0 0.2000 0.3750 7.5 6
CO
8
10 3 0.4000 0.7500 5.5 3
CO
9
10 10 0.0000 0.0000 9 9
In addition, we calculate several numerical co-
efficients to show how different those rankings and
preferences are. First, the value of the coefficient
W SC
2
between equal weights and the vector w =
{0.01, 0.99} used in this example is 0.5100, which is
the maximum value of W SC
2
which can be obtained
by measuring the difference with equal weights. Next,
we evaluate preferences and CO ranking, obtain-
ing Weighted Spearman’s correlation r
w
0.8752 and
Mean Absolute Error (MAE) 0.1222. Both these val-
ues point that these rankings and preferences are sim-
ilar, and of order of the characteristic objects in rank-
ing are generally preserved, however, weighted ver-
sion has no ties.
In Figure 2 we present two identified MEJ ma-
trices, respectively, for unweighted, weighted ESP-
COMET models and the absolute difference between
those MEJ matrices. As can be seen, the introduction
of weights mostly influences ties, but there are also
changes (i.e., in the 8 th row, for CO
8
), which explain
the change in the preference and ranking position for
CO
8
.
Next, in Figure 3, the preference functions are
presented for both the unweighted and the weighted
ESP-COMET models. We also present the differ-
ence between them, calculated as values of the pref-
erence function for the unweighted model reduced by
the corresponding values of the weighted model. In
case of chosen weights, it can be seen that a darker re-
gion with higher preference values is stretched among
C
1
values, instead of concentrating around the ESP as
was in case of unweighted ESP. From the difference,
it can be seen that the preferences for CO
8
= {10, 3}
and for the region adjusted to it change the most.
The preference value of CO
8
changed from 0.400 to
0.750 after weighting was introduced, implying such
a large change in the preference function. The Char-
acteristic Objects for CO
4
= {3, 0} and CO
6
= {3, 10}
are removed after the weights are introduced, which
can also be seen in the visualization of the differ-
ences. Only the most distant characteristic object
CO
9
= {10, 10} does not change its preference value,
which remains 0 for both weighted and unweighted
models.
5 CASE STUDY
However, since a simple example does not present
real data, we decided to present our approach to the
real-world data collected for the purpose of this re-
search. With the increasing popularity of alternative
fuel for cars, we present a case study of choosing the
most suitable hydrogen car, based on the data col-
lected from the manufacturers’ web pages.
The cars are evaluated using the criteria presented
in Table 2. The minimum and maximum values are ar-
bitrarily chosen based on the collected data to build a
model that fits all the alternatives chosen. The weights
of the criteria were calculated using the RANCOM
method (Wi˛eckowski et al., 2023) and the ESP was
arbitrary chosen by the decision maker, based on their
needs and expectations for the car. According to the
input of the decision maker, the most important cri-
terion for them is price, followed by range and tank
capacity. The least important criterion is year, which
is expected, because the range for years is quite small.
Table 2: Criteria description, as well as the weights deter-
mined using the RANCOM method.
C
i
Crit. names Units w
j
ESP Min Max
C
1
Year – 0.012 2023 2015 2024
C
2
Est. Price $k 0.210 30 30 100
C
3
Range km 0.173 800 400 800
C
4
Power output KW 0.111 200 100 400
C
5
Tank cap. kg 0.173 6 4.4 6.5
C
6
Horse power – 0.136 130 130 550
C
7
Max torque Nm 0.062 300 260 410
C
8
0 to 100 time s 0.050 8 4.5 12.5
C
9
Max speed km/h 0.074 150 130 250
Data for the hydrogen cars chosen for the evalua-
tion are presented in Table 3. It can be seen that most
of the cars are actually new, with only A
6
being an
outlier in the year criterion. The price and other cri-
terion values are different, and there is no simple way
to decide which one is will fit the decision-maker’s
expectations best. The data of the alternatives was
collected from the manufacturers’ web pages.
We evaluated the data presented in Table 3 with
both ESP-COMET and weighted ESP-COMET using
the weights shown in Table 2. The results of the com-
ICAART 2025 - 17th International Conference on Agents and Artificial Intelligence
276
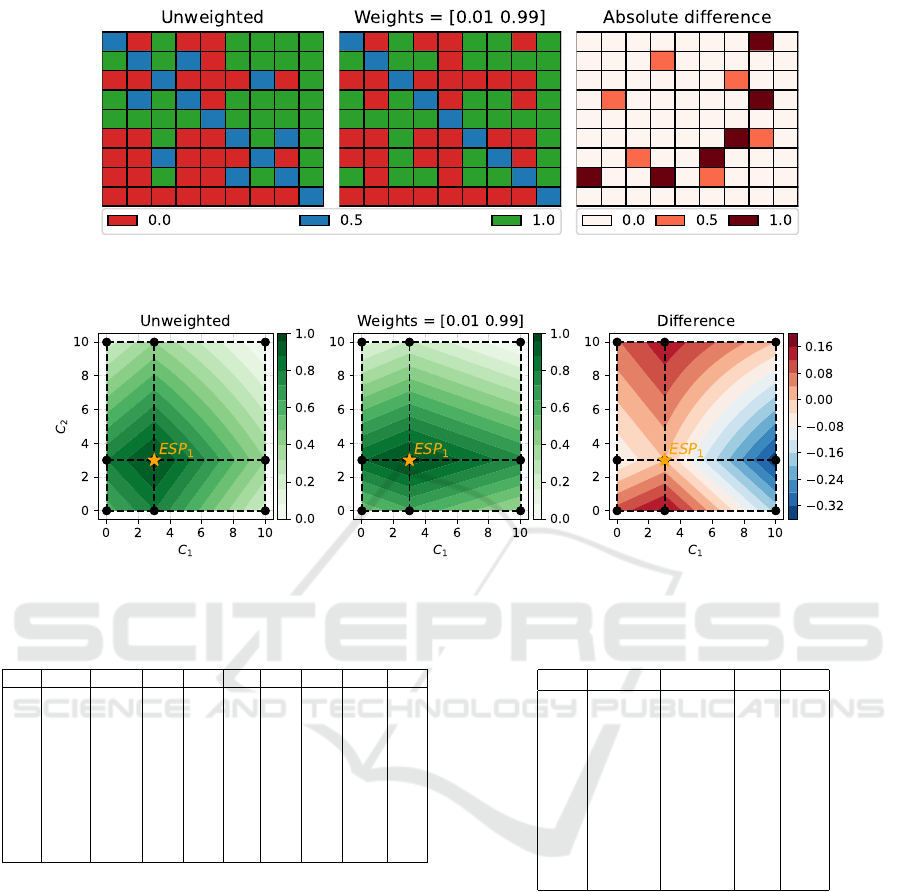
Figure 2: Identified MEJ for unweighted (left) and weighted (center) ESP-COMET and difference between these two functions
(right), characteristic objects are represented by the black dots.
Figure 3: Contour representation of the preference functions for unweighted (left), weighted (center) ESP-COMET and
difference between these two functions (right), characteristic objects are represented by the black dots.
Table 3: Data of the alternatives.
C
1
C
2
C
3
C
4
C
5
C
6
C
7
C
8
C
9
A
1
2023 50.0 646 128 5.6 182 406 9.2 161
A
2
2023 60.0 612 135 6.3 161 394 9.2 179
A
3
2021 59.0 579 103 5.5 174 299 9.0 165
A
4
2019 45.0 437 155 4.4 211 364 5.8 160
A
5
2022 30.0 400 150 4.4 134 260 7.8 130
A
6
2015 66.5 594 100 5.6 136 406 12.5 160
A
7
2024 90.0 504 295 6.0 401 347 6.0 180
A
8
2023 45.0 590 134 5.6 182 300 7.8 170
A
9
2022 68.0 800 220 5.4 300 347 6.5 200
A
10
2022 100.0 800 400 5.4 550 347 4.5 250
putations are presented in Table 4. We first present
preferences for unweighted (P
U
) and weighted (P
W
)
models, as well as respective rankings R
U
and R
W
.
Change in weights introduces several changes in the
ranking, however, alternative A
8
, which has the best
preference, and alternatives A
7
and A
10
which per-
form the worst preserve their positions in the rank-
ings. Three alternatives worsen their position in the
ranking, and four alternatives improved. For exam-
ple, alternatives A
1
and A
2
moved from third and fifth
positions to second and third, because they have a bet-
ter price to other criteria ratio.
The differences in both rankings are clearly visible
in the visualization in Figure 5. In this visualization,
every dot represents an alternative, and the x coordi-
nate of the dot represents its position in the R
U
rank-
Table 4: Case study result.
A
i
P
U
P
W
R
U
R
W
A
1
0.8367 0.8275 3 2
A
2
0.8111 0.7974 5 3
A
3
0.8193 0.7767 4 6
A
4
0.5798 0.6218 7 8
A
5
0.8493 0.7942 2 4
A
6
0.5404 0.7182 8 7
A
7
0.5271 0.4408 9 9
A
8
0.9054 0.8556 1 1
A
9
0.7803 0.7855 6 5
A
10
0.2907 0.3294 10 10
ing and the y coordinate represents the position in the
R
W
ranking. It can be seen that deviations from the di-
agonal are not big, implying that rankings are rather
similar. This is also confirmed by the Weighted Spear-
man correlation coefficient, which is equal to 0.9012
for these two rankings. Similarly, W SC
2
value be-
tween equal weights and weights computed using the
RANCOM methods is 0.7531, which show that these
weight vectors are similar. For characteristic objects,
we provide only the value r
w
between their classifica-
tions, which is 0.8843. The number of characteristic
objects for this problem is 729, and, therefore, it can
be represented or visualized in readable form.
Results obtained in this case study shows, that in
this particular problem weights does not strongly in-
Towards Enhanced Decision Making: Integrating Weighted Expected Solution Points in Multi-Criteria Analysis
277
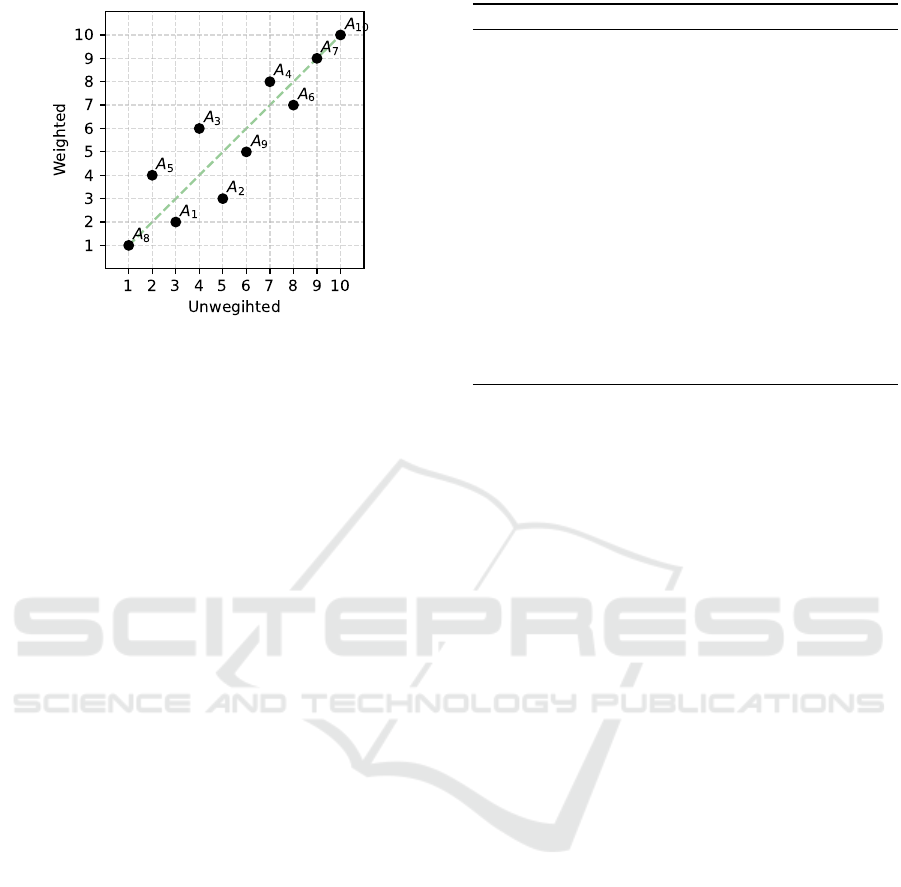
Figure 4: Visual difference of the rankings for the weighted
and unweighted ESP-COMET models.
fluence the final ranking, however this needs to be in-
vestigated further.
5.1 Simulation Experiment
In order to investigate how strong the influence of
the weights is in the ESP-COMET approach, we de-
sign a simple simulation experiment. This experi-
ment is based on the data derived from the case study
of hydrogen cars previously presented. We use the
same criteria and ESP as provided in Table 2, and
then change the weights to check how much different
results we can obtain (compared to the unweighted
ESP-COMET).
We also include the Stable Preference Ordering
Towards Ideal Solution (SPOTIS) method in the sim-
ulation, as this method is ESP-capable and therefore
can be compared with the COMET method. The sim-
ulation experiment is described with Algorithm 1. For
this experiment, we first need to define the decision
problem consists of characteristic values cv and the
decision matrix X, as well as ESP and the number of
iterations to make in the simulation. Next, we calcu-
late the rankings R
U
for alternatives from X and the
rankings of the characteristic objects using the stan-
dard ESP-COMET procedure (line 1). Additionally,
in line 2 we calculate the ranking of the alternatives
R
SE
using the SPOTIS method and defined ESP. Next,
in lines 3-10 we repeat n = 10000 calculations of
these rankings, but with randomly generated weights
w
R
. The sum of random weights w
R
is ensured to be
equal to 1. Next, with this weight, we calculate the
ranking of alternatives R
W
and the ranking of charac-
teristic objects R
CO
W
using the weighted ESP-COMET
algorithm. Next, we also calculate the ranking R
SW
using the SPOTIS approach and the same random
weight vector. Finally, we memorize all the results
for further analysis.
Algorithm 1: Algorithm of the simulation research.
Input: Number of iterations n ← 10000
Input: Decision matrix X
Input: Expected Solution Point ESP
Input: Characteristic values cv
1: R
U
, R
CO
U
← ESP_COMET (X, ESP)
2: R
SE
← SPOT IS(X , ESP, w
E
)
3: for i ← 1, 2, . . . , n do
4: w
R
← random_weights()
5: R
W
, R
CO
W
← wESP_COMET (X, ESP, w
R
)
6: R
SW
← SPOT IS(X , ESP, w
R
)
7: Write r
w
between R
U
and R
W
8: Write r
w
between R
SE
and R
SW
9: Write r
w
between R
CO
U
and R
CO
W
10: end for
Output: Collected r
w
values for different rankings.
The results of the simulation are presented in Fig-
ure 5 in the form of box plots. This visualization
presents the distributions of the r
w
values between
the classification calculated with equal weights and
the weights generated randomly. It can be seen that
the values of both methods r
w
(named COMET and
SPOTIS in the visualization) have a similar range
[0.5, 1.0], however, the quantiles and the average val-
ues are different. When weighted ESP-COMET is
used, the average r
w
values between the classifica-
tion build with equal weights and random weights is
≈ 0.92, however, in the case of the SPOTIS method
the average r
w
is ≈ 0.85, which is lower. The aver-
age value of r
w
is also higher in case of ranking of
the Characteristic objects (”COs” label). Such good
correlations can be explained with the fact that alter-
natives in the COMET methods are evaluated based
on COs and not based on the weights, and because
the distances between characteristic objects are usu-
ally larger than between alternatives, it is less pos-
sible to have changes in order of alternatives, when
weights and order of characteristic objects have some
small changes. This implies that ESP-COMET is a
more robust and stable approach.
6 CONCLUSIONS
This paper presents an essential aspect of the ESP-
COMET algorithm, introducing the weighting mech-
anism and examining changes in the preference func-
tion and the method’s stability. We present the ap-
plication of the method to a simple example, con-
sisting of two criteria, where we observe changes in
the adaptation of the decision map and the effect of
ESP weights on its formation. In addition, the paper
ICAART 2025 - 17th International Conference on Agents and Artificial Intelligence
278
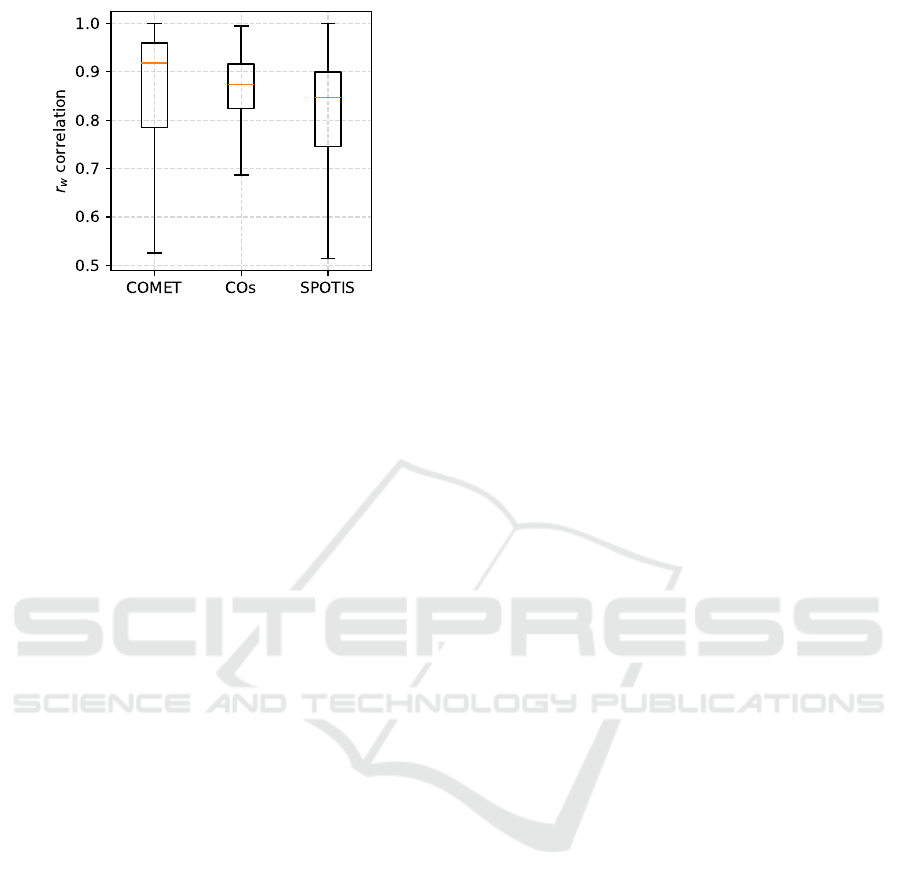
Figure 5: Results of the comparison of 10000 models with
random weights and unweighted ESP-COMET on alterna-
tives and characteristic objects rankings.
presents a practical example related to the evaluation
of hydrogen cars. Based on the study, the proposed
approach shows high application potential. Moreover,
comparing it with the SPOTIS method, it turns out
that the influence of the weights on the final ranking
is more limited, which translates into obtaining stable
rankings, resistant to slight deviations in the weights.
However, this method needs future investigations.
One of the feature of this methods is a possibility for
providing several ESP points, which can be used to
introduce more complex weighting algorithms. Such
algorithms are useful in group decision making and
other complex decision scenarios. In addition, con-
sideration should be given to integrating this tool for
possible re-identification of MCDA models, where
the research direction may be a Stochastic Identi-
fication of Weights (SITW) - ESP-COMET hybrid
(Kizielewicz et al., 2024).
ACKNOWLEDGMENTS
The work was supported by the National Science Cen-
tre 2021/41/B/HS4/01296.
REFERENCES
Ahadi, P. et al. (2023). Optimal site selection for a solar
power plant in Iran via the Analytic Hierarchy Process
(AHP). Renewable Energy, 215:118944.
Aldino, A. A. et al. (2023). Determining best graduates
using topsis with surrogate weighting procedures ap-
proach. In IConNECT, pages 60–64. IEEE.
Awodi, N. J. et al. (2023). Fuzzy TOPSIS-based risk assess-
ment model for effective nuclear decommissioning
risk management. Progr. in Nucl. Ener., 155:104524.
Chakraborty, S. et al. (2024). Compromise Ranking of Al-
ternatives from Distance to Ideal Solution (CRADIS)
Method. In MCDM Methods in Manuf. Env., pages
343–347. Apple Academic Press.
Dancelli, L. et al. (2013). On two classes of weighted rank
correlation measures deriving from the spearman’s ρ.
In Stat. Models for Data Analysis, pages 107–114.
Springer.
Dezert, J. et al. (2020). The spotis rank reversal free method
for multi-criteria decision-making support. In 2020
IEEE 23rd International Conference on Information
Fusion (FUSION), pages 1–8. IEEE.
Kizielewicz, B. et al. (2020). Identification of relevant cri-
teria set in the MCDA process—Wind farm location
case study. Energies, 13(24):6548.
Kizielewicz, B. et al. (2021). A new approach to eliminate
rank reversal in the mcda problems. In ICCS proceed-
ings, pages 338–351. Springer.
Kizielewicz, B. et al. (2023). pymcdm—the universal li-
brary for solving multi-criteria decision-making prob-
lems. SoftwareX, 22:101368.
Kizielewicz, B. et al. (2024). SITW method: a new ap-
proach to re-identifying multi-criteria weights in com-
plex decision analysis. Spectrum of Mechanical Engi-
neering and Operational Research, 1(1):215–226.
Moslem, S. (2023). A novel parsimonious best worst
method for evaluating travel mode choice. IEEE Ac-
cess, 11:16768–16773.
Nath, B. et al. (2023). Agricultural waste-based heteroge-
neous catalyst for the production of biodiesel: A rank-
ing study via the vikor method. Int. J. of Energy Res.,
2023(1):7208754.
Romero-Ramos, J. et al. (2023). A GIS-AHP approach for
determining the potential of solar energy to meet the
thermal demand in southeastern Spain productive en-
claves. Renewable and Sustainable Energy Reviews,
176:113205.
Saraji, M. K. et al. (2023). Assessment of the challenges
to renewable energy technologies adoption in rural ar-
eas: A Fermatean CRITIC-VIKOR approach. Techn.
Forecasting and Soc. Change, 189:122399.
Shekhovtsov, A. (2023). Evaluating the performance
of subjective weighting methods for multi-criteria
decision-making using a novel weights similarity co-
efficient. Proc. Comp. Sci., 225:4785–4794.
Shekhovtsov, A. et al. (2023). Advancing individual
decision-making: An extension of the characteristic
objects method using expected solution point. Infor-
mation Sciences, 647:119456.
Wi˛eckowski, J. et al. (2023). RANCOM: A novel approach
to identifying criteria relevance based on inaccuracy
expert judgments. Engineering Applications of Artifi-
cial Intelligence, 122:106114.
Wi˛eckowski, J. et al. (2024). Adaptive multi-criteria deci-
sion making for electric vehicles: a hybrid approach
based on RANCOM and ESP-SPOTIS. Art. Int. Rev.,
57(10):270.
Towards Enhanced Decision Making: Integrating Weighted Expected Solution Points in Multi-Criteria Analysis
279
