
Evaluating ResNet-Based Self-Explanatory Models for Breast Lesion
Classification
Ad
´
el Bajcsi
a
, Camelia Chira
b
and Annam
´
aria Szenkovits
c
Babes
,
–Bolyai University, Cluj-Napoca, Cluj, Romania
Keywords:
Breast Lesion Classification, ResNet-50, Self-Explanatory Models, Mammogram Analysis.
Abstract:
Breast cancer is one of the leading causes of mortality among women diagnosed with cancer. In recent years,
numerous computer-aided diagnosis (CAD) systems have been proposed for the classification of breast le-
sions. This study investigates self-explanatory deep learning models, namely BagNet and ProtoPNet, for the
classification of breast abnormalities. Our aim is to train models to distinguish between benign and malignant
lesions in breast tissue using publicly available datasets, namely MIAS and DDSM. The study provides a com-
prehensive numerical comparison of the two self-explanatory models and their respective backbones, as well
as a visual evaluation of model performance. The results indicate that, while the backbone (black-box model)
exhibits slightly better performance, it does so at the expense of interpretability. Conversely, BagNet, despite
being a simpler model, achieves results comparable to those of ProtoPNet. In addition, transfer learning and
data augmentation techniques are employed to enhance the performance of the CAD system.
1 INTRODUCTION
Breast cancer is one of the leading causes of death
among women suffering from cancer. According to
statistics of the (World Health Organization, 2024),
breast cancer accounted for 2.3 million new cases and
666 000 deaths, making up 23.8% of all cancer diag-
noses and 15.4% of cancer-related deaths worldwide.
Early stage cancer can be effectively treated with
radiation therapy, chemotherapy, or surgery. Hence,
in recent years, there have been numerous propos-
als for computer-aided diagnosis and detection sys-
tems (CAD) with the aim of helping the work of ra-
diologists. Mammography is a frequently used, non-
invasive method for breast cancer screening by doc-
tors and scientists.
Both classical machine learning methods and
modern deep learning techniques have been shown
to provide promising results in medical imaging-
based classification of breast lesions. Classical ma-
chine learning methods are easier to train, whereas
deep learning models often achieve higher accuracy.
Conversely, traditional machine learning algorithms
are typically self-explanatory, whereas deep learn-
ing models lack interpretability, which is crucial for
a
https://orcid.org/0009-0007-9620-8584
b
https://orcid.org/0000-0002-1949-1298
c
https://orcid.org/0009-0001-8579-6962
breast lesion classification. The challenges of auto-
mated medical imaging-based breast cancer diagno-
sis arise from (1) the lack of training samples, (2) the
large variety of lesions in term of shape, size and ap-
pearance, and (3) the imbalance of class samples.
In general, training a deep neural network model
involves a substantial amount of data due to the large
number of parameters that must be optimized during
the training process. Deep learning models often con-
tain millions of parameters, and insufficient training
samples with limited variance can lead to improper
parameter optimization, resulting in overfitting. Med-
ical datasets usually contain a few thousand records
(at most) due to the limited number of subjects and
data privacy concerns. Consequently, data augmenta-
tion has emerged as a crucial technique to artificially
expand the size and variance of these datasets. By
applying carefully selected transformations, data aug-
mentation can increase the diversity and quantity of
training samples without altering the essential char-
acteristics of the data, thus improving the robustness
and generalizability of the model.
There are critical fields where models are not al-
lowed to make mistakes, including healthcare. There-
fore, the interpretability and self-explainability of ma-
chine learning models are crucial for building trust
and facilitating clinical adoption. Medical profession-
als need to understand how and why a model makes
288
Bajcsi, A., Chira, C. and Szenkovits, A.
Evaluating ResNet-Based Self-Explanatory Models for Breast Lesion Classification.
DOI: 10.5220/0013121900003890
In Proceedings of the 17th International Conference on Agents and Artificial Intelligence (ICAART 2025) - Volume 3, pages 288-295
ISBN: 978-989-758-737-5; ISSN: 2184-433X
Copyright © 2025 by Paper published under CC license (CC BY-NC-ND 4.0)

specific predictions to confidently integrate these
tools into their decision-making processes. Clear ex-
planations allow clinicians to verify and validate the
results. Deep learning models are also known as
black-box models. Hence, explainable deep learning
models are being more and more researched.
In the current study, we investigate two explain-
able models, namely ProtoPNet (Chen et al., 2018)
and BagNet (Brendel and Bethge, 2019). ProtoPNet
is one of the first prototype-based, self-explanatory
models introduced. On the other hand, BagNet con-
verts ResNet-50 into an explainable model by incor-
porating the concept of bag-of-local features. De-
spite its simplicity, BagNet achieves high perfor-
mance (Hesse et al., 2023). We aim to train mod-
els capable of distinguishing benign and malignant le-
sions in breast tissue using publicly available data sets
of MIAS (Suckling et al., 1994) and DDSM (Heath
et al., 1998; Heath et al., 2001). For easier compa-
rability, we choose to build both ProtoPNet and Bag-
Net on top of a ResNet-50 (He et al., 2015) black-
box model. The study contains a comprehensive
numerical comparison of the two explainable mod-
els and their backbone, as well as a visual evalua-
tion of the performance of the model. The results
show that BagNet has slightly better performance
(93.25% on MIAS and 95.25% on DDSM) com-
pared to ProtoPNet (78.11% on MIAS and 91.23%
on DDSM). However, in terms of explainability,
ProtoPNet can give more details on its predictions.
The rest of the paper is structured as follows:
Section 2 offers an overview of state-of-the-art deep
learning models for breast tumor classification. In
Section 3 the proposed models are detailed. Next,
Section 4 presents the data and setup used followed
by a numerical and visual evaluation of the models.
Finally, in Section 5 we state the conclusions and de-
fine future directions.
2 RELATED WORK
Early detection of tumors is essential to decrease
the mortality caused by the specific type of cancer.
In the literature, numerous machine learning-based
CAD systems have been proposed for the classifi-
cation of breast lesions. The current work focuses
on distinguishing abnormalities extracted from digital
mammograms. In the following paragraphs, key stud-
ies will be highlighted from the field of breast cancer
classification with emphasis on interpretable models.
Supervised image classification by machine learn-
ing can be divided into two main subcategories:
(1) traditional machine learning (ML) and (2) deep
learning (DL). (Houssein et al., 2021; Hassan et al.,
2022) provide a comprehensive reviews of breast can-
cer classification using various approaches. (Hassan
et al., 2022) includes a study proposing the use of
the discrete wavelet transform to extract features from
images and classified using support vector machines
(SVM). The proposed approach achieved 88.75%
sensitivity on 75 mammograms from MIAS (Suck-
ling et al., 1994). Another approach included in (Has-
san et al., 2022) ((Suhail et al., 2018)) combined scal-
able Linear Discriminant Analysis (LDA) algorithms
to extract the features and reduce the dimensional-
ity, using five different classifiers, including SVM,
Decision Tree (DT) and k-Nearest Neighbors (kNN).
From the listed classification methods, DT achieved
the best performance with 97.5% accuracy (SVM –
96%, kNN – 97.2%). In (Bajcsi and Chira, 2023) the
classification performance of the features extracted
from the Gray-Level Run-Length Matrices (GLRLM)
is compared to the features extracted from the shape
of the lesion. Using tree-based classifiers, (Bajcsi
and Chira, 2023) concluded that shape features out-
perform texture features. (Bajcsi et al., 2024) pro-
posed the combination of the extracted contour fea-
tures and achieved 96.12% accuracy using the random
forest (RF) classification algorithm on images from
DDSM (Heath et al., 1998; Heath et al., 2001).
The advantage of a deep learning-based CAD
system is that it can learn more complex patterns.
Among the works reviewed in (Hassan et al., 2022),
we highlight (Ansar et al., 2020) proposing a mod-
ified MobileNet that achieves an accuracy of 86.8%
on DDSM (Heath et al., 1998; Heath et al., 2001) and
74.5% on CBIS-DDSM (Sawyer-Lee et al., 2016).
ResNet-50 and Inception-V2 achieved 95.8% and
97.5%, respectively, on DDSM (Heath et al., 1998;
Heath et al., 2001) as presented in (Houssein et al.,
2021).
(Ragab et al., 2021) proposed the combination
of deep learning and traditional machine learning.
Deep learning like AlexNet, GoogLeNet, ResNet-18,
ResNet-50, and ResNet-101 is used as input for SVM
classifiers. The performance achieved is compara-
ble to other approaches, reaching 97.4% accuracy on
MIAS (Suckling et al., 1994).
Compared to traditional machine learning, deep
learning models have more hyperparameters and need
a great amount of data for training. However, sev-
eral studies (Alruwaili and Gouda, 2022; Alkhaleefah
et al., 2020; Ragab et al., 2021; Ansar et al., 2020)
showed that transfer learning can improve the learn-
ing process of deep learning models. (Alruwaili
and Gouda, 2022) compared the performance of
ResNet-50 and NASNet using transfer learning on
MIAS (Suckling et al., 1994) and reported 89.5% and
Evaluating ResNet-Based Self-Explanatory Models for Breast Lesion Classification
289

70%, respectively. In (Houssein et al., 2021) a novel
deep convolutional neural network is proposed. The
model is first trained on ImageNet (Deng et al., 2009),
then fine-tuned on DDSM (Heath et al., 1998; Heath
et al., 2001) achieving 89.9% sensitivity.
(Alkhaleefah et al., 2020) proposed the combina-
tion of transfer learning and data augmentation, in or-
der to increase the performance of breast lesion clas-
sification models. (Alkhaleefah et al., 2020) reported
a 20% increase in the test accuracy. In (Alkhaleefah
et al., 2020), a VGG-19 model is fine-tuned on CBIS-
DDSM (Sawyer-Lee et al., 2016) with 73.54% and
90.38%, with and without augmentation, respectively.
The augmentations used were carefully selected to
enhance the diversity of the training data while pre-
serving the critical diagnostic features of the mam-
mograms, ensuring that the integrity of the images re-
mained intact. (Alkhaleefah et al., 2020) proposed the
use of rotation, flipping, zooming, adjusting contrast,
and brightness.
The interpretability and explainability of deep
learning models in medical image classification are
crucial to gain clinical trust, as they allow healthcare
professionals to understand, verify, and validate the
model’s decisions, ensuring the safety and reliability
of the diagnostic process. There are a limited num-
ber of proposals (Moroz-Dubenco et al., NA; Carloni
et al., 2023; Balve and Hendrix, 2024) toward inter-
pretable mammogram classification systems. Hence,
our interest is to compare the performance of inter-
pretable models for the classification of lesions. Mo-
roz et al. (Moroz-Dubenco et al., NA) proposed a
classical ML system achieving 95% test accuracy on
a subset of the MIAS database (Suckling et al., 1994).
(Carloni et al., 2023) investigate the applicability of
ProtoPNet (Chen et al., 2018) self-explanatory model
on CBIS-DDSM (Sawyer-Lee et al., 2016) and report
68.5% test accuracy. (Balve and Hendrix, 2024) pro-
posed the application of post hoc techniques to gen-
erate heatmaps for the prediction of a CNN model.
The authors included Grad-CAM, LIME, and Ker-
nel SHAP methods. The best performance was 77%
accuracy on MIAS (Suckling et al., 1994). (Balve
and Hendrix, 2024) concluded that the Grad-CAM
method outperformed the other methods in terms of
time and explanation.
Based on a survey by (Rudin et al., 2022), ex-
plainable deep learning modes can be categorized as
(1) post hoc and (2) self-explanatory models. Post
hoc interpretability consists of algorithms that aim
to generate an explanation for the prediction of an
already trained model. These methods do not al-
ter the model, but provide information on how the
model makes decisions. On the other hand, the design
of self-explanatory models is inherently interpretable.
These models have built-in structures or mechanisms
that allow them to provide explanations for their pre-
dictions. In this paper, we focus on self-explanatory
models. BagNet and ProtoPNet generate explana-
tions for their decision-making during training, as ex-
plained in (Rudin et al., 2022).
Based on previous research, in the present study,
explainable deep learning models are investigated for
the classification of breast lesion. Furthermore, trans-
fer learning and data augmentation is applied to in-
crease the performance of the CAD system.
3 PROPOSED APPROACH
The purpose of the current study is to distinguish be-
nign and malignant lesions on mammograms using
self-explanatory deep convolutional networks. The
system starts with a preprocessing, followed by the
decision-making model. In the next paragraphs, the
aforementioned steps are detailed.
3.1 Preprocessing
Mammography is a commonly used method for the
screening for breast cancer by doctors and machine
learning methods as well. As a first step, the pro-
posed system crops the lesions from the image using
a bounding box. The bounding box is defined using
a predefined segmentation mask of the lesion and is
selected to be 25 pixels higher to enclose some of the
surrounding area of the tumor. Malignant lesions, for
example, have blurred boundaries. Hence, the tissues
surrounding them can also contain useful information.
Breast abnormalities can appear in different
shapes, sizes, and density. Image normalization is ap-
plied on the data to have 0 mean and 1 standard devia-
tion. Normalization improves the convergence speed
and stability of the training process by ensuring that
the input data has a standardized scale, which helps
to mitigate issues related to vanishing and exploding
gradients. In addition, normalization contributes to
a more consistent data distribution, ensuring that all
input features contribute equally to the learning pro-
cess. For normalization, the selected dataset’s mean
and standard deviation is defined and used. Finally, to
overcome the size differences, the images are resized
to 224 × 224.
3.2 Classification
In healthcare, transparency in decision making is es-
sential. Therefore, we sought explainable models
ICAART 2025 - 17th International Conference on Agents and Artificial Intelligence
290

and selected two models based on ResNet-50 (Bag-
Net (Brendel and Bethge, 2019) and ProtoPNet (Chen
et al., 2018)) due to their promising results achieved
in other fields (Galiger and Bod
´
o, 2023; Hesse et al.,
2023; Carloni et al., 2023).
ResNet-50 (He et al., 2015) is a widely used
model for image classification. It overcomes the prob-
lem of vanishing gradients by introducing skip con-
nections to bypass a given number of layers, allow-
ing the gradient to flow directly through the network.
To train the ResNet-50 model, we introduce four con-
volutions (add-on layers) before the final classifica-
tion with batch normalization and dropout between,
as proposed in (Chen et al., 2019). In the following
subsections, we present the two explainable models.
3.2.1 BagNet
BagNet, proposed in (Brendel and Bethge, 2019), ap-
plies the bag-of-features concept to neural networks
for image classification. The model classifies an im-
age based on the occurrences of small local image fea-
tures (defined by a receptive field) without taking into
account their spatial ordering. BagNet modifies the
ResNet-50 model as follows: (1) the initial 7 × 7 con-
volution is replaced by a 3×3 convolution, and (2) the
number of 3 × 3 convolutions is decreased by leaving
only the first bottleneck block of a residual block 3×3
convolution, and the rest is decreased to 1 × 1 convo-
lutions.
(Brendel and Bethge, 2019) introduced three mod-
els named BagNet-q, where q ∈ {9, 17, 33} represents
the size of the receptive field. With a larger receptive
field, the number of 3 ×3 convolutions increases. For
every receptive field q the number of residual blocks
starting with 3× 3 convolution is 2, 3, 4, respectively,
for every value q.
The model is able to explain its decision by
generating detailed activation heatmaps, which visu-
ally highlight the individual pixels within the image
that most strongly influenced the model’s predictions.
These heatmaps provide an intuitive and granular un-
derstanding of the decision-making process, allowing
users to see exactly which regions of the image the
model focused on.
3.2.2 ProtoPNet
Prototypical Part Network (i.e. ProtoPNet) was in-
troduced by (Chen et al., 2018). ProtoPNet aims to
bridge the gap between high-performance neural net-
works and the need for transparency. ProtoPNet oper-
ates by learning a set of prototypes that represent typ-
ical patterns or features seen in the training data. Dur-
ing classification, the model compares parts of the in-
put image with these learned prototypes to determine
the final prediction. This process allows the model
to highlight specific regions of the mammogram that
are similar to the learned prototypes, providing a vi-
sual explanation of why a particular classification was
made. In the proposed approach, ResNet-50 is used to
extract features from the input followed by the proto-
type layer, four convolution layers with batch normal-
ization and dropout (Chen et al., 2019), and finally the
classification layer.
4 EXPERIMENTAL RESULTS
In the present research, we performed experiments to
compare two explainable deep learning models (Bag-
Net (Brendel and Bethge, 2019) and ProtoPNet (Chen
et al., 2018)) for the classification of breast abnor-
malities
1
. In the following subsections, we detail the
datasets used and the setup of our experiments. We
include a numerical and visual evaluation of the per-
formance, and compare to other, state-of-the-art ap-
proaches.
4.1 Datasets
In the experiments, two publicly available datasets are
utilized to evaluate the models’ performance. Both
datasets contain masks for the lesions, used to crop
the region of interest. Detailed descriptions of these
datasets are provided in the following.
4.1.1 MIAS
MIAS (Suckling et al., 1994) (Mammographic Im-
age Analysis Society) is a small and frequently used
dataset to train machine learning models on mam-
mograms. MIAS contains 322 mammographies from
161 patients. Each patient has two images, one from
each breast from the lateral view. From the total num-
ber of images, there are 115 breast tissues with abnor-
malities (62 benign, 51 malignant), 7 of them contain-
ing more than one lesion, with a total of 123 lesions.
Due to their proximity to the margin, we excluded 10
tumors, leaving us with a total of 113 lesion images.
4.1.2 DDSM
DDSM (Heath et al., 1998; Heath et al., 2001) (Digi-
tal Database for Screening Mammography) is another
1
The source code is available at: https:
//github.com/bajcsiadel/XAI-Mammogram-Classification/
tree/ICAART-2025
Evaluating ResNet-Based Self-Explanatory Models for Breast Lesion Classification
291

dataset that is used frequently. It is a public collec-
tion with images from 1952 patients. The screening
method resulted in four images: two images of each
(left and right) breast from two perspectives (lateral
and top). Of the total of 7808 mammograms, 4978
are classified as normal and 1402 as benign, and 1428
as malignant.
4.2 Data Augmentation and Transfer
Learning
As mentioned in the previous section, the size of the
dataset is very limited. In general, deep neural net-
works need large amount and diverse data to learn;
otherwise, they are prone to overfitting. To overcome
this issue, we use data augmentation (Alkhaleefah
et al., 2020). Several affine transformations are used
to increase the size of the dataset. Similarly to (Car-
loni et al., 2023), we employ (1) rotation [−10
◦
, 10
◦
],
(2) shear [−10
◦
, 10
◦
], (3) perspective change (skew)
0.2, (4) horizontal and (5) vertical flip. Because the
patches containing the tumor are extracted from the
images, we can also apply flip operations on the im-
ages. Each transformation is applied ten times. In ad-
dition, a Gaussian noise is added to the resulting im-
age with probability 0.15. This transformation mim-
ics the noise from the mammography machine. As a
result, the training data have increased 33 times (in-
cluding the original image). To facilitate convergence
and stability of the training process, every image is
normalized as mentioned in Section 3.1. The abnor-
malities can differ in size. Therefore, the images are
resized to 224 × 224.
As mentioned in Section 1, optimizing the model
parameters with random initialization is time- and
data-consuming. To overcome the issue, transfer
learning (Alruwaili and Gouda, 2022) is applied.
Transfer learning is a machine learning technique in
which a model pre-trained on a large dataset is fine-
tuned on a smaller, task-specific dataset. This ap-
proach leverages the knowledge acquired from ini-
tial training, often in a general domain such as Im-
ageNet (Deng et al., 2009), to improve performance
and accelerate training on the new task. In medical
imaging, transfer learning is particularly valuable as
it allows models to achieve high accuracy with lim-
ited labeled data, which is often a constraint in this
field.
The models used are initialized with the weights
of a model trained on ImageNet (Deng et al., 2009).
However, ImageNet contains RGB (3-channel) im-
ages, and mammograms are grayscale (1-channel) im-
ages. In order to use such images as input, we slightly
modify the weights of the first convolutional layer by
summarizing the existing weights along the dimen-
sion of the channels.
4.3 Experimental Setup
The data used are divided into two sets without over-
lap, in 80% (train) - 20% (test) ration. To train the
model, 5-fold cross-validation is used. This technique
provides a more reliable estimate of how the model
will perform on unseen data.
Medical datasets usually have an uneven distri-
bution of classes. This could lead to biased predic-
tions. This can result in a model that performs well
on the majority class but poorly on the minority class,
which is especially problematic in medical applica-
tions where accurate classification of rare conditions
is critical. To address this problem, under-sampling is
applied on the majority class in each fold.
In the following paragraphs, we detail the hyper-
parameters used for every model. To train the ResNet-
50, cross-entropy (CrossEnt) loss and L
1
regulariza-
tion is used with the Adam optimizer. Separate learn-
ing rates were specified to feature and add-on layer
parameters 0.0001 and 0.003, respectively. In addi-
tion, to reduce training noise, a learning rate sched-
uler is applied that decreases the learning rate after
every 5 epoch by 0.1. The batch size is maximized to
64 and train for 30 epochs.
For the training of BagNet models, we use cross-
entropy (CrossEnt) loss with the SGD optimizer. The
learning rate scheduler is applied, starting from 0.003
and decreasing by 0.8 after every 25 epoch. The batch
size is set to 64, and trained for 50 epochs.
ProtoPNet being a slightly more complicated
model, its loss function consists of three components:
(1) cross-entropy, (2) clustering term with λ
1
weight –
ensuring that an image of a class in the latent (feature)
space is close to at least one patch of the same class
– and (3) separation term with λ
2
weight – pushing
the prototypes of different classes apart as presented
in (Chen et al., 2018). To regularize training, we also
add L
1
regularization with λ
3
weight. If a prototype
is not the closest to any of the feature patches in its
class, the cluster term will no longer have an impact
on it. These prototypes will spread out and will be-
come meaningless, yet promote the optimization of
the separation cost. To solve this problem, we added
L
2
regularization with λ
4
weight, penalizing the high
norm of the computed prototypes. Based on prelim-
inary experiments, the weights λ
1
, λ
2
, λ
3
, and λ
4
in
the loss term are set to 0.8, −0.08, 0.0001, and 0.01,
respectively.
The training of ProtoPNet consists of three
phases: (1) warm-up when the feature layer is
ICAART 2025 - 17th International Conference on Agents and Artificial Intelligence
292
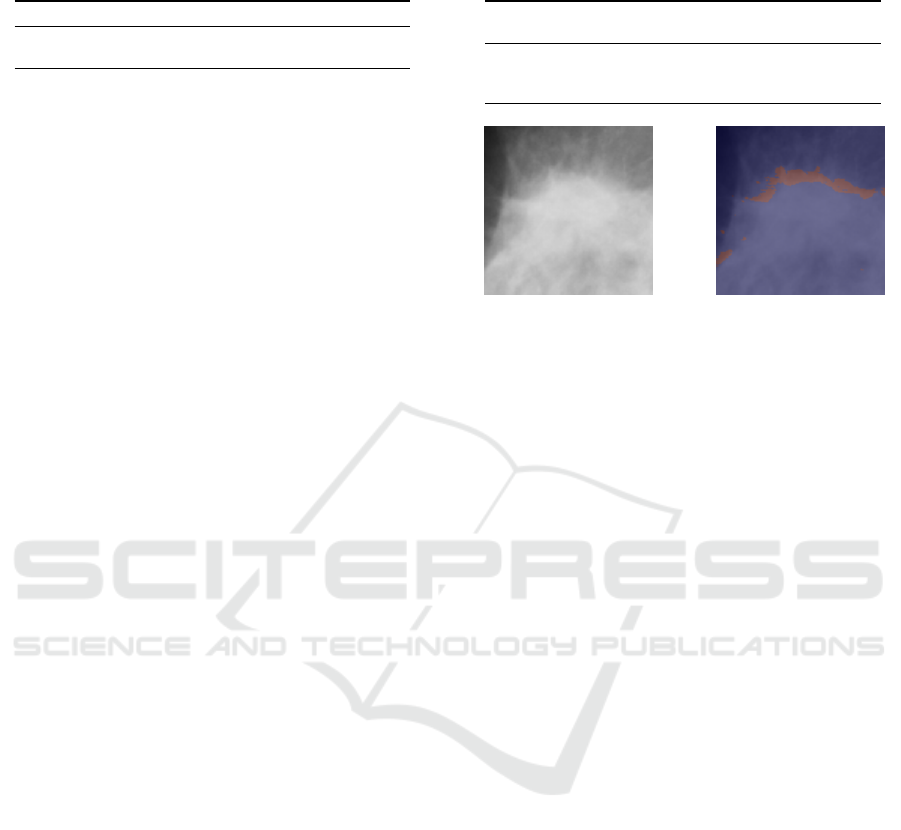
Table 1: Test performance (accuracy) of BagNet models us-
ing different receptive field.
MIAS DDSM
BagNet-9 0.8906 ± 0.0215 0.8781 ± 0.0223
BagNet-17 0.9325 ± 0.0258 0.9525 ± 0.0110
not trained (only the add-on, and prototype layers),
(2) joint when the feature layer is also fine-tuned,
and (3) fine-tune when only the classification layer
is trained. Warm-up consists of 10 epochs with 256
batch size and a learning rate of 0.003 to optimize
the parameters of the add-on layers and the prototype
layer. The next phase (joint) is trained for 120 and
40 epochs, respectively on MIAS and DDSM, with
64 batch size (due to the increased number of pa-
rameters), the learning rate of feature, prototype and
add-on layers parameters is set to 0.0001, 0.003 and
0.003, respectively. Moreover, learning rate scheduler
is added with a step size of 30 and a degree of 0.1. The
last layer (classification) is trained for 20 epochs, us-
ing a batch size of 256 and a learning rate of 0.0001.
All phases utilize Adam optimizer.
4.4 Results
In our experiments, three models were trained to dis-
tinguish benign and malignant lesion: (1) ResNet-50,
(2) BagNet and (3) ProtoPNet. First, we compare
their numerical performance, followed by a visual
evaluation of the interpretable models.
4.4.1 Numerical Results
As mentioned previously, 5-fold cross-validation was
used during the training process. In the following,
the mean and standard deviation of the resulting test
accuracies will be presented.
ResNet-50 has proved to be a capable image clas-
sification model for general purposes. In the present
experiments, the pre-trained model was fine-tuned to
distinguish benign and malignant lesions. The test
results on the MIAS and DDSM datasets show how
the model can learn abnormalities of the breast tissue,
achieving test accuracies 93.34% and 95.26%, re-
spectively, for the datasets mentioned. In contrast, for
high performance, the decision-making of ResNet-50
is not straightforward.
As mentioned in Section 3.2.1, BagNet has more
versions based on the receptive field. In the current
experiments, BagNet with receptive fields of 9 and
17 are used due to the small size of the lesions. The
results achieved by the BagNet models are presented
in Table 1. On both datasets, BagNet-17 outperforms
BagNet-9 by 4% and 8%, respectively, on MIAS and
DDSM.
Table 2: Test performance (accuracy) of ProtoPNet models
with different number of prototypes per class trained.
protopypes
per class
MIAS DDSM
2 0.7182 ± 0.0725 0.9178 ± 0.0536
5 0.7811 ± 0.0614 0.9123 ± 0.0528
10 0.8168 ± 0.0422 0.8954 ± 0.0491
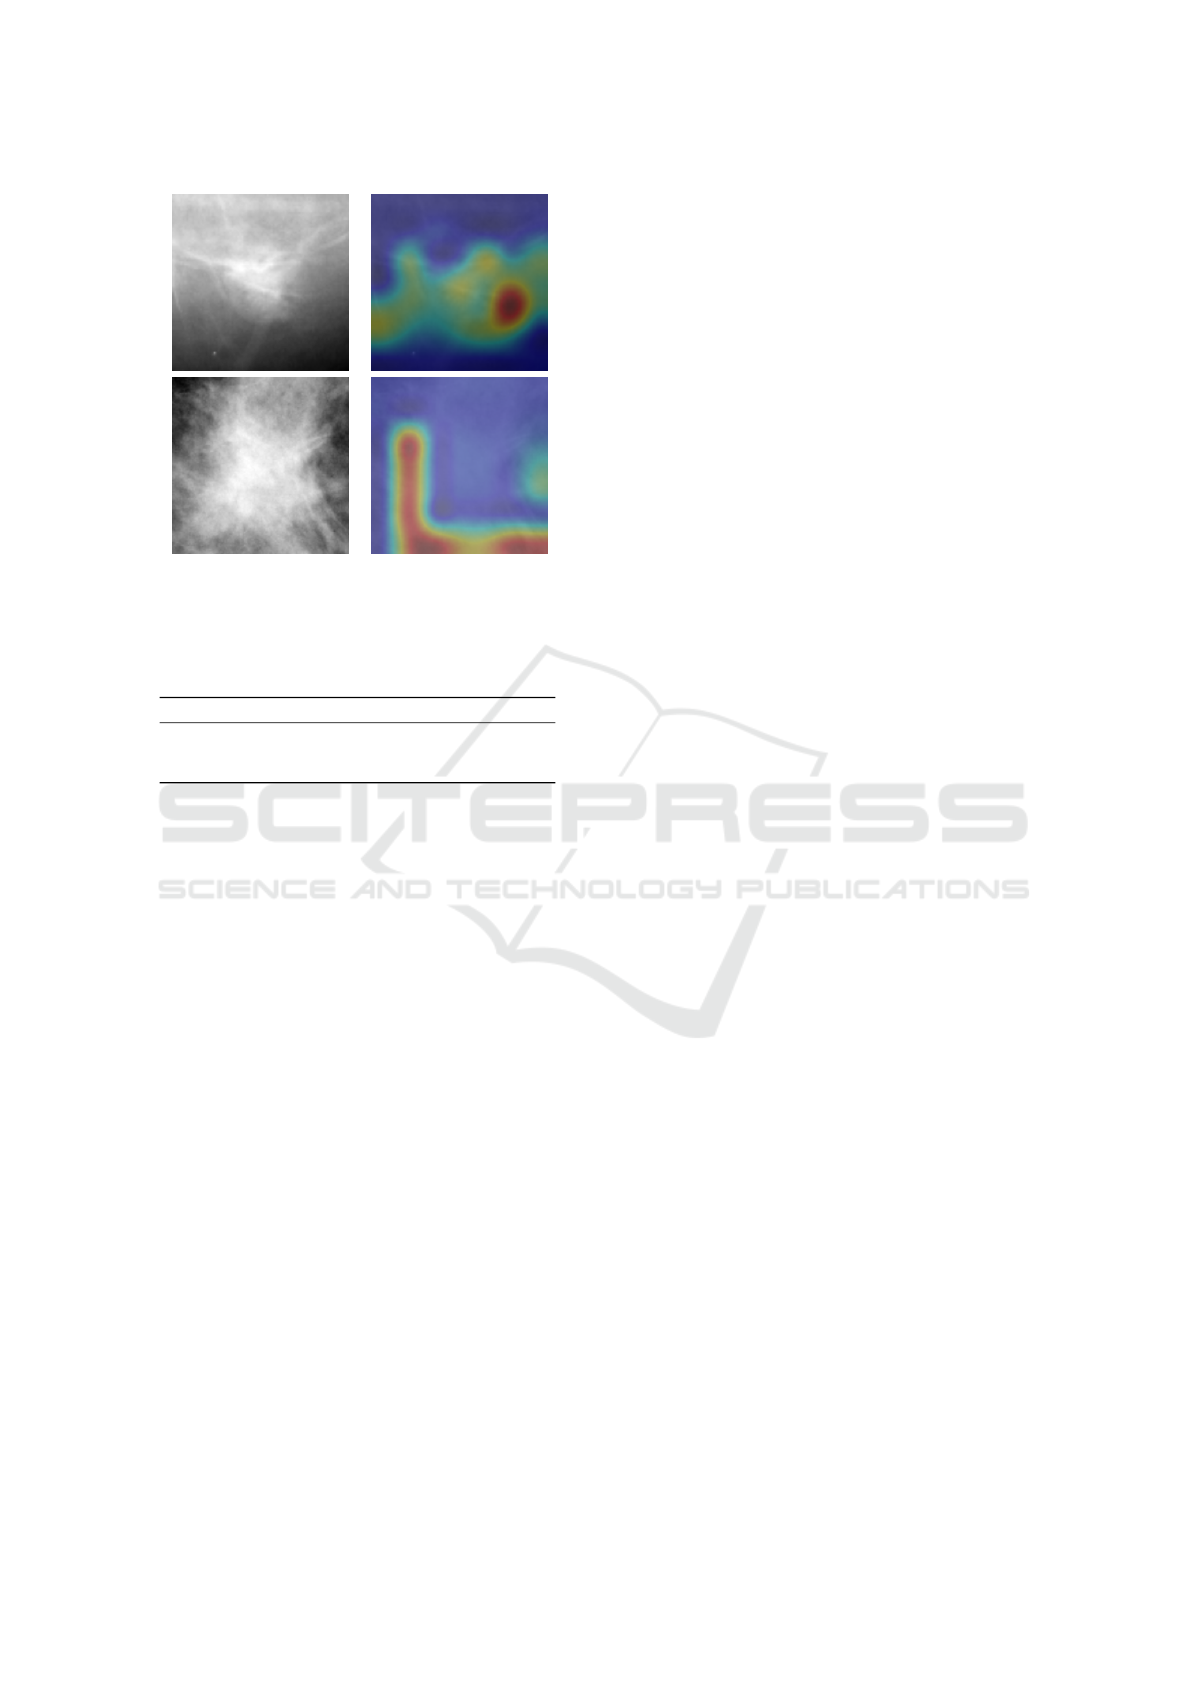
(a) Original images. (b) Heatmap.
Figure 1: Heatmaps generated by BagNet-17 for correctly
classified malignant lesions from MIAS.
In case of ProtoPNet the number of learned pro-
totypes can be adjusted based on the used images. In
the experiments conducted, we investigated how the
number of prototypes affects the classification perfor-
mance. Based on the results shown in Table 2, we can
conclude that with an increase in the number of proto-
types, the test accuracy increases on a smaller variety
dataset (MIAS); however, the accuracy decreases on
a higher variety dataset (DDSM). On the other hand,
for small variety datasets, the same characteristic is
learned multiple times. Therefore, in the following,
we report the results using 5 prototypes per class.
4.4.2 Visual Results
Both BagNet and ProtoPNet can generate explana-
tions for their predictions. The main difference is that
BagNet generates a single heatmap, while ProtoPNet
can present the activation of every learned prototype
on a given image. Fig. 1 shows a BagNet-17 gen-
erated heatmap for a correctly classified malignant
image. Malignant lesions have obscure boundaries;
therefore, it is reasonable for the model to focus on
the margin of the abnormality.
On the other hand, the training process of the
ProtoPNet involves the optimization of several pro-
totypes per class. The advantage of these prototypes
is that the model can learn different aspects of the
classes. However, in the case of mammogram clas-
sification, this can also be a drawback due to the lack
of data and the small variety of the images. Fig. 2
shows the activations generated by ProtoPNet. No-
tably, ProtoPNet also has prototypes of the malignant
class that focus on the edge of the tumor.
Evaluating ResNet-Based Self-Explanatory Models for Breast Lesion Classification
293
(a) Original images. (b) Prototype activation.
Figure 2: Most active prototype for classifying images as
benign and malignant, respectively, using ProtoPNet.
Table 3: Test performance (accuracy) of the trained models
in the experiment.
Network MIAS DDSM
ResNet-50 0.9338 ± 0.0059 0.9526 ± 0.0018
BagNet 0.9325 ± 0.0258 0.9525 ± 0.0110
ProtoPNet 0.7811 ± 0.0614 0.9123 ± 0.0528
4.5 Discussions
In the experiments carried out, self-explanatory mod-
els were trained to distinguish abnormalities in breast
tissue. We investigated the applicability of two such
models, namely ProtoPNet and BagNet, both of them
using or based on ResNet-50 architecture. Table 3
summarizes the results previously presented.
The uninterpretable ResNet-50 had better per-
formance in terms of accuracy than the two self-
explanatory models, which had lower accuracy with
approximately 1% (BagNet) and 15% (ProtoPNet).
However, the reduced accuracy can be mitigated by
the visual explanations offered by the models. This
can be especially important for detecting error of bias
in the models used.
Between the two explainable models, BagNet
outperforms ProtoPNet in terms of performance on
MIAS and DDSM. (Hesse et al., 2023) reported sim-
ilar results when comparing the performance of Bag-
Net and ProtoPNet. On the other hand, BagNet can
provide a single explanation for its prediction, while
ProtoPNet provides activation of several prototypes.
There is a trade-off between interpretability and per-
formance. In terms of complexity, BagNet is sim-
pler (has fewer parameters compared to ProtoPNet)
and therefore easier to train. Due to the lack of data,
this could be a major concern. Furthermore, the re-
sults of ProtoPNet exhibit greater fluctuation com-
pared to those of BagNet, which can be attributed to
the increased difficulty in optimizing its parameters.
This variability highlights the challenge of achieving
consistent performance with more complex models in
data-limited scenarios.
(Carloni et al., 2023) applied ProtoPNet on CBIS-
DDSM (Sawyer-Lee et al., 2016) and reported the
test accuracy of 68.5%. Compared to (Carloni et al.,
2023), we introduced minor noise changes in the aug-
mentation. However, the effect of the change in the
augmentation must be further investigated on CBIS-
DDMS for a better comparison.
Compared to the results of (Balve and Hendrix,
2024) both BagNet and ProtoPnet show better perfor-
mance, with improvements of 15% and 1%, respec-
tively, when trained on MIAS dataset. The difference
in results can be attributed to the complexity of the
models used. While (Balve and Hendrix, 2024) em-
ployed a simple CNN model, we used ResNet-50 as
a base model for BagNet and ProtoPNet. Addition-
ally, BagNet and ProtoPNet are inherently explain-
able, whereas the post-hoc methods used by (Balve
and Hendrix, 2024) only attempt to generate explana-
tions for the model’s decisions.
Table 3 shows that indifferent from the model, the
test results are better on DDSM than on MIAS. This
can be explained by the size of the dataset and the
increased variety of the data.
5 CONCLUSIONS AND FUTURE
WORK
In the current study, the performance of two
ResNet-50-based self-explanatory models (BagNet
and ProtoPNet) is compared for the classification of
breast lesions. Digital mammogram datasets are lim-
ited in size and image variety. To overcome this issue,
transfer learning and image augmentation is applied.
Our results show that BagNet outperforms ProtoPNet
by achieving test accuracy of 93.25% and 95.25% on
MIAS and DDSM, respectively, while ProtoPNet re-
mains at 78.11% on MIAS and 91.23% on DDSM.
As presented, the backbone achieves higher accuracy
at the expense of explainability. Interpretability is an
essential characteristic for models used in healthcare;
hence, there is a critical need to balance accuracy with
interpretability to ensure that clinical decisions are
transparent and justifiable.
In future work, we will investigate other self-
explanatory models, such as PIP-Net (Nauta et al.,
2023). We will compare the performance of self-
explanatory models with post hoc approaches applied
ICAART 2025 - 17th International Conference on Agents and Artificial Intelligence
294

on ResNet-50, evaluating both numerically and visu-
ally. In general, self-explanatory models are built on
top of a black-box model, such as ResNet-50 in this
paper. In future experiments, we will investigate the
impact of the backbone on breast tumor classification.
Moreover, to assess the system’s interpretability, we
will conduct user studies with domain experts.
REFERENCES
Alkhaleefah, M., Kumar Chittem, P., Achhannagari, V. P.,
Ma, S.-C., and Chang, Y.-L. (2020). The influence
of image augmentation on breast lesion classification
using transfer learning. In 2020 International Confer-
ence on Artificial Intelligence and Signal Processing
(AISP), pages 1–5.
Alruwaili, M. and Gouda, W. (2022). Automated breast
cancer detection models based on transfer learning.
Sensors, 22(3).
Ansar, W., Shahid, A. R., Raza, B., and Dar, A. H. (2020).
Breast Cancer Detection and Localization Using Mo-
bileNet Based Transfer Learning for Mammograms,
page 11–21. Springer International Publishing.
Bajcsi, A., Andreica, A., and Chira, C. (2024). Signif-
icance of training images and feature extraction in
lesion classification. In Proceedings of the 16th In-
ternational Conference on Agents and Artificial In-
telligence - Volume 3: ICAART, pages 117–124. IN-
STICC, SciTePress.
Bajcsi, A. and Chira, C. (2023). Textural and shape features
for lesion classification in mammogram analysis. In
Hybrid Artificial Intelligent Systems, pages 755–767.
Springer Nature Switzerland.
Balve, A.-K. and Hendrix, P. (2024). Interpretable breast
cancer classification using CNNs on mammographic
images. .
Brendel, W. and Bethge, M. (2019). Approximating CNNs
with bag-of-local-features models works surprisingly
well on imagenet. arXiv.
Carloni, G., Berti, A., Iacconi, C., Pascali, M. A., and
Colantonio, S. (2023). On the Applicability of Pro-
totypical Part Learning in Medical Images: Breast
Masses Classification Using ProtoPNet, pages 539–
557. Springer Nature Switzerland, Cham.
Chen, C., Li, O., Tao, D., Barnett, A., Rudin, C., and Su,
J. K. (2018). This looks like that: deep learning for
interpretable image recognition. Advances in neural
information processing systems, 32.
Chen, G., Chen, P., Shi, Y., Hsieh, C.-Y., Liao, B., and
Zhang, S. (2019). Rethinking the usage of batch nor-
malization and dropout in the training of deep neural
networks.
Deng, J., Dong, W., Socher, R., Li, L.-J., Li, K., and Fei-
Fei, L. (2009). Imagenet: A large-scale hierarchical
image database. In 2009 IEEE Conference on Com-
puter Vision and Pattern Recognition, pages 248–255.
Galiger, G. and Bod
´
o, Z. (2023). Explainable patch-
level histopathology tissue type detection with bag-
of-local-features models and data augmentation. Acta
Universitatis Sapientiae, Informatica, 15(1):60–80.
Hassan, N. M., Hamad, S., and Mahar, K. (2022). Mammo-
gram breast cancer CAD systems for mass detection
and classification: a review. Multimedia Tools and
Applications, 81(14):20043–20075.
He, K., Zhang, X., Ren, S., and Sun, J. (2015). Deep resid-
ual learning for image recognition. In Proceedings of
the IEEE Conference on Computer Vision and Pattern
Recognition (CVPR), pages 770–778.
Heath, M., Bowyer, K., Kopans, D., Kegelmeyer, P., Moore,
R., Chang, K., and Munishkumaran, S. (1998). Cur-
rent Status of the Digital Database for Screening
Mammography, pages 457–460. Springer Nether-
lands, Dordrecht.
Heath, M., Bowyer, K., Kopans, D., Moore, R., and
Kegelmeyer, P. (2001). The digital database for
screening mammography. In Yaffe, M., editor, Pro-
ceedings of the Fifth International Workshop on Dig-
ital Mammography, pages 212–218. Medical Physics
Publishing.
Hesse, R., Schaub-Meyer, S., and Roth, S. (2023). Fun-
nybirds: A synthetic vision dataset for a part-based
analysis of explainable ai methods. In Proceedings of
the IEEE/CVF International Conference on Computer
Vision (ICCV), pages 3981–3991.
Houssein, E. H., Emam, M. M., Ali, A. A., and Suganthan,
P. N. (2021). Deep and machine learning techniques
for medical imaging-based breast cancer: A compre-
hensive review. Expert Systems with Applications,
167:114161.
Moroz-Dubenco, C., Bajcsi, A., Andreica, A., and Chira, C.
(N/A). Towards an interpretable breast cancer detec-
tion and diagnosis system. Computers in Biology and
Medicine. Accepted.
Nauta, M., Schl
¨
otterer, J., van Keulen, M., and Seifert, C.
(2023). PIP-Net: Patch-based intuitive prototypes for
interpretable image classification. In Proceedings of
the IEEE/CVF Conference on Computer Vision and
Pattern Recognition (CVPR), pages 2744–2753.
Ragab, D. A., Attallah, O., Sharkas, M., Ren, J., and Mar-
shall, S. (2021). A framework for breast cancer clas-
sification using multi-DCNNs. Computers in Biology
and Medicine, 131:104245.
Rudin, C., Chen, C., Chen, Z., Huang, H., Semenova, L.,
and Zhong, C. (2022). Interpretable machine learn-
ing: Fundamental principles and 10 grand challenges.
Statistics Surveys, 16:1–85.
Sawyer-Lee, R., Gimenez, F., Hoogi, A., and Rubin,
D. (2016). Curated breast imaging subset of dig-
ital database for screening mammography (cbis-
ddsm)[skup podataka]. The Cancer Imaging Archive.
Suckling, J., Parker, J., and Dance, D. (1994). The mammo-
graphic image analysis society digital mammogram
database. In International Congress Series, volume
1069, pages 375–378.
Suhail, Z., Denton, E. R. E., and Zwiggelaar, R. (2018).
Classification of micro-calcification in mammograms
using scalable linear fisher discriminant analysis.
Medical & Biological Engineering & Computing,
56(8):1475–1485.
World Health Organization (2024). Cancer Today: Explore
national indices, mortality, and prevalence for 36 can-
cer types in 185 countries. https://gco.iarc.fr/today/en.
Accessed on 16/05/2024.
Evaluating ResNet-Based Self-Explanatory Models for Breast Lesion Classification
295
