
A Method for Standardizing Eye-Tracking and Behavioral Data
in Real and Virtual Environments
Maxime Dumonteil
1 a
, Marc J.-M. Mac
´
e
2 b
, Val
´
erie Gouranton
3 c
, Th
´
eophane Nicolas
4 d
and Ronan Gaugne
1 e
1
Univ. Rennes, Inria, CNRS, IRISA, France
2
CNRS, Univ. Rennes, Inria, IRISA, France
3
Univ. Rennes, INSA Rennes, Inria, CNRS, IRISA, France
4
Inrap, UMR Trajectoires, France
Keywords:
Methodology, Virtual Reality, Eye Tracking, Gaze Behavior, Immersive Room, HMD.
Abstract:
This paper introduces a methodology for generating standardized and comparable eye-tracking and behavioral
data across multiple modalities, in real and virtual environments. Our approach handles data collected using
different devices, thereby enabling a comprehensive comparison between different modalities: a real envi-
ronment, a virtual one using an immersive room setup, and another virtual environment using head-mounted
displays. The versatility of this methodology is illustrated through an archaeological case study, in which the
gaze patterns and behavioral responses of participants are analyzed while they interact with artifacts. How-
ever, this methodology is applicable to broader research areas involving eye tracking and behavior in mixed
environments. By explaining a workflow for the preparation, data acquisition, and post-processing of data,
our approach enables the generation of 3D eye-tracking and behavioral data. Subsequently, our presentation is
accompanied by examples of metrics and visualization that are relevant in such a comparison study, providing
insights into cross-modal behavioral and gaze pattern analysis.
1 INTRODUCTION
The study of the human gaze provides valuable in-
sights into human behavior, and recent advances in
virtual reality (VR) equipment, adding native eye
tracking (ET) capabilities, have opened up new and
exciting possibilities for research using eye-tracking
data. While the majority of current tools and methods
for studying gaze are based on a 2D context, there is
a growing interest in extending these analyses to a 3D
context. This move to 3D allows for a more complete
understanding of user behavior, especially when in-
teracting with virtual environments and objects.
Compared to the same case in a real environment,
object exploration and manipulation could differ in
a virtual context, notably eye and head coordination,
which could be influenced by the differences between
the two environments (Pfeil et al., 2018; Kollenberg
et al., 2010). The field of view (FOV) is affected by
a
https://orcid.org/0009-0004-4267-4289
b
https://orcid.org/0000-0003-4124-8697
c
https://orcid.org/0000-0002-9351-2747
d
https://orcid.org/0000-0003-0098-9456
e
https://orcid.org/0000-0002-4762-4342
head-mounted devices (HMDs), which can influence
gaze behavior in complex VR scenarios in various
ways, such as object manipulation tasks or distance
estimation for example (Mizuchi and Inamura, 2018).
Moreover distance judgment is commonly underes-
timated in virtual environments when users wear an
HMD, partly due to the FOV restrictions but also due
to the weight of the device (Willemsen et al., 2009).
The use of HMDs also affects the vergence movement
of the eye, which consists in keeping the gaze posi-
tioned on an object depending on its distance and lo-
cation, so researchers aim to improve its computation,
tracking methods and calibration in 3D environments
(Duchowski et al., 2022). These studies demonstrate
an important level of interest for gaze behavior in vir-
tual environments.
This paper presents a methodological approach to
generate standardized and comparable eye-tracking
and behavioral data in real and virtual environments.
This workflow is focused on interaction and behav-
ior for visual exploration of an object. Our approach
addresses the challenges of comparing data collected
using different devices and environments, enabling a
comprehensive analysis of eye-tracking and behav-
Dumonteil, M., Macé, M. J., Gouranton, V., Nicolas, T. and Gaugne, R.
A Method for Standardizing Eye-Tracking and Behavioral Data in Real and Virtual Environments.
DOI: 10.5220/0013124100003912
Paper published under CC license (CC BY-NC-ND 4.0)
In Proceedings of the 20th International Joint Conference on Computer Vision, Imaging and Computer Graphics Theory and Applications (VISIGRAPP 2025) - Volume 1: GRAPP, HUCAPP
and IVAPP, pages 211-222
ISBN: 978-989-758-728-3; ISSN: 2184-4321
Proceedings Copyright © 2025 by SCITEPRESS – Science and Technology Publications, Lda.
211

Figure 1: Eye-tracking and motion tracking during the same task in reality (left), an immersive room (center) and a virtual
environment (HMD) (right).
ioral data in different modalities, presented in Fig.1: a
real environment, a virtual environment using an im-
mersive room setup and a virtual environment using
a VR HMD. However, comparing 3D gaze data in
different modalities presents unique challenges. Eye
and body movement tracking devices in real and vir-
tual environments produce heterogeneous streams of
information and performing comparable analysis re-
quires standardized methods of data collection and
analysis. Despite these challenges, several studies
have highlighted the validity of virtual environments
as counterparts to real-world scenarios in various
fields of research, with some researchers revealing
similarities in exploration patterns, especially for eye
fixations between physical and virtual contexts (Gul-
han et al., 2021).
Our methodology is illustrated through an archae-
ological use case study, completely presented in (Du-
monteil et al., 2024), which focuses on characterizing
differences in an observation task to analyze a corpus
of ancient artifacts reproduced across the modalities.
Experimental results and description are detailed in
the mentioned work.
This methodology outlines a comprehensive
workflow for data preparation and analysis, starting
from experiment design, through data acquisition and
processing, and ending with the analysis and interpre-
tation, based on eye tracking results and movements
analysis. For each of these stages, several solutions
and recommendations are provided, along with de-
tailed descriptions of each step.
2 RELATED WORKS
This section first lists a number of frameworks and
tools that facilitate the analysis of user behavior. It
then presents a group of studies that have processed
eye-tracking data in a real and mobile context.
Some solutions handle eye-tracking data in a
virtual context, such as PLUME, an open-source
toolbox for recording, replaying and analyzing XR
behavioral data, including physiological signals,
such as eye tracking or EEG for example (Javerliat
et al., 2024). Similarly other framework have been
developed but mainly focused on behavioral data
processing in virtual environment such as XREcho
(Villenave et al., 2022) or UXF (Brookes et al.,
2020), which collect and register behavioral events.
Another solution manages the recording and visual-
ization of gaze data during an exploration of a car
interior in VR (Li, 2021). In addition, commercial
software is used to capture or visualize behavioral
data from VR applications, such as Tobii Ocumen,
a toolkit designed for Tobii devices integrated into
HMDs (https://developer.tobii.com/xr/solutions/).
Cognitive3D proposes the same functionalities
(https://cognitive3d.com/). However the aforemen-
tioned studies only consider the processing of eye
tracking in a virtual environment. Furthermore all
of these behavior analysis solutions mainly handle
the HMD modality; they do not consider the con-
straints of the standardization and integration of other
modalities.
To compare human behavior between real and vir-
tual environments, we need a framework that can per-
form such a behavioral analysis. Therefore, it is im-
perative to improve the processing for a recording in
a real mobile context (Takahashi et al., 2021; Pfeif-
fer et al., 2016; Wang et al., 2017). To estimate the
gaze on a 3D model with respect to a real environ-
ment, some researchers (Paletta et al., 2013) develop
a method to generate a 3D map of the environment,
using a SLAM (Simultaneous Localization And Map-
ping) method then image descriptor matching without
fiducial markers to estimate and then project the user’s
attention on this virtual map. Similarly, some re-
searchers present pipelines to process 3D eye tracking
from 2D data but without any kind of markers, using
a structure-from-motion method (Li et al., 2020; Jo-
geshwar and Pelz, 2021). Even though these solutions
are efficient, it is less suitable for mapping gaze with
GRAPP 2025 - 20th International Conference on Computer Graphics Theory and Applications
212

the precision required on a specific object than on an
entire environment. Finally, another study proposes a
workflow and an implementation to define an experi-
mental scenario for an eye tracking study in a virtual
environment, including preparation, data collection,
analysis, and visualization (Ugwitz et al., 2022). De-
spite the adapted methods that are presented and the
well explained implementation, this solution, like the
previous one, does not illustrate modality comparison
in eye-tracking processing and it is primarily focused
on one type of environment.
3 WORKFLOW
3.1 Overview
The objective of the presented methodology is the
generation of standardized and comparable eye-
tracking and behavioral data across different modal-
ities, for an object observation task. As presented in
Figure 2, it is structured around four components:
• Experimental settings: a definition of the proto-
col, the constraints and the resulting rules that are
necessary to establish a comparison between mul-
tiple modalities;
• Acquisition: a description of the required data for
processing and analysis and how to generate them,
using different devices for different modalities;
• Processing: a description of the required compu-
tational processes to transform the raw acquired
data into the standardized format of 3D gaze data;
• Interpretation: an overview of the analytical tech-
niques that can be applied to these data sets, facil-
itating the examination of cross-modal behavioral
and gaze pattern study.
3.2 Experimental Settings
The experimental settings section gathers three dif-
ferent activities. The first concerns the definition of
the execution protocol for the task to be compared
between the different modalities. The next two are
protocol-dependent and concern the design of the data
acquisition apparatus and the 3D environment.
3.2.1 Protocol
The aim of the protocol is to enable a similar task to
be performed in interaction with an object, between
real and virtual environments. In order to remain as
general as possible, we consider two types of virtual
environments, the first based on a VR HMD, and the
second based on a CAVE-like immersive space. Thus,
our purpose considers three different modalities:
• Real modality: the task is performed on the real
object;
• HMD modality: the task is performed in VR, on a
digital 3D copy of the object, wearing an HMD;
• Immersive modality: the task is performed in VR,
on a digital 3D copy of the object, in a CAVE-like
immersive room.
Both HMD and Immersive modalities are consid-
ered because of potential differences in user behavior.
In an immersive room, users can see their own body,
allowing for more natural interactions, which could be
particularly interesting for users unfamiliar with VR.
However, since HMDs are widely used for VR, it is
essential to include this modality in our study due to
its accessibility.
In order to obtain comparable behaviors, it is im-
portant to make the tasks that the participants have to
perform as similar as possible between the different
modalities. For the sake of generality, we will focus
on an object observation task. For this purpose, the
scenario of the task must be based on three elements:
(i) the scene, (ii) the positioning and the ability of the
participant to move in the scene, and (iii) the ability of
the participant to interact with the object considered
in the scene. Thus, we can state that the scene con-
sists of the object, the participant’s movement space,
and the interaction media between the participant and
the object.
The positioning of participants in a space and their
ability to move within that space is a central element
in a behavioral study. It is possible to constrain partic-
ipants’ movements by, for example, restricting them
to a seated position in the scene. However, it is more
interesting to take advantage of the natural movement
capabilities of virtual reality by allowing the user to
move around in the scene.
Similarly, it is important to clearly define the par-
ticipants’ ability to interact with the object. Ideally,
participants should be allowed to pick up the object
with their hands and handle it freely during the obser-
vation task. However, such a level of freedom in the
user’s interaction with the object can create complex
constraints in the management of data production and
analysis, particularly related to the object’s position
tracking capabilities and the risk of the object being
occluded by the participants’ hands. In order to give
participants a sense of control over their observation
task, we recommend implementing a moderate level
of interactions to provide a feeling of agency while
avoiding unnecessary complications.
Furthermore, it is recommended that a framework
A Method for Standardizing Eye-Tracking and Behavioral Data in Real and Virtual Environments
213
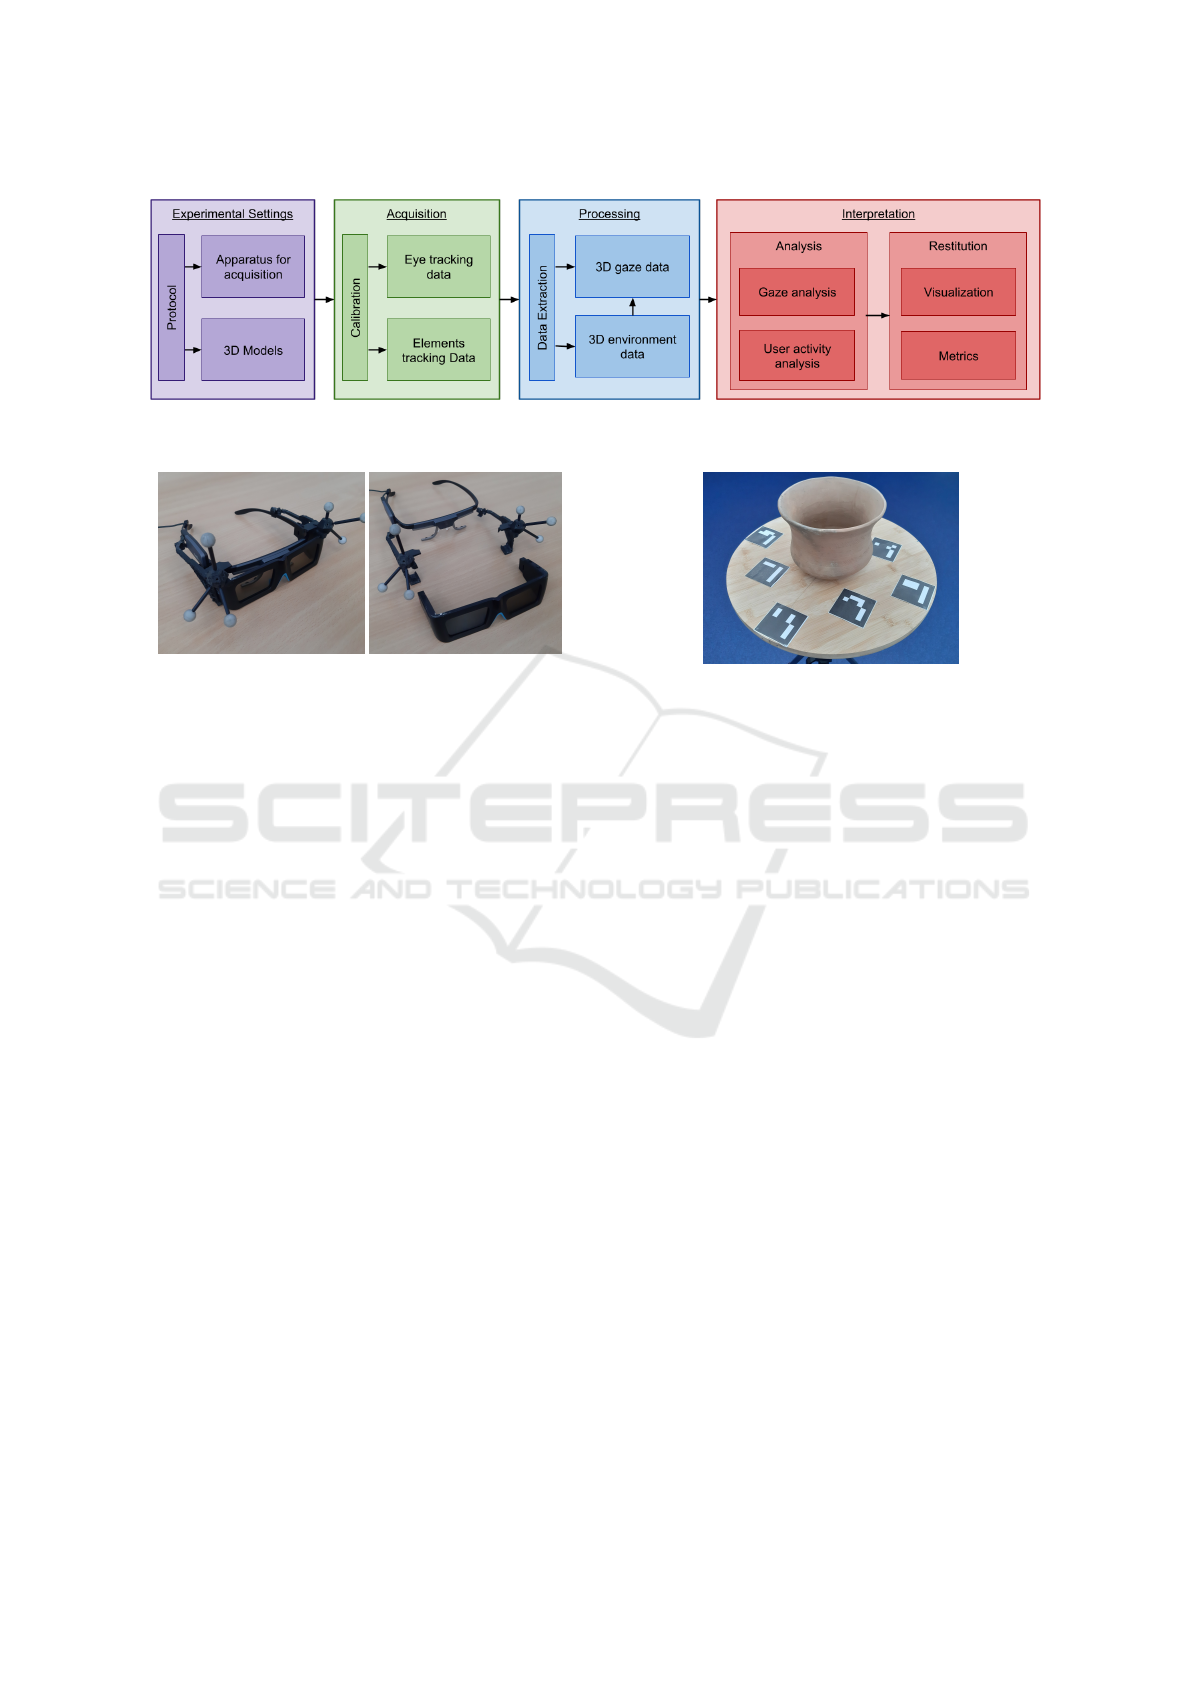
Figure 2: Workflow Components schema, structured in four blocks: Experiment Settings (purple), Acquisition (green), Pro-
cessing (blue) and Interpretation (red).
Figure 3: An assembly combining a system of Vulfoni
stereoscopic glasses with Tobii 2 eye tracking glasses, at-
tached together with a 3D-printed clip which is also de-
signed as the tracking constellation system.
for the task be established that allows for active obser-
vation by the participants. This can be accomplished
through the use of an object observation questionnaire
that can be completed by participants during the task
and includes questions related to the objects’ colors,
shapes, and textures.
3.2.2 Apparatus for Acquisition
The acquisition equipment is mainly concerned with
the acquisition of eye-tracking data and the position-
ing of moving elements in the environment, i.e. the
participant and the object.
Given the participant’s choice of mobility in the
scene, eye tracking is performed by equipment worn
by the participant. For the Real modality, there are
several models of eye-tracking glasses that meet this
constraint. Similarly, various models of VR HMDs
incorporate eye-tracking systems. The immersive
modality is often more complex, as there are no off-
the-shelves stereoscopic goggles with eye-tracking.
We present a solution example in the 3.2.4 section that
details an implementation for a specific use case.
Participant’s head tracking and object tracking are
directly taken into account in the two virtual modali-
ties (default API features for HMD and external cam-
era tracking for the immersive room). Different so-
lutions can be adopted for the Real modality such
as external IR-based mocap systems, inertial track-
ing systems or video-based systems. We chose to use
Figure 4: Augmented Reality markers (ArUco fiducial
markers) placed around the object of interest in order to
track the participants’ position relative to the object.
the built-in capabilities of eye-tracking goggles rely-
ing on the on-board camera and IMU. In this case,
the video captured by the on-board camera is used
as input to a processing algorithm to track the dis-
placement of elements using AR markers placed in
the scene as in Figure 4. Note that in this particular
case, as the markers are placed on a turntable moving
with the observed object, this method measures a rel-
ative position between the head and the object, which
may not be enough, depending of the use case.
3.2.3 3D Models
This part is related to the design of the virtual scene
that represents the real scene. It is important to de-
vote particular attention to the similarity between the
object representations in each modality, real or vir-
tual. All concerned objects of interest must be pro-
vided with an actual and a virtual version. Thus two
possible scenarios may be identified: the production
of a virtual version of a real object, or the generation
of a real object from a virtual model. The first case
can be handled by a scanning method that produces a
3D mesh with high accuracy, such as photogramme-
try. In the second case, the real copy is made from an
original 3D virtual model using 3D printing for exam-
ple. In both scenarios, there are several points to bear
in mind: the quality of the produced (real or digital)
copy, its appearance (texture, color, ...) compare to
the original object and its accurate size.
GRAPP 2025 - 20th International Conference on Computer Graphics Theory and Applications
214

3.2.4 Implementation
We have implemented an archaeological use case ad-
hering to our workflow to allow comparison of the
same observation task on a corpus of archaeological
artifacts performed in different modalities.
The archaeological artifacts under observation
were placed on a turntable that the user could ma-
nipulate. They were allowed to freely move around
the table and to rotate the turntable during the obser-
vation task but could not directly touch and manip-
ulate the object. The observation questionnaire, an-
swered by the participants after each observation, was
based upon an actual archaeological artifact analysis
grid (Cauliez et al., 2002).
For the Real modality, the participant wore Tobii
Pro Glasses 2, a mobile eye-tracking system. ArUco
markers were disposed on the turntable around the ar-
tifact, and used to compute the relative position of
the user head with respect to the object. For the
HMD modality, they wore an HTC Vive Pro Eye
VR headset and finally for the Immersive modality,
they were placed in an immersive space constituted
of a 4-sided viewing screen measuring 10 m x 3 m
x 3 m (width, depth and height), tracked using pas-
sive markers detected by an Optitrack system. Stere-
oscopy was guaranteed by Vulfoni glasses, to which
Tobii eye-tracking goggles were attached using a 3D-
printed clip (Figure 3).
The observation task was based on a corpus of
three distinct potteries selected for their stylistic di-
versity. Facsimiles of the pottery were used during
the experiment as real objects, and virtual 3D models
were then generated using photogrammetry. The vir-
tual scene was a faithful representation of the real en-
vironment used in the experiment. The virtual scene
was designed and implemented using the Unity game
engine (version 2021.3.8f1).
3.3 Acquisition
The acquisition part comprises three different activ-
ities. The first is the calibration of the different de-
vices involved in data acquisition between the dif-
ferent modalities. We separate the acquisition tasks
for the eye-tracking data and the different mobile ele-
ments of the scene, as the nature of the data collected
is significantly different.
3.3.1 Calibration
The calibration process is an essential step to en-
sure data quality during eye tracking recording. This
mandatory step is completed before each task begins,
in all modalities and for each iteration. Manufactur-
ers usually provides a standard calibration procedure
that is simple to integrate in an experimental protocol.
Nevertheless even if the standard procedure is rela-
tively simple to setup, its convenience comes at the
cost of its quality. Some research work aim at enhanc-
ing the calibration process for eye-tracking glasses
(Onkhar et al., 2023; Liu et al., 2020) while keep-
ing it’s simplicity. However, in most case, record-
ing high-quality data requires a more elaborate and
time-consuming procedure. The decision depends on
the desired quality and, most importantly, the feasi-
bility of integrating a more complex procedure into
the protocol. With regard to elements tracking, both
lighthouse (for HMD modality) or IR tracking (for
Real or Immersive modality) have to be calibrated be-
forehand. The same is true of the inside-out HMD
tracking system, although it may require to repeat the
tracking calibration process if light conditions change
in the room for example.
3.3.2 Eye-Tracking Data
The initial objective of the eye-tracking data obtained
during the acquisition phase for the observation of an
object is to facilitate the calculation of user’s gaze,
based on the direction and the point of origin of the
gaze. Eye-tracking glasses, such as the Tobii Pro
Glasses 2, record the coordinates of the gaze on the
image of the scene (indicated by x
0
and y
0
in Fig-
ure 5), recorded by a camera placed at the center of
the glasses between the eyes. The output video cor-
responds to the user’s point of view, onto which the
gaze position is projected. In the case of HMD, the in-
tegrated eye-tracking system records a gaze ray, with
a point of origin and a direction.
In addition, eye-trackers record information about
eye blink and pupil diameter. The information used
to identify blinks varies with the device. For exam-
ple, on a Vive Pro Eye HMD, the data is taken di-
rectly from the Tobii API outputs, whereas on Tobii
Pro Glasses 2, the information is not directly avail-
able, but can be inferred from pupil data and gaze
position. A blink is identified as a loss of data for
both eyes (with null coordinates for gaze position).
Missing data can also occur if the user looks out of
the tracker’s field of view, or if the device moves too
much on the head. Nevertheless, the manufacturer
also recommends using eye openness as a marker
for blinks onsets and offsets. The information of
eye blink and pupil diameter can be used to measure
specific user’s behavioral aspects such as cognitive
workload (Pomplun and Sunkara, 2019; Zhang et al.,
2015).
A Method for Standardizing Eye-Tracking and Behavioral Data in Real and Virtual Environments
215
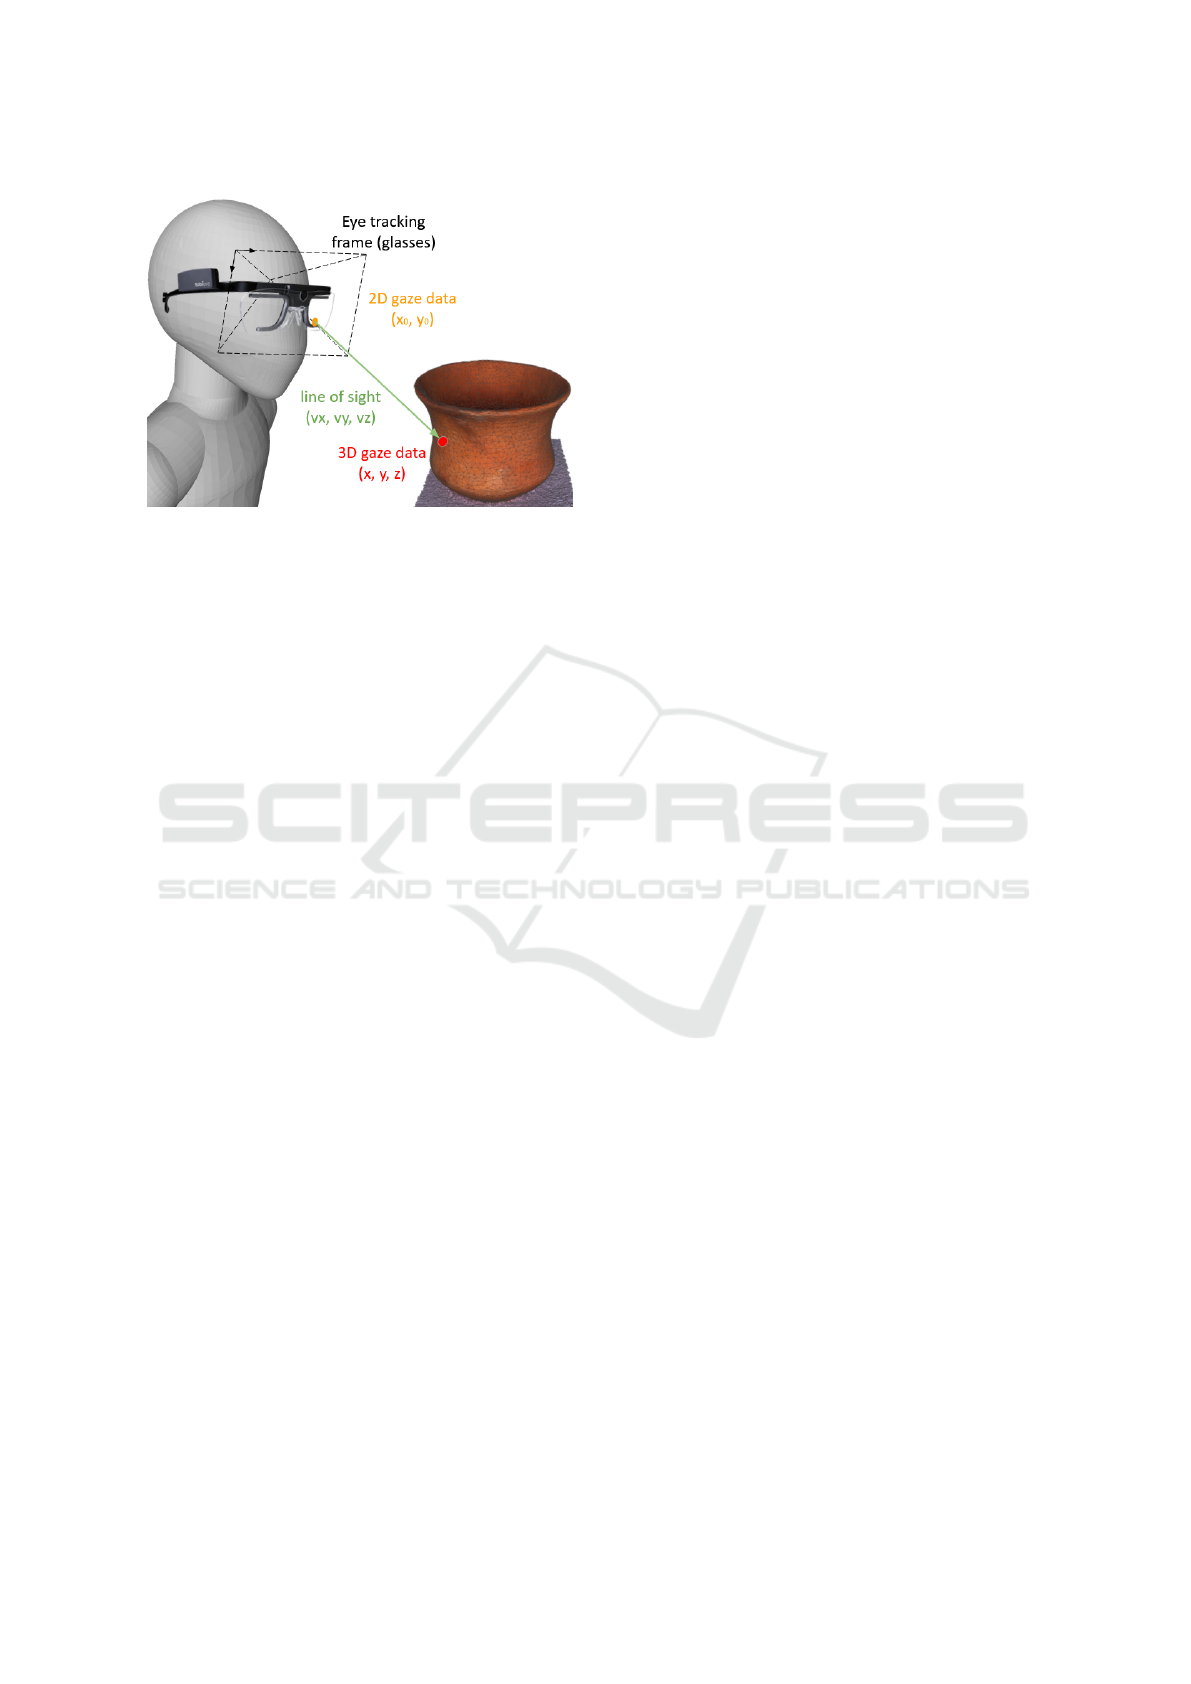
Figure 5: Representation of the elements involved in calcu-
lating the intersection point (red) of the line of sight (green)
on the observed object mesh from 2D eye tracking (yellow)
and user’s head position data.
3.3.3 Elements Tracking Data
The tracking of environmental elements, such as the
user’s head and the object being observed (real or vir-
tual), necessitates the independent acquisition of po-
sition and rotation data for each element. This type
of data is typically generated directly by standard op-
tometric or inertial tracking systems. It can also be
complemented by videos via pose estimation for the
Real modality, or directly available in the engine soft-
ware for the irtual modalities.
3.3.4 Implementation
We used standard calibration procedures recom-
mended by the providers for the different tracking
system. The ET calibration was performed before
each observation task. In both the real and immer-
sive modalities, we collected the 2D coordinates of
gaze on the image of the scene provided by the ET
glasses. In the case of the HMD, we collected the
point of origin and gaze direction recorded by the in-
tegrated ET system. The positions and rotations of the
user’s head and the object were recorded for the HMD
and Immersive modalities. For the Real modality, we
implemented the method presented in the section 3.2,
collecting the videos recorded by the on-board cam-
era of the ET glasses, to perform pose estimations.
3.4 Processing
The main goal of the processing stage is to generate
3D gaze data about the observed object (in red in the
figure 5 in the form of coordinates (x,y,z)). The first
step is to extract and prepare the necessary data from
the various data collected. This data is then used to
accurately calculate the coordinates of the user’s head
and the object observed in the virtual environment.
The final step is then to calculate the gaze ray using
the ET data.
3.4.1 Data Extraction
Data extraction involves the collection and format-
ting of eye-tracking data and elements position and
rotation data from multiple acquisition sources. This
preliminary phase is based on simple data extraction
tools and depends on the acquisition devices used. It
can be performed on video data, CSV or JSON files.
3.4.2 3D Environment Data
The 3D environment data does not require specific
processing for the HMD and Immersive modalities.
They are directly collected in the log files of the ap-
plication. For the Real modality, the solution to re-
trieve the element tracking data depends on the ac-
quisition solution implemented. In the case of AR
marker-based tracking, a pose estimation is required.
It is presented in section 3.4.4 as we used this method
in our implementation of the workflow.
3.4.3 3D Gaze Data
The generation of 3D gaze data corresponds to com-
puting the position of the gaze on the object, i.e. the
point of intersection between the line of sight, in the
form of a vector (vx, vy, vz) (in green on Figure 5) and
the 3D model of the object. Three pieces of data are
therefore required: the direction of gaze, the position
and orientation of the user’s head, and the position
and orientation of the object. The calculation of the
last two is mentioned in the previous section.
Since the sampling frequency of the different data
is not the same between the different acquisition de-
vices, it is necessary to perform a synchronization cal-
culation of these data by interpolation. As standard,
this calculation takes as a reference the data file with
the lowest sampling rate and applies a linear interpo-
lation calculation to the other data files for each times-
tamp of the reference data.
Once all elements are correctly placed in relation
to each other, the line of sight is computed as a ray
cast in the direction of the gaze. This process depends
on the modality in which data was collected. Regard-
ing the HMD modality, as mentioned in section 3.3.2,
the line of sight is already provided as a vector us-
able for gaze ray-casting by the Tobii XR software
package associated to the HTC Vive Pro Eye that we
used in our implementation. For Real and Immer-
sive modalities, i.e. modalities that use eye-tracking
GRAPP 2025 - 20th International Conference on Computer Graphics Theory and Applications
216

glasses, there are two main methods to compute the
line of sight. The first one is to use the gaze direction
provided by the ET system for each eye. The second
one is to use the projection of the sight on the model
of the ET system embedded camera. In this case, the
sight is projected on the virtual screen of the camera,
giving (x
0
, y
0
) coordinates that can be used to calcu-
late the gaze ray and subsequently the projection of
the sight on the 3D object.
3.4.4 Implementation
For the HMD modality, eye-tracking data (origin and
direction of gaze) was collected and aggregated from
the device API into a JSON file, while elements
movement data (position and rotation vectors) were
directly collected from Unity.
For the other two modalities that use ET glasses,
we collected and processed the raw data produced
by the device with a custom script that retains only
the necessary data, such as gaze coordinates in the
device’s video image. This video from the glasses
scene camera is exploited for both elements tracking
and eye tracking, with the 2D coordinates of the gaze
in the video frame. Therefore, it is crucial to syn-
chronize this high-frequency eye-tracking data with
the scene video frequency, interpolating these coor-
dinates to get coherent data from the eye-tracking
glasses.
In order to compute the 3D gaze data, we have
implemented a process to replay the records and thus
cast a ray to get the intersection point on the ob-
served object. For the tracking of elements in the
Real modality, we implemented the method presented
in (Takahashi et al., 2018), using an image process-
ing and pose estimation method with ArUco markers
(Garrido-Jurado et al., 2014) captured on the video
captured by the glasses. For the two modalities that
use ET glasses, a virtual representation of the ET sys-
tem embedded camera is used inside the processed
scene for computing the gaze ray from eye-tracking
data. This solution provides a more uniform handling
of the three modalities because, for the HMD modal-
ity, the solution is to use the straightforward gaze di-
rection data provide by the API.
3.5 Interpretation
The interpretation step of the methodology provides
analysis and restitution (graphical representations and
metrics) to compare the user’s behavior during the ob-
servation task between the different modalities.
3.5.1 Analysis
We are considering different tools to analyze the
user’s gaze and behavior in turn.
Gaze Event Detection There exist many different
eye movements studied in the literature, from the
most obvious and common ones to more subtle and
complex ones to detect. In order to keep the focus
on a comparative workflow between real and virtual
contexts, we will only consider the following three:
• Fixations: a movement when eyes are locked on
an object in order to stabilize the object on the
fovea for clear vision.
• Saccades: a fast eye movement between two fixa-
tions.
• Smooth Pursuit (SP): a more complex movement
that tracks a moving target to keep it within the
fovea.
Many strategies have been developed to distin-
guish gaze events from each other, depending on the
target event and its definition. Examples of popu-
lar algorithms are presented in Table 1. The most
commonly used algorithms are based on two crite-
ria: velocity and dispersion. In velocity-based al-
gorithms, such as ”identification by velocity thresh-
old” (IVT)(Salvucci and Goldberg, 2000) the veloc-
ity of the eye is exploited in order to identify fix-
ations as low values, while saccades as higher val-
ues. Dispersion-based algorithms, such as ”dispersion
threshold identification” (IDT)(Salvucci and Gold-
berg, 2000), consider the distance between observed
points that correspond to the same temporal and spa-
tial information, which is less pronounced in fixa-
tions than in saccades. Based on these core prin-
ciples, some algorithms improve these methods by
adding other thresholds, such as ”velocity and disper-
sion threshold identification” (IVDT)(Komogortsev
and Karpov, 2013), or by implementing a second pro-
cessing step, such as ”velocity and movement pat-
tern identification” (IVMP)(Komogortsev and Kar-
pov, 2013). Finally, other algorithms rely on machine
learning (Zemblys et al., 2018; Startsev et al., 2019)
to detect gaze events, avoiding the primary limitations
of the aforementioned methods, such as the necessity
to set optimal parameters. These methods require spe-
cific implementation and execution procedure, in ad-
dition to model training, which is not feasible in every
experimental protocol.
We have implemented an algorithm based on the
I-VDT event detection methods (Llanes-Jurado et al.,
2020; Komogortsev and Karpov, 2013; Duchowski
et al., 2022). This choice is based on its widespread
A Method for Standardizing Eye-Tracking and Behavioral Data in Real and Virtual Environments
217
Table 1: Gaze event detection algorithm examples.
Method Principle Events detected Drawbacks
IDT Dispersion threshold Fixation and saccades Threshold settings & Robustness
IVT Velocity threshold Fixation and saccades Threshold settings & Robustness
IVDT Dispersion and velocity threshold Fixation and saccades (and SP) Threshold settings
IVMP Velocity threshold and movement magnitude Fixation, saccades and smooth pursuit Threshold settings
NH Adaptive velocity threshold Saccades, PSO then fixation Restricted detection
DBSCAN Unsupervised learning clustering Fixation, saccades and SP Parameters settings
Machine Learning Machine Learning algorithms (...) Fixation and saccades (and PSO) Model training
use in the community, its ease of implementation and
its reduced computational complexity in terms of pro-
cessing time and space, allowing real-time execution
if necessary. According to the recommendations from
(Llanes-Jurado et al., 2020; Salvucci and Goldberg,
2000), we used the values 1.3° for dispersion thresh-
old and 0.1 s for time threshold.
For SP events, detection becomes more challeng-
ing because it also depends on user and object mo-
tions. The setup proposed in our workflow allows to
detect the motions of these elements independently
from the eye-tracking data. Therefore, the distinction
between fixation and SP depends on whether the ele-
ments are moving or not.
User Activity Analysis. User behavior can be ana-
lyzed by examining their movements in the environ-
ment and their interactions with the observed object.
To do this, it is possible to use position elements and
their derivatives, such as trajectory, speed or velocity,
and identify, levels of effort for example. It is also
interesting to analyze the spatial relationship between
the user and the object, through their distance or rel-
ative position, for example. Finally, quantifying the
interaction, in terms of interaction time or the amount
of movement applied on the object, in the case where
the user can control the position of the observed ob-
ject, constitutes an indicator for comparison between
the different modalities.
The spatial relationship and interaction quantifica-
tion are straightforward information to compute from
the information collected with the tracking data. The
spatial relation part is particularly relevant in the con-
text of the observation task we consider. Behavioral
analysis from motion requires models that are compa-
rable to those used for gaze event analysis, but are less
relevant to the scope of our work and are therefore not
presented in detail here.
3.5.2 Restitution
We consider two families of restitution of the ana-
lyzed data, (i) visual representations, and (ii) metrics
and statistical information. Visual representations are
presented in four categories, (i) semantic visualiza-
tion for ET (examining gaze behavior as a function
of a semantic decomposition of the object), (ii) ge-
ometric visualization for ET (representing results as
a function of the 3D coordinates of gaze on the ob-
served object), (iii) temporal visualization for ET, and
(iv) visualization of user activity. Regarding metrics,
we consider two categories, (i) ET metrics and (ii)
user activity metrics.
Semantic Visualization of Eye-Tracking. For a
more relevant study of gaze behavior in relation to the
observed object, it is common practice to use an ab-
straction of that object, to represent areas of interest
(AOIs) (Blascheck et al., 2017). This abstract descrip-
tion can be defined with respect to the saliency aspect
of the object (Wang et al., 2016; Kim et al., 2010), or
can correspond to regions on the object that are corre-
lated with a visual stimulus (Blascheck et al., 2017).
The partitioning of the object can also represent a sig-
nificant semantic decomposition of the object.
Figure 6 shows a decomposition of the simple
mesh (a) into different AOIs, which are identified
by different colors (b). This decomposition can be
straightforwardly represented by an abstract version
of the object (c), which allows easy visualization of
gaze behaviors such as ”most viewed parts”. This
type of decomposition makes it possible to analyze
gaze behavior at a higher level of abstraction than the
observed object, and to derive relevant metrics that are
easier to interpret. Furthermore, this type of decom-
position makes it possible to reason about collections
of similar objects, which is precisely the case in the
underlying archaeological study.
Geometric Visualization of Eye-Tracking. The
most used visualization in eye tracking study is the
heat map (Figure 7), or attention maps, which is a vi-
sual representation of fixations distribution on the ob-
served object (Herman et al., 2023; Stellmach et al.,
2010; Sundstedt and Garro, 2022). Each area is rep-
resented by a zone with a color gradient which could
indicate the frequency of gaze on a point. The ren-
dering of this visualization strongly depends on its
parameters, which correspond to the value threshold
GRAPP 2025 - 20th International Conference on Computer Graphics Theory and Applications
218
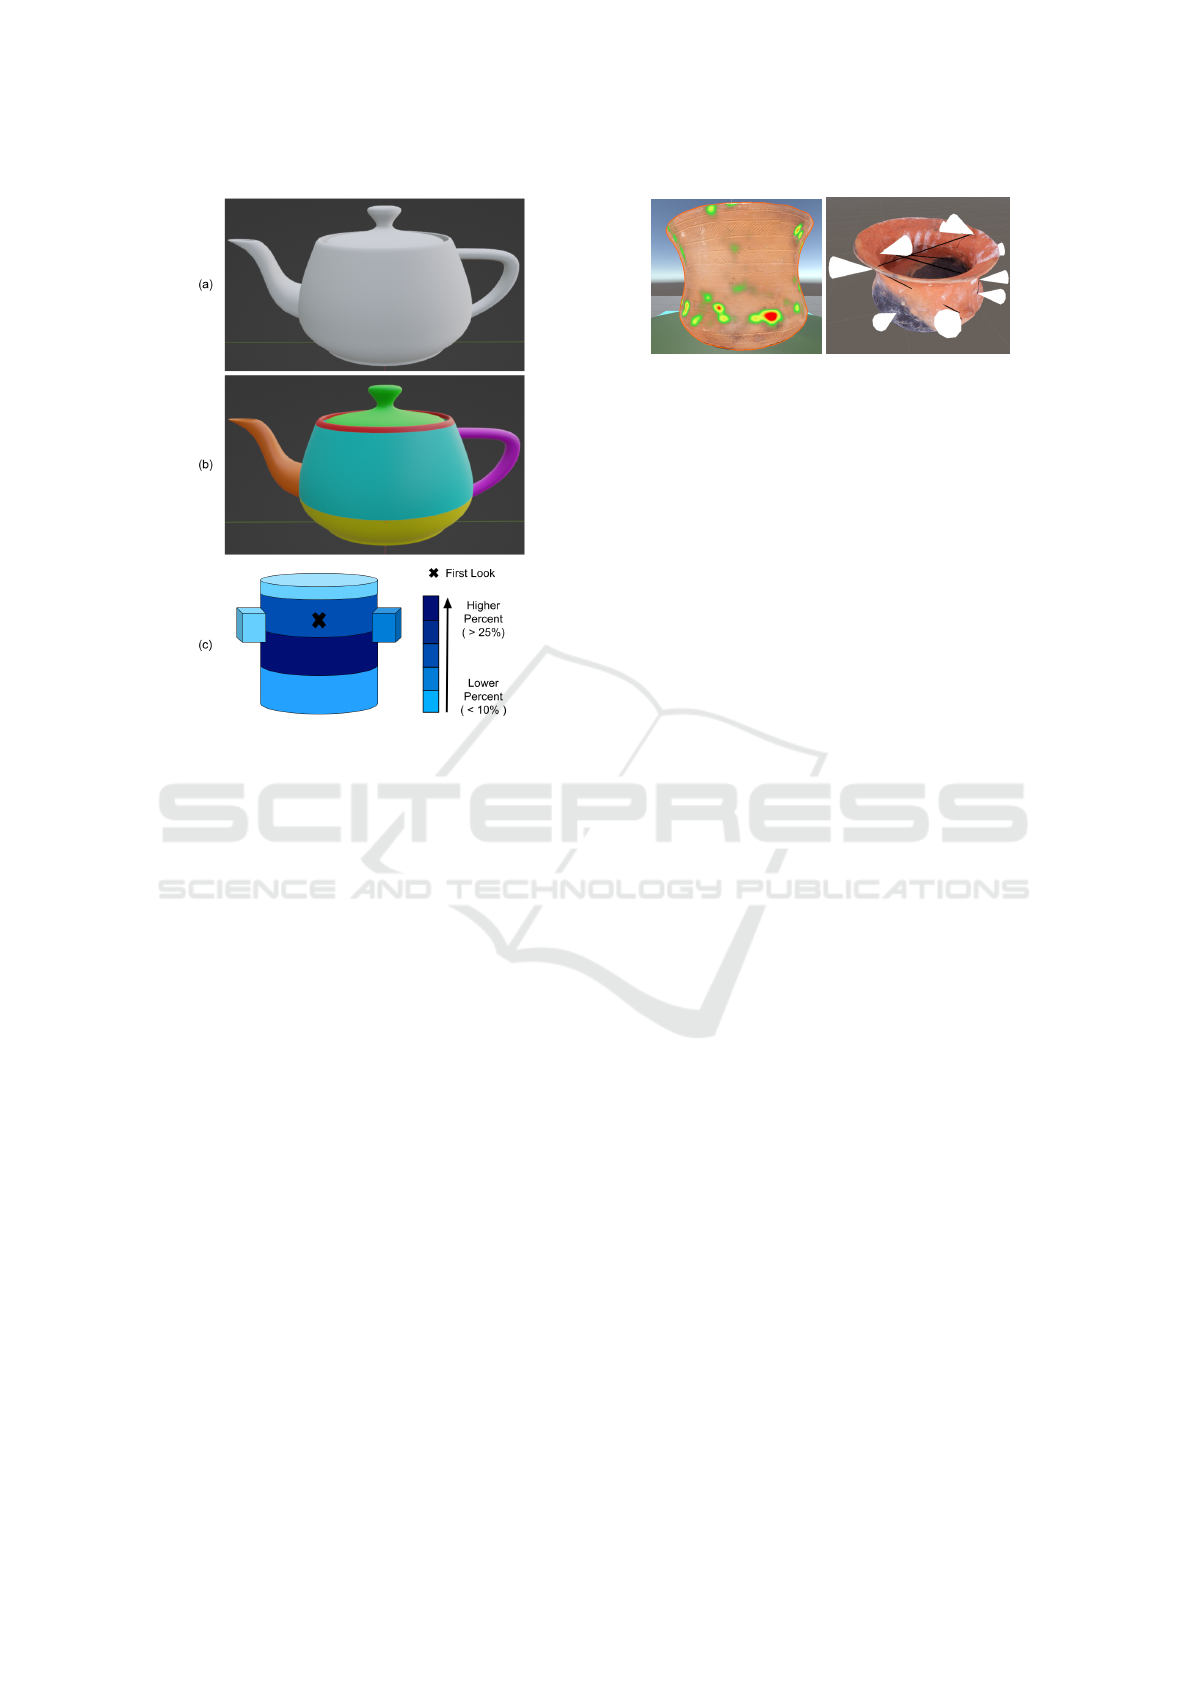
Figure 6: Examples of a semantic visualization: a teapot
3D model (a), segmented in different AOI due to the mesh
profile (b) and an abstract version of the model to clearly
visualize results on it (c).
for the heat zone to appear, its radius, and the color
scale. In the case of a 3D environment, the cone of
vision is used to produce a distribution of gaze over
the surface of the observed object, taking particular
account of potential occlusion due to the object’s pro-
file and elements. Accordingly, heatmap processing
uses a Gaussian blur filter (Stellmach et al., 2010;
Pfeiffer and Memili, 2016) or, more effectively, an
adapted gaze projection (Javerliat et al., 2024) that
treats the gaze ray as a cone, opening the frustum in
depth through the use of a Gaussian distribution. Fi-
nally, some works also propose to generate 3D atten-
tion volumes, using volume-based rendering to repre-
sents the distribution of visual attention in the envi-
ronment (Pfeiffer, 2012).
The other important visualization method is the
gaze plot (Figure 7), which is a graph with fixation
points as nodes and successive saccades as edges.
An interesting representation for fixation points uses
cones to represent user’s position associated to the
concerned movement (Stellmach et al., 2010). The
cone’s apex represents the fixation center position, its
radius is relative to the event duration, its height rep-
resents the distance between the gaze origin (user’s
head) and gaze intersection point, and its orientation
is based on the viewing direction.
Figure 7: Example of a visualization directly represented
on the concerned object, respecting its mesh (left: heatmap,
right: gaze plot).
Temporal Visualization of Eye-Tracking. An-
other aspect addressed by some ET visualization
methods involves considering and representing time.
Most of these methods are defined the context of
2D data, e.g. gaze stripes (Kurzhals et al., 2016)
and space-time cubes (Li et al., 2010; Kurzhals and
Weiskopf, 2013) Extending these visualization meth-
ods to 3D gaze data requires a fourth dimension
(Blascheck et al., 2017). In this case, the most com-
mon solution is to use an animated visualization en-
vironment. For example, the GazEnViz solution al-
lows to explore a recording and view the results over
a specific period of time. The main risk of this type
of visualization is the cluttering up of the informa-
tion displayed. The visualization method proposed
by (Pathmanathan et al., 2023), which is a 3D ex-
tension of space-time cubes method, implements fil-
tering systems per recorded user to simplify the dis-
played data. This approach could be extended in our
case to a filtering system per modality considered, but
again at the risk of complicating the visualization en-
vironment.
Visualization of Movement. The visualization of
the user’s movements can be based on the represen-
tation of a 3D trajectory as in (Javerliat et al., 2024),
with the possibility to limit it to a certain time pe-
riod or to display several trajectories simultaneously.
It may also be interesting to visualize users through
avatars, with different type of representations, such
as hands to focus on interactions, or feet to focus
on walking in the environment (Reipschl
¨
ager et al.,
2022)). In this case, the visualization is an animation,
as in (Pathmanathan et al., 2023), with the same draw-
backs of data overload as in the case of the temporal
visualization of the ET.
Eye-tracking Metrics. In eye tracking studies, fix-
ations are often used and examined using a variety of
metrics. Fixation duration, number of fixations in a
time period, fixation frequency, defined by the num-
ber of fixations on the observed object divided by the
duration of the time period studied, are all signifi-
A Method for Standardizing Eye-Tracking and Behavioral Data in Real and Virtual Environments
219

cant values. In addition, a description of gaze pat-
terns, such as the first fixation, can provide informa-
tion about the user’s attentional focus. Similarly, sac-
cades and SP can be examined by their duration, am-
plitude, or velocity.
When combined with AOIs, gaze events can be
used to calculate a variety of metrics, such as the
amount of time spent on each area of the object, or the
number of visits (which can be defined by the passage
of the gaze point from one AOI to another).
User Activity Metrics. As for gaze events, user ac-
tivity can be transformed into a variety of metrics. We
can consider values related to displacements, such as
distance traveled, velocities and accelerations or sta-
tionary phases, values related to relative positions be-
tween the user and the object, such as average dis-
tance, relative height, or values related to interactions,
such as the number of interactions, the amount of ob-
ject displacement caused by these interactions.
3.5.3 Implementation
For the visualizations, heatmaps and gazeplots are
generated, as presented in the Figure 7, and then for
the semantic representations, five AOIs are consid-
ered on the pots: the inner part, the top, body and foot
parts, and then the raised parts, which can be handles
or buttons. This decomposition corresponds to a stan-
dard structural decomposition used in archaeology.
To compare the user activity in relation to the ob-
ject, we considered two metrics: (i) the distance be-
tween the user’s head and the center of the object and
(ii) a vertical angle. The latter is defined as the an-
gle between two vectors originating from the center
of the artifact: a vector towards to the user’s head and
a vertical vector pointing upwards. As the vertical
angle value approaches zero, the head is positioned
above the artifact. This allows to measure how much
the user is above the artifact while looking at it, which
could be useful if the inside of the object is relevant to
the observation task. The metrics used to analyze eye
tracking and user’s behavior are presented in the Table
2. Additionally, we also inspect acceptability with a
TAM questionnaire and object analysis grid answers.
4 DISCUSSION
The workflow presented here is methodological in the
sense that it is not software-based, but can be seen
as a structured guideline for designing, implementing
and conducting a user study across three modalities to
enable comparison.
Table 2: Gaze-related and behavioral metrics summary.
Subject Metric Requirement
Fixation Duration -
Dispersion -
Frequency Offline analysis
First fixation Duration -
Dispersion -
Area of interest Associated fixation Fixations description
Order in scan path Offline analysis
Activity Head distance Elements position
Vertical angle Elements position
The workflow has been designed to be generic so
that it can be applied to different eye-tracking and
behavioral studies conducted in virtual and real en-
vironments. In this way, it is possible to compare
the performance of the same task in different modal-
ities, making it possible to identify differences dur-
ing a simulation on user behavior, such as cognitive
workload, or to identify biases in behavior between
modalities. In addition, this methodology can also be
used to validate the suitability of VR tools against the
same use case in a real context. Another original as-
pect of the workflow is to enable a behavioral compar-
ison between the VR HMD and the Immersive room
modality, which is very rarely addressed in the exist-
ing literature.
We have illustrated the implementation of this
workflow with an archaeological use case of an ar-
tifact observation task, detailed in (Dumonteil et al.,
2024). In this case, the aim of this on-going study is
to detect possible biases in the performance of archae-
ological tasks in virtual reality. The same approach
can also be applied to other application domains.
Nevertheless, this methodology still has remain-
ing challenges depending on the implementation
choices. First of all, the use of disparate ET sys-
tems for the different modalities, in spite of data post-
processing, may lead to differences in eye-tracking re-
sults only due to the modalities distinction, in terms
of data quality or gaze estimation accuracy. This is
specifically significant in immersive rooms because
we believe that a better and more comfortable device
for eye-tracking in this environment could improve
the comfort and the user’s behavior, according to the
potential discomfort of the set up with two superposed
glasses. Subsequently , the sampling rate of the sys-
tems used for each modality can vary considerably
(from 50 Hz to 200+ Hz, depending on the devices’
parameters). So it is necessary to adapt all data logs
to a uniform rate in order to ensure the consistency of
the data across all modalities.
As mentioned above, the restitution part of the
workflow could be enriched with a multitude of ad-
ditional measurements, either for metrics production,
or for gaze events detection. In this case, the impor-
GRAPP 2025 - 20th International Conference on Computer Graphics Theory and Applications
220

tant point is to use the same algorithm in the different
modalities. For this reason, the data acquisition and
processing part of the workflow has also been treated
with particular care.
5 CONCLUSION
This paper presents a workflow design for the genera-
tion of standardized and comparable eye-tracking and
behavioral data, including directions and suggestions
for analyzing and presenting the results using metrics
and visualizations adapted to a 3D context. While
most of the used tools and methods to analyze eye-
tracking data are based on a 2D context, generalizing
their use to a 3D context enables a more complete un-
derstanding of user behavior, despite some challenges
to correctly process and display such data. The goal
of this methodology is to compare use cases in real
and virtual environments, addressing the challenges
of comparing data collected using different devices
and in different environments. The approach is spe-
cially focused on visual exploration tasks on a single
object, in real and virtual modalities. The approach
was illustrated with the implementation of an archae-
ological use case.
Further works will involve the evaluation of our
method in different contexts, and on the other hand,
measure the effectiveness of the proposed implemen-
tation over other methods of eye-tracking. Our work-
flow could also be applied to other application do-
mains and extended to tasks beyond object observa-
tion.
ACKNOWLEDGEMENTS
This work was partially funded by Equipex+ Con-
tinuum ANR-21-ESRE-0030 and CNRS MITI AAP
Digital Twin AJAX.
REFERENCES
Blascheck, T., Kurzhals, K., Raschke, M., Burch, M.,
Weiskopf, D., and Ertl, T. (2017). Visualization of
Eye Tracking Data: A Taxonomy and Survey. Com-
puter Graphics Forum, 36(8):260–284.
Brookes, J., Warburton, M., Alghadier, M., Mon-Williams,
M., and Mushtaq, F. (2020). Studying human behav-
ior with virtual reality: The Unity Experiment Frame-
work. Behavior Research Methods, 52(2):455–463.
Cauliez, J., Delaunay, G., and Duplan, V. (2002). Nomen-
clature et m
´
ethode de description pour l’
´
etude des
c
´
eramiques de la fin du N
´
eolithique en Provence.
Pr
´
ehistoires M
´
editerran
´
eennes, (10-11).
Duchowski, A. T., Krejtz, K., Volonte, M., Hughes, C. J.,
Brescia-Zapata, M., and Orero, P. (2022). 3d gaze in
virtual reality: vergence, calibration, event detection.
Procedia Computer Science, 207:1641–1648.
Dumonteil, M., Gouranton, V., Mac
´
e, M. J., Nicolas, T.,
and Gaugne, R. (2024). Do we study an archaeolog-
ical artifact differently in vr and in reality? In ICAT-
EGVE 2024-joint 34th International Conference on
Artificial Reality and Telexistence & the 29th Euro-
graphics Symposium on Virtual Environments, pages
1–9.
Garrido-Jurado, S., Mu
˜
noz-Salinas, R., Madrid-Cuevas,
F. J., and Mar
´
ın-Jim
´
enez, M. J. (2014). Auto-
matic generation and detection of highly reliable fidu-
cial markers under occlusion. Pattern Recognition,
47(6):2280–2292.
Gulhan, D., Durant, S., and Zanker, J. M. (2021). Simi-
larity of gaze patterns across physical and virtual ver-
sions of an installation artwork. Scientific Reports,
11(1):18913.
Herman, L., Popelka, S., and Hejlova, V. (2023).
Eye-tracking Analysis of Interactive 3D Geovisu-
alization. Journal of Eye Movement Research,
10(3):10.16910/jemr.10.3.2.
Javerliat, C., Villenave, S., Raimbaud, P., and Lavou
´
e, G.
(2024). PLUME: Record, Replay, Analyze and Share
User Behavior in 6DoF XR Experiences. IEEE TVCG,
30(5):2087–2097.
Jogeshwar, A. K. and Pelz, J. B. (2021). GazeEnViz4D: 4-
D Gaze-in-Environment Visualization Pipeline. Pro-
cedia Computer Science, 192:2952–2961.
Kim, Y., Varshney, A., Jacobs, D. W., and Guimbreti
`
ere, F.
(2010). Mesh saliency and human eye fixations. ACM
Transactions on Applied Perception, 7(2):12:1–12:13.
Kollenberg, T., Neumann, A., Schneider, D., Tews, T.-K.,
Hermann, T., Ritter, H., Dierker, A., and Koesling, H.
(2010). Visual search in the (un)real world: how head-
mounted displays affect eye movements, head move-
ments and target detection. In Proc. of ACM Symp. on
ETRA, pages 121–124.
Komogortsev, O. V. and Karpov, A. (2013). Automated
classification and scoring of smooth pursuit eye move-
ments in the presence of fixations and saccades. Be-
havior Research Methods, 45(1):203–215.
Kurzhals, K., Hlawatsch, M., Heimerl, F., Burch, M., Ertl,
T., and Weiskopf, D. (2016). Gaze Stripes: Image-
Based Visualization of Eye Tracking Data. IEEE
TVCG, 22(1):1005–1014.
Kurzhals, K. and Weiskopf, D. (2013). Space-Time Visual
Analytics of Eye-Tracking Data for Dynamic Stim-
uli. IEEE Transactions on Visualization and Com-
puter Graphics, 19(12):2129–2138. Number: 12.
Li, T. (2021). 3d representation of eyetracking data: An im-
plementation in automotive perceived quality analysis
(dissertation). Digitala Vetenskapliga Arkivet.
Li, T.-H., Suzuki, H., and Ohtake, Y. (2020). Visualization
of user’s attention on objects in 3D environment using
A Method for Standardizing Eye-Tracking and Behavioral Data in Real and Virtual Environments
221

only eye tracking glasses. Journal of Computational
Design and Engineering, 7(2):228–237. Number: 2.
Li, X., C¸
¨
oltekin, A., and Kraak, M.-J. (2010). Visual Explo-
ration of Eye Movement Data Using the Space-Time-
Cube. In Fabrikant, S. I., Reichenbacher, T., van Krev-
eld, M., and Schlieder, C., editors, Geographic Infor-
mation Science, pages 295–309. Springer.
Liu, M., Li, Y., and Liu, H. (2020). 3D Gaze Estimation
for Head-Mounted Eye Tracking System With Auto-
Calibration Method. IEEE Access, 8:104207–104215.
Llanes-Jurado, J., Mar
´
ın-Morales, J., Guixeres, J., and
Alca
˜
niz, M. (2020). Development and Calibration of
an Eye-Tracking Fixation Identification Algorithm for
Immersive Virtual Reality. Sensors, 20(17):4956.
Mizuchi, Y. and Inamura, T. (2018). Evaluation of Human
Behavior Difference with Restricted Field of View in
Real and VR Environments. In IEEE Int. Symp. on
Robot and Human Interactive Communication (RO-
MAN), pages 196–201.
Onkhar, V., Dodou, D., and de Winter, J. C. F. (2023). Eval-
uating the Tobii Pro Glasses 2 and 3 in static and dy-
namic conditions. Behavior Research Methods.
Paletta, L., Santner, K., Fritz, G., Mayer, H., and Schram-
mel, J. (2013). 3D attention: measurement of visual
saliency using eye tracking glasses. In ACM CHI EA
’13 Extended Abstracts on Human Factors in Comput-
ing Systems, pages 199–204.
Pathmanathan, N.,
¨
Oney, S., Becher, M., Sedlmair, M.,
Weiskopf, D., and Kurzhals, K. (2023). Been There,
Seen That: Visualization of Movement and 3D Eye
Tracking Data from Real-World Environments. Com-
puter Graphics Forum, 42(3):385–396.
Pfeiffer, T. (2012). Measuring and visualizing attention in
space with 3D attention volumes. In Proc. of the ACM
Symp. on ETRA, pages 29–36.
Pfeiffer, T. and Memili, C. (2016). Model-based real-time
visualization of realistic three-dimensional heat maps
for mobile eye tracking and eye tracking in virtual re-
ality. In Proc. of the ACM Symp. on ETRA, pages 95–
102.
Pfeiffer, T., Renner, P., and Pfeiffer-Leßmann, N. (2016).
EyeSee3D 2.0: model-based real-time analysis of
mobile eye-tracking in static and dynamic three-
dimensional scenes. In Proc. of the ACM Symp. on
ETRA, pages 189–196.
Pfeil, K., Taranta, E. M., Kulshreshth, A., Wisniewski, P.,
and LaViola, J. J. (2018). A comparison of eye-head
coordination between virtual and physical realities. In
Proc. ACM Symp. on Applied Perception, pages 1–7.
Pomplun, M. and Sunkara, S. (2019). Pupil dilation as an
indicator of cognitive workload in human-computer
interaction. In Human-Centered Computing, pages
542–546. CRC Press.
Reipschl
¨
ager, P., Brudy, F., Dachselt, R., Matejka, J., Fitz-
maurice, G., and Anderson, F. (2022). AvatAR: An
Immersive Analysis Environment for Human Motion
Data Combining Interactive 3D Avatars and Trajecto-
ries. In Proc. of ACM CHI, pages 1–15.
Salvucci, D. and Goldberg, J. (2000). Identifying fixations
and saccades in eye-tracking protocols. In Proc. of
ACM Symp. ETRA, pages 71–78.
Startsev, M., Agtzidis, I., and Dorr, M. (2019). 1D CNN
with BLSTM for automated classification of fixations,
saccades, and smooth pursuits. Behavior Research
Methods, 51(2):556–572.
Stellmach, S., Nacke, L., and Dachselt, R. (2010). Ad-
vanced gaze visualizations for three-dimensional vir-
tual environments. In Proc. of ACM Symp. ETRA,
pages 109–112.
Sundstedt, V. and Garro, V. (2022). A Systematic Review of
Visualization Techniques and Analysis Tools for Eye-
Tracking in 3D Environments. Frontiers in Neuroer-
gonomics, 3.
Takahashi, N., Inamura, T., Mizuchi, Y., and Choi, Y.
(2021). Evaluation of the difference of human behav-
ior between vr and real environments in searching and
manipulating objects in a domestic environment. In
Proc. IEEE Int. Conf. on Robot & Human Interactive
Communication (RO-MAN), pages 454–460.
Takahashi, R., Suzuki, H., Chew, J. Y., Ohtake, Y., Na-
gai, Y., and Ohtomi, K. (2018). A system for three-
dimensional gaze fixation analysis using eye tracking
glasses. Journal of Computational Design and Engi-
neering, 5(4):449–457.
Ugwitz, P., Kvarda, O., Ju
ˇ
r
´
ıkov
´
a, Z.,
ˇ
Sa
ˇ
sinka,
ˇ
C., and
Tamm, S. (2022). Eye-Tracking in Interactive Virtual
Environments: Implementation and Evaluation. Ap-
plied Sciences, 12(3):1027.
Villenave, S., Cabezas, J., Baert, P., Dupont, F., and Lavou
´
e,
G. (2022). XREcho: a unity plug-in to record and
visualize user behavior during XR sessions. In Proc.
of ACM Multimedia Systems Conf., pages 341–346.
Wang, X., Lindlbauer, D., Lessig, C., and Alexa, M. (2017).
Accuracy of Monocular Gaze Tracking on 3D Geom-
etry. In Eye Tracking and Visualization, pages 169–
184. Springer: Mathematics and Visualization.
Wang, X., Lindlbauer, D., Lessig, C., Maertens, M., and
Alexa, M. (2016). Measuring the Visual Salience of
3D Printed Objects. IEEE Computer Graphics and
Applications, 36(4):46–55.
Willemsen, P., Colton, M. B., Creem-Regehr, S. H., and
Thompson, W. B. (2009). The effects of head-
mounted display mechanical properties and field of
view on distance judgments in virtual environments.
ACM Transactions on Applied Perception, 6(2):8:1–
8:14.
Zemblys, R., Niehorster, D. C., Komogortsev, O., and
Holmqvist, K. (2018). Using machine learning to de-
tect events in eye-tracking data. Behavior Research
Methods, 50(1):160–181.
Zhang, L., Wade, J., Swanson, A., Weitlauf, A., Warren, Z.,
and Sarkar, N. (2015). Cognitive state measurement
from eye gaze analysis in an intelligent virtual real-
ity driving system for autism intervention. In 2015
international conference on affective computing and
intelligent interaction (ACII), pages 532–538. IEEE.
GRAPP 2025 - 20th International Conference on Computer Graphics Theory and Applications
222
